Direction of Arrival Estimation for Nanoscale Sensor Networks
Nanoscale wireless sensor networks (NWSNs) could be within reach soon using graphene-based antennas, which resonate in 0.1-10 terahertz band. To conserve the limited energy available at nanoscale, it is expected that NWSNs will communicate using extr…
Authors: Shree M. Prasad, Trilochan Panigrahi, Mahbub Hassan
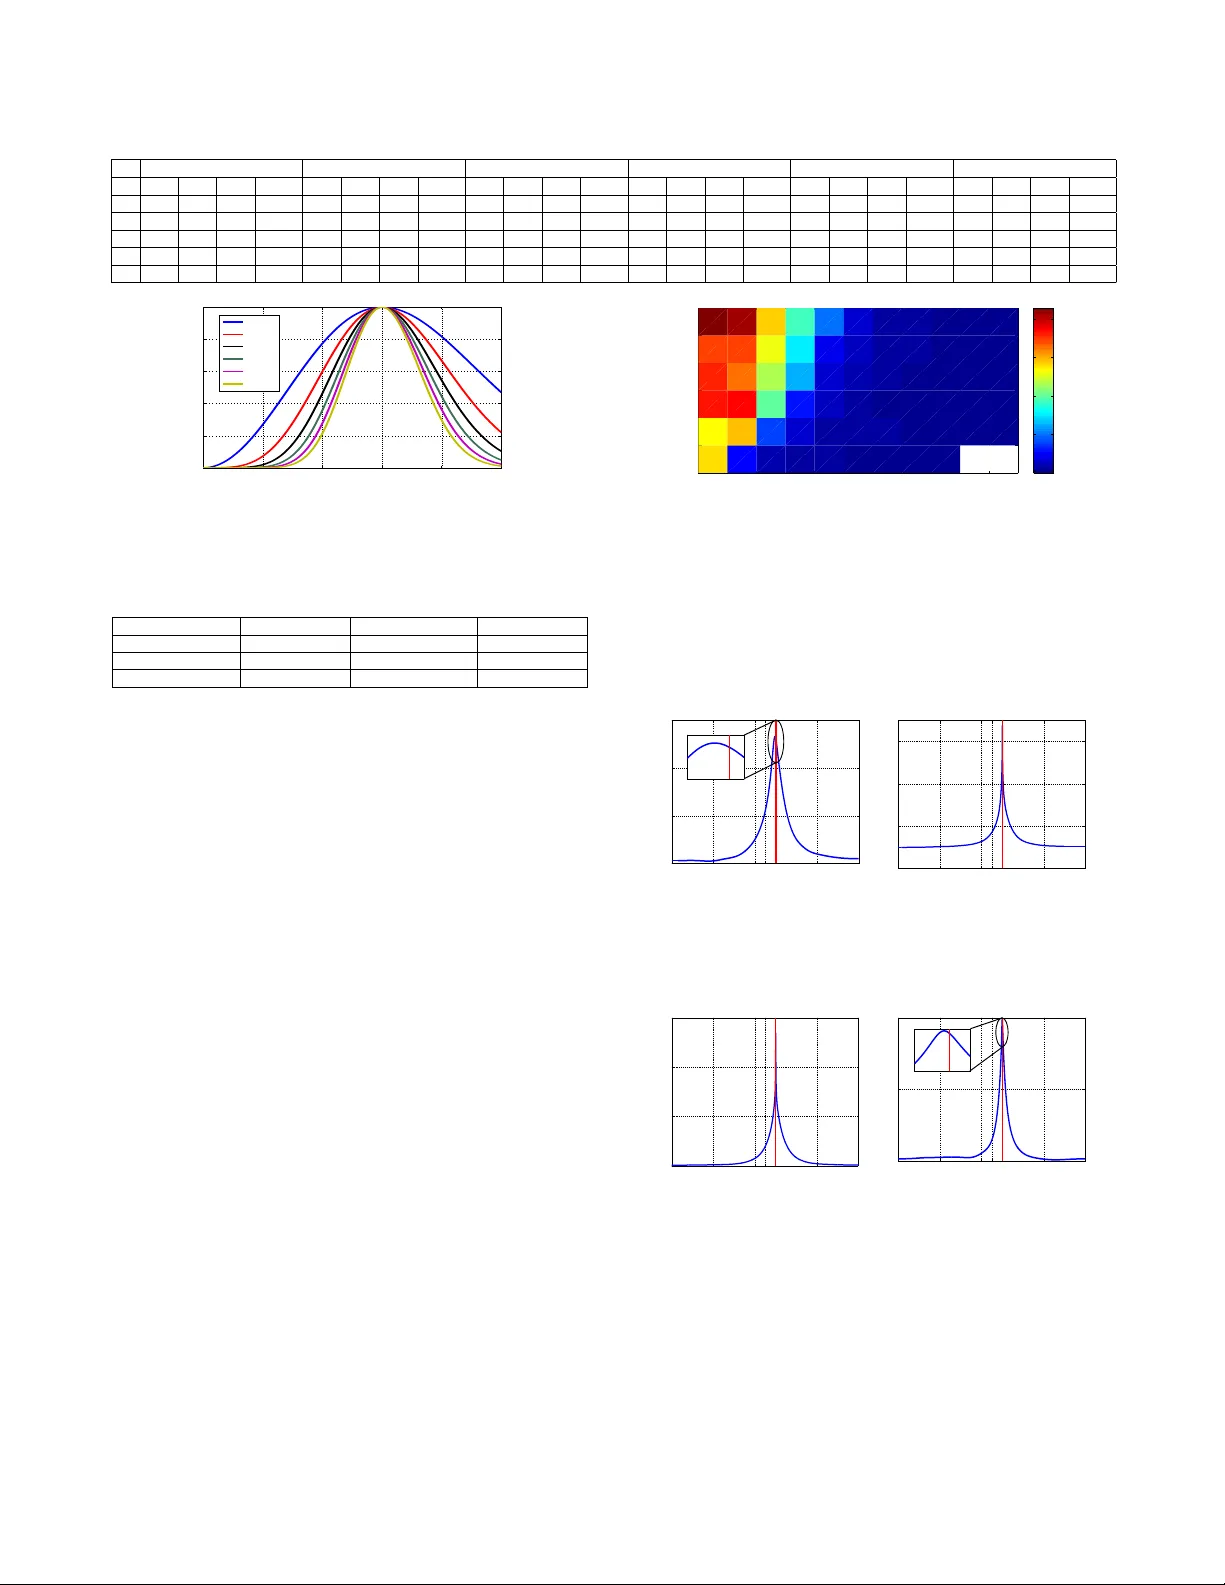
Direction of Arrival Estimation for Nanoscale Sensor Networks Shree Prasad M. Department of Electronics and Communication Engineering National Institute of T echnology Goa Farmagudi, Goa shreeprasadm@gmail.com Trilochan Panigrahi Department of Electronics and Communication Engineering National Institute of T echnology Goa Farmagudi, Goa tpanigrahi@nitgoa.ac.in Mahbub Hassan School of Computer Science and Engineering University of New South W ales Sydney, A ustralia mahbub@cse.unsw .edu.au ABSTRA CT Nanoscale wireless sensor networks (NWSNs) could be within reach soon using graphene-based antennas, which resonate in 0.1-10 ter- ahertz band. T o conser ve the limited energy available at nanoscale, it is e xpecte d that NWSNs will communicate using extremely short pulses on the order of femtoseconds. Accurate estimation of di- rection of arrival (DO A) for such terahertz pulses will help realize many useful applications for N WSNs. In this paper , using the well- known MUltiple SIgnal Classication (MUSIC) algorithm, we study DO A estimation for N WSNs for dierent energy levels, distances, pulse shapes, and frequencies. Our analyses rev eal that the best DO A estimation is achieved with the rst order Gaussian pulses, which emit their p eak energy at 6 THz. Based on Monte Carlo simulations, we demonstrate that MUSIC algorithm is capable of estimating DOA with r oot mean square error less than one degree from a distance of ar ound 6 meter for pulse energy as little as 1 atto Joule. KEY W ORDS Direction of Arrival, MUSIC algorithm, T erahertz pulses, Nanoscale Sensor Networks. A CM Reference Format: Shree Prasad M., Trilochan Panigrahi, and Mahbub Hassan. 2018. Direction of Arrival Estimation for Nanoscale Sensor Netw orks. In NANOCOM ’18: NANOCOM ’18: ACM The Fifth A nnual International Conference on Nanoscale Computing and Communication, September 5–7, 2018, Reykjavik, Iceland . A CM, New Y ork, NY , USA, 6 pages. https://doi.org/10.1145/3233188.3233210 1 IN TRODUCTION Signicant progress in nanotechnology has made it possible to fabricate nanosensors from novel nano-materials that can sense chemical compounds in extremely low concentrations, and viruses or bacteria in very small p opulations. The limited sensing range of these nanosensors can b e extended by enabling wireless com- munication between them, which creates the so called nanoscale wireless sensor networks (NWSNs). With wider coverage, NWSNs promise new sensing and detection applications in biomedical, en- vironmental, industrial and military elds [4]. Permission to make digital or hard copies of all or part of this work for personal or classroom use is granted without fee provided that copies are not made or distributed for prot or commercial advantage and that copies bear this notice and the full citation on the rst page. Copyrights for components of this work owned by others than ACM must be honored. Abstracting with credit is permitted. T o cop y otherwise, or republish, to post on servers or to redistribute to lists, requires prior specic permission and /or a fee. Request permissions from permissions@acm.org. NANOCOM ’18, September 5–7, 2018, Reykjavik, Iceland © 2018 Association for Computing Machinery. ACM ISBN 978-1-4503-5711-1/18/09. . . $15.00 https://doi.org/10.1145/3233188.3233210 The nanoscale form factor imposes several interesting charac- teristics in N WSNs. Nano devices are expected to communicate in terahertz band (0.1 - 10 THz), as the nano antenna made of graphene is shown to eciently radiate in this band [ 5 ]. Due to the size and energy constraints of nanosensor devices, carrier-less pulse based communication scheme is b eing considered for N WSN. Gaussian pulse and its higher order time derivativ e of few hundred femtoseconds long duration is used to represent symbols for such communication [ 6 ]. Researchers are using these new properties to explore new communication, sensing, and detection methods in NWSNs. The use of localization techniques such as direction of arrival (DO A), time of arrival (TO A) and received signal strength (RSS) has many benets for N WSNs. For example, w orks that aim to detect and localize events from a single pulse transmission [ 3 , 12 ], can use localization techniques to localize the sensor node that dete cted the event and transmitted the pulse. Beamforming r esearch in terahertz networks [ 11 ] can exploit DO A to select the beam direction using in-band terahertz signals. Localization techniques in N WSN can be used to track the mobility of events at nanoscale. Many other benets of localization can b e envisaged. Among the three dier ent localization techniques, DO A estimation technique is mor e suitable for NWSNs due to the following reasons [ 8 ]: 1) TOA technique requires accurate timing synchronization between transmitter and receiver . Hence it is dicult to have extra circuity for achieving timing synchronization in a size constrained nanosensor node. 2) RSS technique requires prior knowledge of channel characteristics and transmit power by nanosesnor node. Since the nanosensor de- vices are expected to harvest energy from its ambient envir onment, the a priori knowledge of transmitted power is not known. Although DO A is an established eld of research with numer ous works reported for many dierent scenarios, to the best of our knowledge, its potential for NWSNs has not been explored in the literature. The closest work reported is DO A estimation in pulse- based ultra-wideband (UWB) networks [ 2 , 7 ]. However , these works are restricted to a few GHz bandwidth with nanosecond pulses emit- ting relatively high energy as such devices are expected to operate with large batteries or even grid power . N WSNs use frequencies in the THz band, extremely short pulses on the or der of femtoseconds, which contains signal within terahertz bandwidth. The channel propagation in the terahertz band is aecte d by molecular noise, which introduces further dynamics to DO A. The aim of this paper is to systematically study the potentials of DOA in N WSNs by var ying a range of parameters for the ter- ahertz Gaussian pulse including energy , order of time derivative, center frequency , and bandwidth. W e also study the accuracy of DO A estimation as a function of distance between the emitter and NANOCOM ’18, September 5–7, 2018, Reykjavik, Iceland Shree Prasad M., Trilochan Panigrahi, and Mahbub Hassan the sensor array at the detection point. Our contributions can be summarized as follows: • Using the terahertz channel characteristics for NWSN, we compare the DOA estimation performance of dierent higher time derivative order Gaussian pulse with dierent center frequencies using MUSIC algorithm. The comparisons are obtained by varying the pulse energy as well as the distance between the emitter and the array receiver . W e also study the impact of the number of snapshots on the performance of DO A estimates. T o the b est of our knowledge, this is the rst such study . W e obtain se veral important and interesting results. • Our analyses show that DOA performance improves with lower orders and higher frequencies. This suggests that for NWSNs, the best performance for DO A can be achieved with the rst order Gaussian pulses emitting their peak energies at 6 THz center frequency . W e nd that MUSIC can achieve DOA with RMSE less than one degree from a distance of 6meters for pulse energy as little as 1 atto Joule. This is a remarkable performance for MUSIC, which can enable many applications in NWSNs. • Our study rev eals that for high frequency , distance has no signicant impact for up to 1 cm, but RMSE starts to increase rapidly after that. In contrast, for low frequency , RMSE in- creases for increasing distance ev en below 1 cm. • For high frequency , pulse energy has little eect on DO A performance. Similarly , pulse energy has little impact on DO A estimate for high order and low frequency . Pulse en- ergy , however , has signicant eect on DO A performance for lo w order and low fr equency pulses, in which case RMSE increases rapidly with decreasing pulse energy . The rest of the pap er is structured as follows. T erahertz channel impulse response and molecular absorption noise are re viewed in Section 2. In section 3, system mo del is described and the application of wideband MUSIC algorithm is consider ed for DOA estimation of higher order Gaussian pulses for terahertz channel. In section 4, the performance of MUSIC DOA estimation algorithm is evaluated for dierent higher order Gaussian pulses with dierent center frequencies. Section 5 concludes the paper . 2 TERAHERTZ CHANNEL The propagation of ele ctromagnetic waves in T erahertz channel depends on its chemical comp osition as it is aecte d due to attenu- ation and molecular absorption noise. The chemical composition of the terahertz channel is characterized by medium absorption coecient k ( f ) at frequency f . The eect of channel attenuation and molecular absorption noise will be signicant at molecular resonant frequencies for long range communication distances. In the following subsections, the characteristics of terahertz channel and molecular absorption noise is described[6]. 2.1 T erahertz Channel Impulse Response The pulse propagating in a terahertz channel suers attenuation due to the spreading loss and the molecular absorption loss. The terahertz channel impulse response accounting for both the spread- ing loss and the molecular absorption loss in frequency domain is represented as[6] H ( f , d r ) = H s p r e a d ( f , d r ) H ab s ( f , d r ) (1) where H s p r e a d ( f , d r ) and H ab s ( f , d r ) represents spreading loss and molecular absorption loss, and are given by H s p r e a d ( f , d r ) = c o 4 π d r f o exp − j 2 π f d r c o (2) H ab s ( f , d r ) = exp( − 0 . 5 k ( f ) d r ) (3) where f denotes frequency , c o is the velocity of light in vacuum, f o is the center frequency of the graphene antenna, d r is the path length, and k ( f ) is the medium absorption coecient. The me dium absorption coecient k ( f ) of the terahertz channel at fr equency f composed of Q typ e molecules is given as k ( f ) = Q X q =1 x q K q ( f ) . (4) where x q is the mole fraction of molecule type q and K q is the absorption coecient of individual molecular spe cies. 2.2 Molecular Absorption Noise In terahertz channel, the main contribution for ambient noise comes from the molecular absorption noise . This noise arises be cause of r e- radiation of part of wave energy that was absorb ed by the molecules in the medium during transmission of the pulses. Hence, molecular absorption noise is present at the receiver only during transmission of pulses. The total molecular absorption noise p.s.d. S N ( f , d r ) is the sum of background atmospheric noise p.s.d S N B ( f , d r ) and the self induced noise p.s.d. S N P ( f , d r ) and is given as[6] S N ( f , d r ) = S N B ( f , d r ) + S N P ( f , d r ) (5) S N B ( f , d r ) = lim d r →∞ k B T 0 ( 1 − exp ( − k ( f ) d r )) c 0 √ 4 π f 0 ! 2 (6) S N P ( f , d r ) = S P ( f ) ( 1 − exp ( − k ( f ) d r )) c 0 4 π d r f 0 2 (7) where k B is the Boltzmann constant, T 0 is the room temperature and S P ( f ) represents p.s.d. of transmitted pulse . Figure 1: N-element ULA at the nanosink receiving pulses from nearby nanosensors Camera Ready V ersion Direction of Arrival Estimation for Nanoscale Sensor Networks NANOCOM ’18, September 5–7, 2018, Reykjavik, Iceland 3 SYSTEM MODEL The DO A estimation of nanosensor nodes is performed by a nano sink as shown in Fig. 1. The nano sink consists of uniform linear array (ULA) with N antenna elements. Nanosensor no des in N WSN is envisioned to communicate using carrier-less pulse based trans- mission. In this paper , these pulses are assumed as higher order time derivatives of Gaussian pulses of few hundred femtoseconds dura- tion. The Fourier representation of time derivative of the Gaussian pulse with order of derivative n is also Gaussian shaped and is represented as G n ( f ) = ( j 2 π f ) n a n e − 0 . 5 ( 2 π σ f ) 2 (8) where a n is the normalizing constant to adjust the pulse energy , and σ is the standard deviation of the Gaussian pulse in seconds. The center frequency of p.s.d. of Gaussian pulse increases with time derivative order and is repr esented as [9] f c = √ n 2 π σ (9) The higher order Gaussian pulses transmitted by nanosensor nodes is assumed to be uniformly spaced in time and is represented as p n ( t ) = ∞ X r = −∞ a r д n t − r T p (10) where д n ( t ) represents Gaussian pulse of order n , a r is the infor- mation symbol sequence and T p is dened as total pulse duration of Gaussian pulse. Though the higher order Gaussian pulses have innite time duration, here it is assumed that T p = 10 σ [ 9 ]. T p is the time interval which contains more than 99 . 99% of pulse energy . Assuming Bi-Phase modulation is used to represent information symbol[ 9 , 13 ], the PSD of transmitted signal p n ( t ) by nanosesnor device is represented as S n ( f ) = | G n ( f ) | 2 T p (11) 3.1 Problem Formulation Consider a ULA with inter-element spacing of d s m as shown in Fig.1. Here, it is considered that a single nanosensor node to b e localized is present at a distance of d r from ULA. This transmission distance is assumed to be in the far-eld region of ULA. The received wideband higher order Gaussian pulse at the output of the i th element in ULA is represented as [6]. y i ( t , d r ) = p n ( t − τ i ) ∗ h ( t , d r ) + v i ( t , d r ) (12) τ i = [( i − 1 ) d s sin ( θ )] / c o (13) where h ( t , d r ) is the terahertz channel impulse response between ULA and nanosensor node in θ direction. τ i represents time delay at i th antenna element of ULA with reference to antenna element 1 . v i represents molecular absorption noise created between element i of ULA and nanosensor node. When the signal received at the output of the ULA is observed for suciently large time interval ∆ T , the Fourier representation of (12) is given as[10] Y i ( f l , d r ) = e − j 2 π f l τ i P n ( f l ) H ( f l , d r ) + V i , ( f l , d r ) , for l = 0 , · · · , L (14) where f l is the frequency bin, P n ( f l ) , H ( f l , d r ) , and V i , ( f , d r ) are Fourier coecients of Gaussian pulse, terahertz channel impulse response and molecular absorption noise respectively . Further the output of array is observed for K non-overlapping time interval ∆ T and Fourier coecients is computed for each time interval. Her e, K is called as frequency snapshot number . The numb er of frequency bins L is given as L = ⌊ B · ∆ T ⌋ + 1 (15) where ⌊ ·⌋ is the oor operator , B is the terahertz channel bandwidth and the observation time interval ∆ T is signicantly greater than the propagation time across ULA. For a Gaussian pulse of particular order and center fr equency , ∆ T T p number of pulses are received at ULA over single observation interval ∆ T . Now , the Fourier coe- cients at frequency f l across N sensors for K number of frequency snapshots is represented in matrix form as Y ( f l , d r ) = H ( f l , d r ) a ( f l ) P n ( f l ) + V ( f l , d r ) (16) where Y ( f l , d r ) ∈ C N × K , V ( f l , d r ) ∈ C N × K and P n ( f l ) ∆ = [ P n 1 ( f l ) , · · · , P n K ( f l )] . a ( f l ) = h 1 , e − j 2 π f l τ 1 , · · · , e − j 2 π f l τ N i T is the array manifold vector . The covariance matrix R Y ( f l , d r ) of Y ( f l , d r ) is given as R Y ( f l , d r ) = E h Y ( f l , d r ) Y ( f l , d r ) H i (17) where ( · ) H denotes conjugate transpose and E [ · ] represents expec- tation. The term h Y ( f l , d r ) Y ( f l , d r ) H i in (17) is H ( f l , d r ) a ( f l ) P n ( f l ) · ( H ( f l , d r ) a ( f l ) P n ( f l )) H + V ( f l , d r ) V H ( f l , d r ) + H ( f l , d r ) a ( f l ) P n ( f l ) · ( V ( f l , d r )) H + V ( f l , d r ) ( H ( f l , d r ) a ( f l ) P n ( f l )) H (18) T aking e xpectation on (18) and since self induced noise is corr elated with the transmitted pulse and using (1) and (7) , the expectation of third term on the right hand side of (18) reduces to (19) E h ( H ( f l , d r ) a ( f l ) P n ( f l )) · ( V ( f l , d r )) H i = | | P n | | 2 c 0 4 π d r f o 2 √ ( 1 − exp ( − x )) exp ( 0 . 5 x ) exp − j 2 π f d r c o a m ( f l ) 1 1 × N where | | · | | 2 denotes l 2 norm, x = k ( f l ) · d r and 1 1 × N is ones vector of size 1 × N . The term c o 4 π d r f o 2 ≪ 1 , as center frequency f c of higher order Gaussian pulses is considered to be greater than 2 THz. Based on these assumptions (19) is approximated as zero. Similar arguments can be made for fourth term in (18) and can approximated to zero. Base d on the above assumptions, (17) is simplied as R Y ( f l , d r ) = | P n ( f l ) | 2 | H ( f l , d r ) | 2 a ( f l ) a ( f l ) H + σ 2 ( f l , d r ) I N (20) here E V ( f l , d r ) V H ( f l , d r ) = σ 2 ( f l , d r ) is the noise variance due to transmission of Gaussian pulse around narrow frequency sub-band centered at frequency f l and I N is the identity matrix of size N × N . Eqn. (20) is same as the covariance matrix at the output of ULA assuming noise to be indep endent of Gaussian pulses emitted by nanosensor devices. σ 2 ( f l , d r ) is computed as σ 2 ( f l , d r ) = R S N ( f l , d r ) d f (21) 3.2 DO A estimation of Gaussian Pulses Wideband DOA estimation methods is used for localizing nano- devices due to ultra wide frequency bandwidth of higher order Gaussian pulses. Here, incoherent multiple signal classication (IMUSIC) DO A estimation technique is use d, which is based on eigen value decomposition (EVD) of the r eceived covariance matrix R Y ( f l , d r ) and it is represented as Camera Ready V ersion NANOCOM ’18, September 5–7, 2018, Reykjavik, Iceland Shree Prasad M., Trilochan Panigrahi, and Mahbub Hassan (22) R Y ( f l , d r ) = E s ( f l , d r ) Λ s ( f l , d r ) E H s ( f l , d r ) + E n ( f l , d r ) Λ n ( f l , d r ) E H n ( f l , d r ) where E s ( f l , d r ) and E n ( f l , d r ) are signal and noise eigenvector matrix and Λ s ( f l , d r ) and Λ n ( f l , d r ) are diagonal matrix corre- sponding to the eigenvalues of signal and noise vector space. In IMUSIC DO A estimation technique, narrowband MUSIC DO A estimation technique is independently applie d to each L number of frequency bins. The IMUSIC wideband DOA estimation technique is given as P IMUSIC ( ˆ θ , d ) = L X l =1 a H ( f l , θ ) a ( f l , θ ) a H ( f l , θ ) E n ( f l , d r ) E H n ( f l , d r ) a ( f l , θ ) (23) Eqn. (23) is called as IMUSIC sp ectrum and it is obser ved that, the quality of DO A estimate depends on communication distance between nanosensor device and ULA. The DOA estimate from IMUSIC spectrum is estimated as ˆ θ ( d ) = arg max θ h P IMUSIC ( ˆ θ , d ) i (24) Further , the received covariance matrix at each frequency bin f l is estimated as ˆ R Y ( f l , d r ) = 1 K Y ( f l , d r ) Y H ( f l , d r ) (25) 4 SIMULA TION RESULTS In this section, simulation results are presented for wideband DOA estimation of a single nanosensor de vice source. IMUSIC algorithm as explained in section 3.1 is implemented using MA TLAB R2014a 4.1 Parameters and Performance Metrics The terahertz channel frequency band is considered from 1 THz to 10 THz. In the simulation, terahertz channel is assumed as standard air medium in summer with 1 . 86% concentration of water vapor molecules. The High-resolution transmission molecular absorption (HI TRAN) database is used to obtain the molecular absorption co- ecient k ( f ) of the terahertz channel[ 1 ]. The accuracy of DOA estimation algorithm for single nanosensor de vice source is mea- sured in terms of root mean square error (RMSE) and is dened as RMSE = v t 1 N r u n N r u n X i =1 ˆ θ ( i ) − θ 2 (26) where N r u n is the number of Monte-Carlo simulations, ˆ θ ( i ) is the estimate of DOA in the i t h run and θ is the true DOA of the nanosensor device. The DO A estimate obtaine d in the i t h run cor- responds to location of highest peak in the MUSIC sp ectrum. The number antenna elements N in ULA is selected as 8 and distance between consecutive antenna elements is half the wavelength λ m i n of frequency 10 THz, that is d s = 15 µ m to avoid spatial aliasing. Since the DO A estimation accuracy decr eases with smaller antenna spacing in ULA, terahertz band is considered from 1 THz onwards in the simulation. Thus, the maximum propagation time ∆ T m a x across the ULA is 0.35 ps. For ULA with aperture D = ( N − 1 ) d s , the nanodevice source is assumed to be at a distance greater than 2 ∗ D 2 / λ m i n , the far-eld region of ULA. The DO A of nanosen- sor device is considered as 10 . 25 ◦ . Since ∆ T ≫ ∆ T m a x [ 10 ], the observation time inter val ∆ T is assumed as 10 ps. Hence from (15) , the number of frequency bins L = 91 for the terahertz bandwidth B = 9 T H z . The total number of frequency snapshots K available is assumed as 50 and N r u n is selected as 100. In NWSN, nanosensor devices communicate by transmitting higher order time derivative Gaussian pulses. The time domain repr esen- tation Gaussian pulses and its corresponding normalized PSD from time derivative order n = 1 to 6 is shown in Fig. 2 and Fig.3 re- spectively . The center frequency and energy of these higher order Gaussian pulses is 6 THz and 1 aJ, respectively . In table 1, the half power frequencies f l and f h in THz and half power bandwidth B 3 d B in THz is summarized for dierent higher order Gaussian pulses at dierent center frequencies f c in THz , T p represents du- ration of pulse in ps and n represents the order of Gaussian pulse. 4.2 Impact of order and center frequency T o investigate the impact of order and frequency on DOA estimation error , we rst examine their impact on IMUSIC spectrum. The impact of dierent center frequencies, 2 THz vs. 6 THz, for the same order (rst order) is shown in Figs. 4(a) and 4(b), respectively . Similarly , the impact of dierent orders, rst vs. sixth, for the same center frequency (4 THz) is shown in Figs. 5(a) and 5(b), respe ctively . W e can see that the peak of IMUSIC sp ectrum is closer to the DO A value (10.25 degree) for the higher frequency (6 THz in Fig. 4(b)) and lower order (rst or der in Fig. 5( a)). A p ossible explanation −0.5 −0.25 0 0.25 0.5 −4 −2 0 2 4 Time [ps] Voltage [mV] First Order (a) −0.5 −0.25 0 0.25 0.5 −5 −2 0 2 4 Time [ps] Voltage [mV] Second Order (b) −0.5 −0.25 0 0.25 0.5 −4 −2 0 2 4 Time [ps] Voltage [mV] Third Order (c) −0.5 −0.25 0 0.25 0.5 −4 −2 0 2 4 Time [ps] Voltage [mV] Fourth Order (d) −0.5 −0.25 0 0.25 0.5 −4 −2 0 2 4 Time [ps] Voltage [mV] Fifth Order (e) −0.5 −0.25 0 0.25 0.5 −4 −2 0 2 4 Time [ps] Voltage [mV] Sixth Order (f ) Figure 2: Higher order time derivative Gaussian pulses of 1 aJ energy with 6 THz center frequency . Camera Ready V ersion Direction of Arrival Estimation for Nanoscale Sensor Networks NANOCOM ’18, September 5–7, 2018, Reykjavik, Iceland T able 1: Half p ower bandwidth of higher order Gaussian pulses at dierent center frequencies n = 1 n = 2 n = 3 n = 4 n = 5 n = 6 f c T p f l f h B 3 d B T p f l f h B 3 d B T p f l f h B 3 d B T p f l f h B 3 d B T p f l f h B 3 d B T p f l f h B 3 d B 2 0.79 0.96 3.27 3.27 1.12 1.23 2.88 1.64 1.37 1.36 2.71 1.35 1.59 1.44 2.61 1.71 1.77 1.49 2.54 1.04 1.94 1.54 2.49 0.95 3 0.53 1.44 4.90 3.46 0.75 1.85 4.32 2.47 0.91 2.04 4.07 2.02 1.06 2.16 3.92 1.75 1.18 2.24 3.82 1.57 1.29 2.31 3.74 1.43 4 0.39 1.92 6.54 4.61 0.56 2.46 5.76 3.29 0.68 2.72 5.42 2.70 0.79 2.88 5.22 2.34 0.88 2.99 5.09 2.09 0.97 3.08 4.99 1.91 5 0.31 2.40 8.18 5.77 0.45 3.08 7.20 4.12 0.55 3.40 6.78 3.37 0.63 3.60 6.53 2.92 0.71 3.74 6.36 2.62 0.77 3.85 6.24 2.39 6 0.26 2.88 9.81 6.92 0.37 3.70 8.64 4.94 0.45 4.09 8.14 4.05 0.53 4.32 7.84 3.51 0.50 4.49 7.64 3.14 0.64 4.62 7.49 2.87 0 2 4 6 8 10 0 0.2 0.4 0.6 0.8 1 Frequency [THz] Normalized PSD n = 1 n = 2 n = 3 n = 4 n = 5 n = 6 Figure 3: Normalized PSD of higher order Gaussian pulses with center frequency 6 THz. T able 2: RMSE values at dierent distances for rst order Gaussian pulse with energy 1 aJ and center frequency 6 THz with K = 1 frequency snapshots. Distance [m] RMSE Distance [m] RMSE 0.01 0.010105939 3 0.275689935 0.1 0.023144645 5 0.500921665 1 0.100274849 6 0.600167844 for this outcome is because the higher frequencies and lower orders lead to higher 3 dB bandwidth and shorter T p (see T able 1). Note that shorter T p means that the pulse can be transmitted with higher power for the same amount of energy . Next, w e focus on RMSE val- ues to quantify DOA estimation as a function of center frequencies and derivative orders of Gaussian pulses. The temperature graph in Fig.6 plots these RMSE values for pulse energy of 0.01 aJ and distance of 0.5 m (b est viewed in color). W e can clearly observe that RMSE decreases with lower orders and higher frequencies. This suggests that for N WSNs, the b est performance for DOA can be achieved with the rst or der Gaussian pulses emitting their peak energies at 6 THz center frequency . Thus, in table 2, we derive the RMSE values for dierent distances for rst order and 6 THz center frequency and 1 aJ energy . W e can see that IMUSIC with K = 1 frequency snapshot can achieve DOA estimation accuracy with RMSE less than one hundredth of a degree from a distance of 6 meter for pulse energy as little as 1 atto Joule . This is a remarkable performance for IMUSIC, which can enable many applications in NWSNs. 4.3 Impact of Distance Fig. 7 shows the DOA estimation p erformance as a function of distance between the emitter and the ULA. W e make the following interesting observations: (1) For high frequency (6 THz), distance has no signicant impact for up to 1 cm, but RMSE starts to increase rapidly after that (Figs.7(a) and 7( b)). A p ossible explanation for this outcome is due to negligible eect of molecular absorption noise for shorter transmission distances. Further , at this frequency , there is no signicant dierence between derivative orders of the Gaussian pulse, and (2) For low fr equency (2 THz), RMSE increases for increasing distance even below 1 cm except for rst order with high energy (100 aJ) as shown in Figs.7(c) and 7(d). At this frequency , rst order clearly outperforms 6th order , but for low energy (0.01 2 3 4 5 6 7 1 2 3 4 5 6 Frequency [THz] Order of Gaussian Pulse 0.008 0.2 0.4 0.6 0.8 Figure 6: DOA estimation accuracy as a function of fre- quency and derivative order of 0.01 aJ Gaussian pulses trans- mitted from a distance of 0.5 m aJ in 7(d)), RMSE for rst or der increases at a faster rate than that of 6th order . This rapid increase in RMSE for increasing distance is due to the increase in the eect of molecular absorption noise and terahertz path loss for large distances. −90 −50 −10 0 10 50 90 20 22 28 32 DOA Estimate [Degree] MUSIC Spectrum [dB] 8 11 29 31 (a) −90 −50 −10 0 10 50 90 15 25 35 45 50 DOA Estimate [Degree] MUSIC Spectrum [dB] (b) Figure 4: IMUSIC Spectrum for rst order Gaussian for two dierent center frequencies. The pulse energy is 0.01 aJ and the transmission distance is 0.5 m (a) Center frequency is 2 THz. (b) Center frequency is 6 THz. −90 −50 −10 0 10 50 90 20 30 40 50 DOA Estimate [Degree] MUSIC spectrum [dB] (a) −90 −50 −10 0 10 50 90 20 25 30 DOA Estimate [Degree] MUSIC spectrum [dB] 9 11 27 30 (b) Figure 5: MUSIC Spectrum for nanosensor device transmit- ting rst and sixth Gaussian pulse for center frequency 4 THz. The energy of both the Gaussian pulse are 0.01 aJ and the transmission distance is 0.5 m (a) Firth order Gaussian pulse. ( b) Sixth order Gaussian pulse. 4.4 Impact of Pulse Energy The dependence of DOA estimation accuracy on pulse energy is investigated in Fig. 8. W e make the following interesting observa- tions: (1) For high center frequency (6 THz), pulse energy has little Camera Ready V ersion NANOCOM ’18, September 5–7, 2018, Reykjavik, Iceland Shree Prasad M., Trilochan Panigrahi, and Mahbub Hassan 10 −3 10 −2 10 −1 10 0 10 −4 10 −3 10 −2 Distance [m] RMSE [Degree] First Order Sixth Order (a) 10 −3 10 −2 10 −1 10 0 10 −4 10 −3 10 −2 10 −1 Distance [m] RMSE [Degree] First Order Sixth Order (b) 10 −3 10 −2 10 −1 10 0 10 −4 10 −3 10 −2 10 −1 10 0 Distance [m] RMSE [Degree] First Order Sixth Order (c) 10 −3 10 −2 10 −1 10 0 10 −4 10 −2 10 0 10 2 Distance [m] RMSE [Degree] First Order Sixth Order (d) Figure 7: RMSE versus Distance for rst and sixth order Gaussian pulses for dierent energy values(a) First and Sixth order Gaussian pulse with energy 100 aJ and center frequency 6 THz. (b) First and Sixth order Gaussian pulse with energy 0.01 aJ and center frequency 6 THz. (c) First and Sixth order Gaussian pulse with energy 100 aJ and center frequency 2 THz. (d) First and Sixth order Gaussian pulse with energy 0.01 aJ and center frequency 2 THz. eect on DOA performance (bottom two curves), (2) pulse energy has little impact on DOA estimate for high or der (sixth order) and low center frequency of 2 THz (top curve), and (3) Pulse energy , howev er , has signicant ee ct on DOA performance for low or der (rst order ) and low frequency (2 THz) pulses. In this case , RMSE increases rapidly with decreasing pulse energy (see red curve). 10 −2 10 −1 10 0 10 1 10 2 10 −3 10 −2 10 −1 10 0 Pulse Energy [aJ] RMSE [Degree] n = 1 & fc = 6 THz n = 1 & fc = 2 THz n = 6 & fc = 6 THz n = 6 & fc = 2 THz Figure 8: RMSE versus Pulse Energy for rst and sixth order Gaussian pulse for two center frequencies 2 THz and 6 THz. Distance between ULA and nanosensor device is 0.1 m. 4.5 Impact of frequency snapshots Finally , the performance of IMUSIC algorithm for dierent numb er of frequency snapshots is investigated in Fig.9 for rst order Gauss- ian pulses with center frequency of 6 THz, pulse energy of 1 aJ, and distance of 1 m. It is obser ved from Fig.9 that RMSE decreases rapidly as the numb er of snapshots increase up to 50, after that the eect of increasing snapshots be comes less signicant. This result provides important guidelines for sele cting the numb er of snapshots for IMUSIC in NWSNs. 1 20 40 60 80 100 10 −3 10 −2 10 −1 Number of Snapshots RMSE [Degree] Figure 9: RMSE versus number of frequency snapshots. The energy of rst order Gaussian pulses with center frequency 6 THz is 1 aJ and distance is assumed as 1 m. 5 CONCLUSION Using wideband MUSIC algorithm, we have analyzed DOA estima- tion for terahertz N WSNs for higher order Gaussian pulses with varying center frequency , energy , transmission distance and fre- quency snapshot values. Our investigation shows that RMSE error can be reduce d by selecting lower order and higher frequency pulses for transmissions. For rst order Gaussian pulse emitting its peak energy at 6 THz, MUSIC can keep RMSE below 1 degree from a distance of 6 meter for pulse energy as little as 1 atto Joule with just a single snapshot. In future , DO A estimation performance can be investigated for multiple nanosensor devices using various other DO A estimation algorithm along with estimation of center frequency . REFERENCES [1] Y . L. Babikov , I. E. Gordon, and S. N. Mikhailenko. 2012. HI TRAN on the web, a new tool for HITRAN sp ectroscopic data manipulation. In In Proceedings of the ASA -HI TRAN Conference, Reims, FRANCE . [2] M. Changzheng and B. P. Ng. 2005. DOA estimation of ultra wide band impulse radio signal. In Proceedings. 2005 International Conference on Wireless Communi- cations, Networking and Mobile Computing, 2005. 332–335. [3] N. Hassan, C. T. Chou, and M. Hassan. 2017. Event and Node Identication from a Single-pulse Transmission in Self-powered Nanosensor Networks. In Proceedings of the 4th ACM International Conference on Nanoscale Computing and Communication (NanoCom ’17) . 2:1–2:6. [4] J. M. Jornet and I. F. Akyildiz. 2010. Electromagnetic wireless nanosensor net- works. Nano Communication Networks 1, 1 (2010), 3 – 19. [5] J. M. Jornet and I. F. Akyildiz. 2013. Graphene-based P lasmonic Nano- Antenna for T erahertz Band Communication in Nanonetworks. IEEE Journal on Selecte d A reas in Communications 31, 12 (De cember 2013), 685–694. [6] J. M. Jornet and I. F. Akyildiz. 2014. Femtosecond-Long Pulse-Based Modulation for T erahertz Band Communication in Nanonetworks. IEEE Transactions on Communications 62, 5 (May 2014), 1742–1754. [7] H. Keshavarz. 2005. W eighte d signal-subspace direction-nding of ultra- wideband sources. In WiMob’2005, IEEE International Conference on Wireless A nd Mobile Computing, Networking And Communications, 2005. 23–29. [8] Z. Sahinoglu, S. Gezici, and I. Gvenc. 2011. Ultra-wideband Positioning Systems: Theoretical Limits, Ranging Algorithms, and Protocols . Cambridge University Press, New Y ork, NY, USA. [9] H. Sheng, P. Orlik, A. M. Haimovich, L. J. Cimini, and J. Zhang. 2003. On the spectral and power requirements for ultra-wideband transmission. In Communi- cations, 2003. ICC ’03. IEEE International Conference on . 738–742. [10] H. L. V an Trees. 2002. Optimum A rray Processing Detection : Part IV , Dete ction, Estimation and Modulation Theor y . John Wiley and Sons, Inc. [11] X. W . Y ao and J. M. Jornet. 2016. T AB-MAC: Assisted beamforming MAC protocol for T erahertz communication networks. Nano Communication Networks 9 (2016), 36 – 42. [12] E. Zarepour , M. Hassan, C. T . Chou, and A. A. Adesina. 2017. SEMON: Sensorless Event Monitoring in Self-Powered Wireless Nanosensor Netw orks. ACM Trans. Sen. Netw . 13, 2 (May 2017), 1–28. [13] E. Zarepour , M. Hassan, C. T . Chou, and S. Bayat. 2015. Performance analysis of carrier-less modulation schemes for wireless nanosensor networks. In 2015 IEEE 15th International Conference on Nanotechnology (IEEE-NANO) . 45–50. Camera Ready V ersion
Original Paper
Loading high-quality paper...
Comments & Academic Discussion
Loading comments...
Leave a Comment