NIRS Based Bladder Volume Sensing for Patients Suffering with Neurogenic Bladder Dysfunction
Neurogenic Bladder Dysfunction has detrimental effects on day-to-day life of millions of people. Some of the most common symptoms faced by these patients include urinary incontinence, urgency and retention. Since elevated bladder pressure due to prol…
Authors: Prashant Gupta
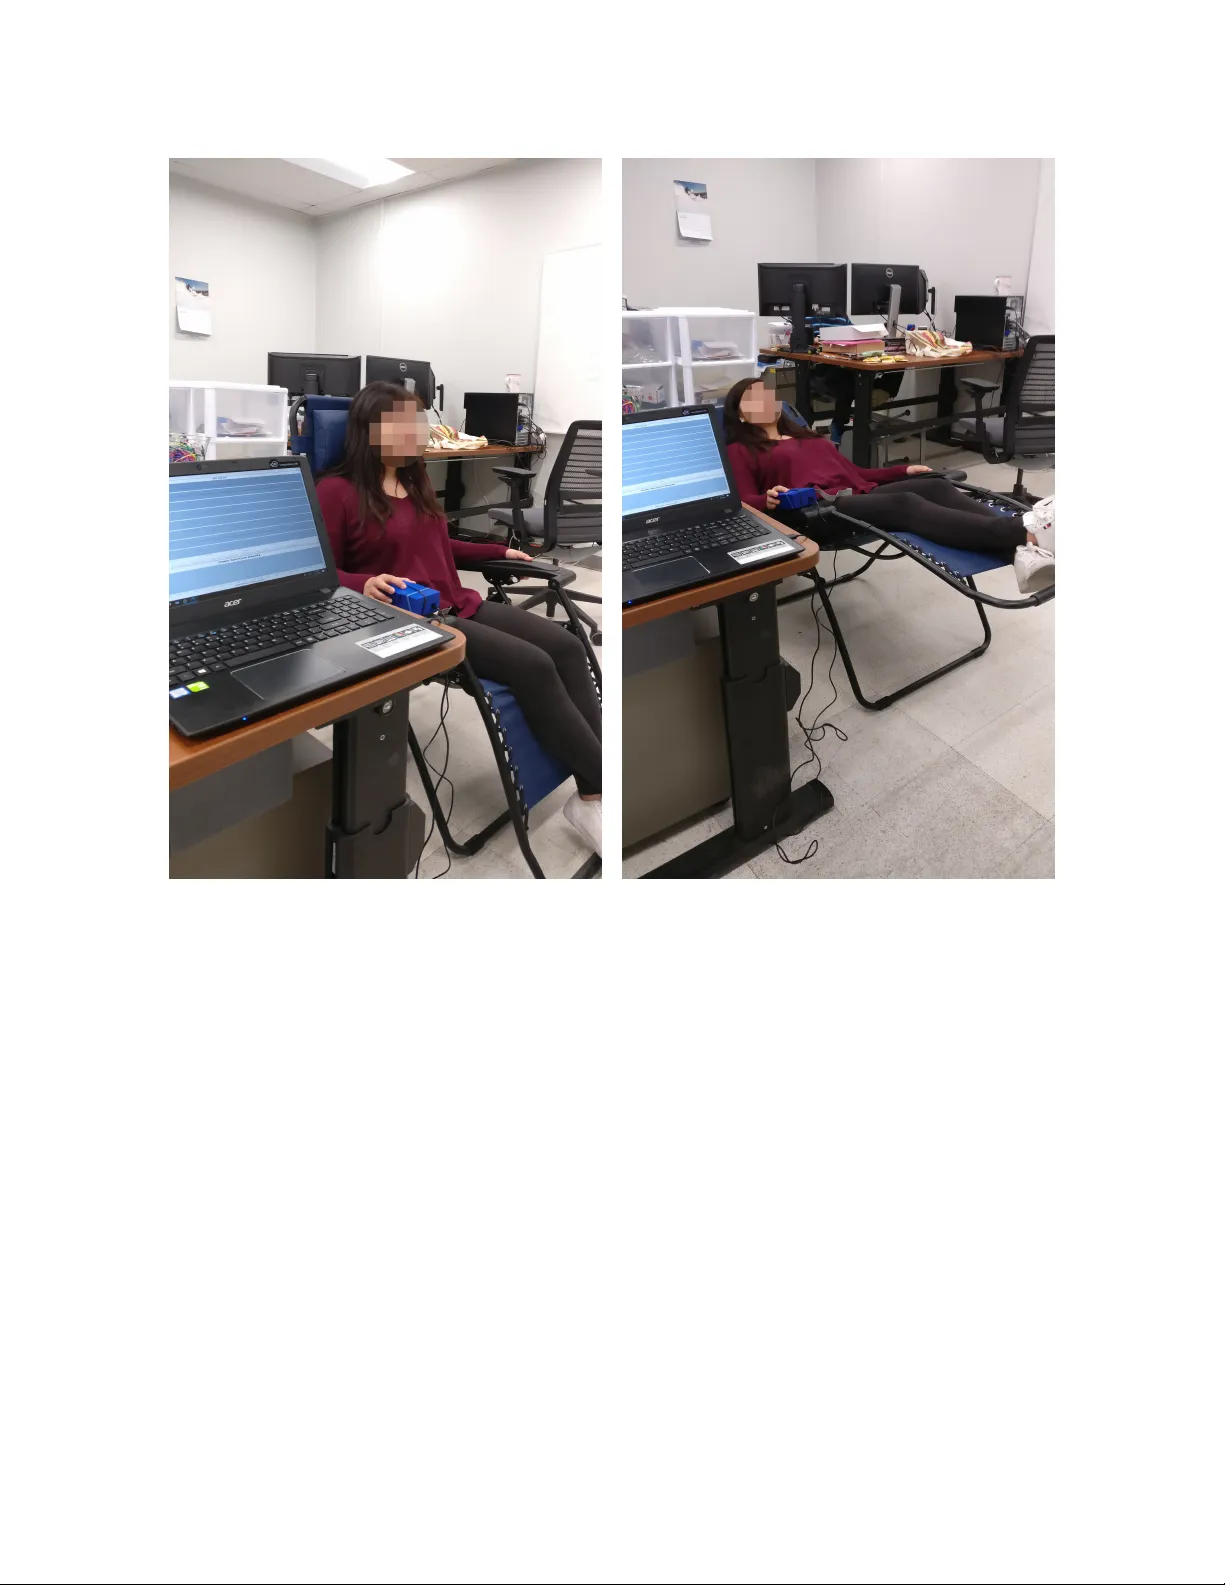
NIRS Based Bladder V olume Sensing for P atien ts Suffering with Neurogenic Bladder Dysfunction By Prashant Gupt a B.T ech. (Maharshi Da y anand Universit y , India) 2015 Thesis Submitted in partial satisfaction of the requiremen ts for the degree of Master of Science in Electrical and Computer Engineering in the Office of Gradua te Studies of the University of Calif ornia D a vis Appro v ed: Professor Soheil Ghiasi, Chair Professor Hussain Al-Asaad Professor V enk atesh Ak ella Committee in Charge 2018 -i- Dedicated to m y P aren ts, without whom this w ould ha v e b een still a dream ... -ii- Contents List of Figures . . . . . . . . . . . . . . . . . . . . . . . . . . . . . . . . . . . . v List of T ables . . . . . . . . . . . . . . . . . . . . . . . . . . . . . . . . . . . . vi Abstract . . . . . . . . . . . . . . . . . . . . . . . . . . . . . . . . . . . . . . . vii Ac kno wledgments . . . . . . . . . . . . . . . . . . . . . . . . . . . . . . . . . . viii 1 In tro duction 1 2 Bac kground 4 2.1 Near Infrared Sp ectroscop y (NIRS) . . . . . . . . . . . . . . . . . . . . . 4 2.1.1 Principle . . . . . . . . . . . . . . . . . . . . . . . . . . . . . . . . 5 2.1.2 Mo des of Operation . . . . . . . . . . . . . . . . . . . . . . . . . . 6 2.1.3 Measuremen t of Optical Signal . . . . . . . . . . . . . . . . . . . 7 2.1.4 Beer-Lam b ert La w(BLL) . . . . . . . . . . . . . . . . . . . . . . . 8 2.2 Human Bladder . . . . . . . . . . . . . . . . . . . . . . . . . . . . . . . . 10 2.2.1 Anatom y . . . . . . . . . . . . . . . . . . . . . . . . . . . . . . . . 10 2.2.2 Ph ysiology . . . . . . . . . . . . . . . . . . . . . . . . . . . . . . . 10 2.3 Related W ork . . . . . . . . . . . . . . . . . . . . . . . . . . . . . . . . . 11 3 Device Setup and Exp erimen tal Analysis on Phan toms 14 3.1 Device Setup . . . . . . . . . . . . . . . . . . . . . . . . . . . . . . . . . 14 3.1.1 Optical Prob e . . . . . . . . . . . . . . . . . . . . . . . . . . . . . 14 3.1.2 System Arc hitecture . . . . . . . . . . . . . . . . . . . . . . . . . 15 3.2 Exp erimen ts . . . . . . . . . . . . . . . . . . . . . . . . . . . . . . . . . . 17 3.2.1 Study using Optical Tissue Phan tom . . . . . . . . . . . . . . . . 17 3.2.2 W av elength Selection . . . . . . . . . . . . . . . . . . . . . . . . . 18 3.2.3 Ex vivo study using Porcine Bladder . . . . . . . . . . . . . . . . 20 4 Exp erimen tal Analysis on Human Sub jects 22 4.1 Up dated Probe Design . . . . . . . . . . . . . . . . . . . . . . . . . . . . 22 -iii- 4.1.1 Optical Prob e . . . . . . . . . . . . . . . . . . . . . . . . . . . . . 23 4.1.2 System Arc hitecture . . . . . . . . . . . . . . . . . . . . . . . . . 24 4.2 V olunteer Enrollmen t and Data Collection . . . . . . . . . . . . . . . . . 26 4.2.1 Prob e Placemen t . . . . . . . . . . . . . . . . . . . . . . . . . . . 28 4.3 Exp erimen ts . . . . . . . . . . . . . . . . . . . . . . . . . . . . . . . . . . 29 4.3.1 F ull and Empty bladder state comparison with m ultiple v olun teers 29 4.3.2 Lo w-frequency longitudinal study with single v olun teer . . . . . . 32 4.3.3 High-frequency longitudinal study with single v olun teer . . . . . . 36 4.3.4 Impact of v ariable SD distance . . . . . . . . . . . . . . . . . . . 38 4.3.5 Impact of lateral photon mo v emen t . . . . . . . . . . . . . . . . . 39 4.4 Mon te Carlo Sim ulation . . . . . . . . . . . . . . . . . . . . . . . . . . . 40 4.4.1 Results . . . . . . . . . . . . . . . . . . . . . . . . . . . . . . . . . 42 5 Conclusion and F uture W ork 43 5.1 F uture W ork . . . . . . . . . . . . . . . . . . . . . . . . . . . . . . . . . . 43 5.1.1 Mac hine Learning . . . . . . . . . . . . . . . . . . . . . . . . . . . 45 -iv- List of Figures 2.1 P oten tial photon paths . . . . . . . . . . . . . . . . . . . . . . . . . . . . 5 2.2 Reflection Mo de Op eration NIRS . . . . . . . . . . . . . . . . . . . . . . 7 2.3 Sc hematic diagram of Receiv er-F ront End for TI AFE4490 . . . . . . . . 8 2.4 Absorption Co efficient of main c hromophores in h uman tissue . . . . . . 9 2.5 F emale and Male Bladder . . . . . . . . . . . . . . . . . . . . . . . . . . 10 2.6 Bladder shap e change due to c hange in bladder v olume . . . . . . . . . . 11 3.1 High-lev el system arc hitecture . . . . . . . . . . . . . . . . . . . . . . . . 16 3.2 Exp erimen tal setup of Optical Tissue Phantom . . . . . . . . . . . . . . 17 3.3 Results of Optical Phantom . . . . . . . . . . . . . . . . . . . . . . . . . 18 3.4 Measuremen t for w av elength selection . . . . . . . . . . . . . . . . . . . . 19 3.5 Setup of ex vivo exp erimen ts using Porcine Bladder . . . . . . . . . . . . 20 3.6 Results of ex vivo exp erimen t using Porcine Bladder . . . . . . . . . . . . 21 4.1 Real life picture of the device . . . . . . . . . . . . . . . . . . . . . . . . 24 4.2 Up dated System Architecture . . . . . . . . . . . . . . . . . . . . . . . . 25 4.3 V olunteer undergoing bladder volume measuremen t study . . . . . . . . . 27 4.4 Prob e placement on the participan ts . . . . . . . . . . . . . . . . . . . . 28 4.5 F ull and Empty bladder state comparison for UCD103 . . . . . . . . . . 30 4.6 F ull and Empty bladder state comparison for UCD104 . . . . . . . . . . 31 4.7 Lo w-frequency longitudinal study with single v olun teer . . . . . . . . . . 33 4.8 Input-referred RMS noise current. . . . . . . . . . . . . . . . . . . . . . . 35 4.9 High-frequency longitudinal study with single volun teer . . . . . . . . . . 37 4.10 Changes in sensor v alue during volun teer voiding . . . . . . . . . . . . . 38 4.11 Setup for measuring impact of lateral photon mov emen t . . . . . . . . . . 40 4.12 F ront-view of the ab domen mo del used for Monte Carlo Sim ulations . . . 41 -v- List of T ables 4.1 Comparison of the developed system with that of Molavi et al. (2014) . 26 4.2 Tw o-tailed Student’s t-test on data collected from full and empty bladder state comparison study . . . . . . . . . . . . . . . . . . . . . . . . . . . . 32 4.3 Noise F ree Measuremen t for different opto de pair having fixed gain settings 35 4.4 Impact V ariable SD distance on the detected signal at PD . . . . . . . . 39 -vi- Abstra ct NIRS Based Bladder V olume Sensing for Patien ts Suffering with Neurogenic Bladder Dysfunction Neurogenic Bladder Dysfunction has detrimen tal effects on day-to-da y life of millions of p eople. Some of the most common symptoms faced b y these patients include urinary incon tinence, urgency and retention. Since elev ated bladder pressure due to prolonged urine storage inside bladder may ha v e adverse impacts on patient’s renal health, urolo- gists recommend clean-intermitten t catheterization (CIC) ev ery 2 to 4 hours throughout the da y to reliev e bladder pressure. Ho w ev er, since urine pro duction by kidneys is an in termitten t pro cess and most of these patien ts ha v e limited mobilit y , such frequen t trips to w ashro om can prov e to b e c hallenging. Sometimes, bladder fills to capacity before the recommended CIC time is reac hed causing embarrassing situation due to leak age. Hence, time-based CIC strategy is difficult to implement and has high c hances of failure. As suc h, continence is the primary concern for most of these patients but sadly there are no practical solutions av ailable in the mark et that address this concern. A real-time notification system that could give feedbac k to patients on when “bladder is almost-full” could help these patien ts to better plan their bathro om trips. This work explores the feasibility of using a near infrared-light based wearable, non-inv asiv e sp ec- troscop y technique that can sense amount of urine present inside the bladder and give details on developing a bladder state estimation device. W e present preliminary results by testing our device on optical phan toms and per- forming ex vivo measuremen ts on p orcine bladder and intestines. W e later explored the p ossibilit y of using the device on human sub jects, after study w as approv ed by the UC Da vis Institution Review Board (IRB). -vii- A ckno wledgments First and foremost I w ould like to express my s incere gratitude to my advisor Professor Soheil Ghiasi, for men toring me through these t w o w onderful y ears and alw a ys steering me in the righ t direction. This thesis w ouldn’t ha v e b een p ossible without his constant and able guidance. I consider m yself privileged to w ork with him and thank him for the time he has inv ested in me. I would also like to take this opp ortunit y to thank my committee mem b ers Professor Hussain Al-Asaad and Professor V enk atesh Akella for taking the time to review my work and giving insigh tful commen ts. Their feedback help ed me tow ards impro ving this thesis. Second, I w ould lik e to thank m y fellow graduate students Daniel F ong, Alejandro V elazquez, Mah y a Saffarp our, Rami Abueshsheikh at UC Davis who pla y ed a crucial part in this study . P arts of this thesis are based up on collab orativ e work done with them and I consider myself lucky to b e working in conjunction with such great minds. Discussions I had with Mohammad Motamedi and T erry O’Neil, t w o h um ble and truly bright PhD studen ts, help ed me enric h my kno wledge on a v ariety of technical domains apart from m y research. I am grateful to Ms. Seema Bansal for pro of reading my draft, helping me with some of the figures included in this thesis and most of all b elieving in me. Third, I w ould like to thank m y friends at UC Da vis Prav een, Ismail, Ajinky a, Saheel, Sac hin, Sandeep, Sat y abrata, Jennifer, Sh weta and Deepik a who supp orted me during m y studies and whose fair share of h umour alwa ys k ept me going through stressful times. I lo ok forward to our con tinued friendship and wish them well for their endeav ours. Finally , I would lik e to express my eternal debt to m y paren ts and elder sister Neha, who alw a ys inspire me to pursue m y dreams and w ork hard tow ards achieving them. A lot of this work is based on constant trial and error and its their con tinuous lov e, supp ort and b elief in me that kept me motiv ated through my ups and do wn. A big thank y ou is ow ed to the v olun teers who participated in this study; without their enth usiastic supp ort, this researc h pro ject would not hav e b een p ossible. Y ou are the true champions of science. -viii- Chapter 1 In tro duction Human bladder is a hollow ballo on shap ed m uscular organ whic h is a critical part of the urinary trac k system and stores urine un til the p erson finds an appropriate time and place to urinate. According to Urology Care F oundation, more than 33 million p eople suffer from neurogenic bladder dysfunction (in US alone). This is a w ell-do cumen ted problem in whic h nerv es carrying the messages b et w een bladder, spinal cord and brain don’t work congruously and patien ts lac k sensation and con trol of their bladder. P eople affected from Spinal Cord Injuries (SCI), congenital spinal anomalies like spina bifida, injuries lik e herniated discs, men post prostate cancer remo v al, women p ost childbirth or menopause commonly suffer from this problem (White and Black, 2016; Bro ome, 2003). Some of the most common symptoms faced b y these patien ts include urinary incon tinence, urgency and reten tion. Recen tly , several studies ha ve also shown prev alence of stress related incon tinence in adolescen ts or y oung adults (Robinson and Cardozo, 2014). Una w areness of bladder filling may lead to dev elopmen t of high pressure within the urinary tract and can severely damage kidneys. While preven tion of renal failure is of paramoun t imp ortance, primary da y-to-da y concern of most patien ts is incontinence. The commonly used solution in suc h cases is Clean In termittent Catheterization (CIC) whic h is recommended every 2 to 4 hours to prev en t an y leak age and does not in v olv e an y surgery or p ermanen t appliance attac hmen t. The pro cedure enables drainage of urine b y inserting a catheter, a thin hollow tub e, into bladder to help relieve bladder pressure. If not done carefully , it can often lead to infection, 1 urethral erosion and other complications (Gray et al., 1995). As urine production by kidneys is not a constant pro cess, it b ecomes difficult to predict bladder filling using time-based techniques. With limited mobilit y in most cases, one common problem rep orted b y these patien ts is, making a difficult trip to bathro om only to find limited amoun t of urine in the bladder. This leads to unnecessary catheterization whic h can further damage the bladder. Or w orse, not making it to the bathro om in time and leak age of urine b ecause of full bladder. T o prev en t such accidents, particularly in public, these patien ts ha v e to carry absorb en t pro ducts, spare clothing and organize fluid in tak e. Some patien ts go so far as to c ho ose a p ermanen t indw elling catheter which ma y lead to higher chances of c hronic infection and bladder cancer (Nahm et al., 2015). Such situations can sev erely impact the self- efficacy of these patients causing barriers to so cial, recreational activities and in some cases may ev en lead to depression (Bro ome, 2003). Quality of life of these patients could dramatically improv e if they hav e kno wledge of the righ t time to v oid. That wa y these patien ts could plan their trips to washroom in adv ance, a v oid incon tinence, leaking and in-turn hav e a b etter quality of life. Although a v ariety of to ols hav e b een developed to measure amount of urine inside the bladder, nearly all these devices are costly , big in size and are made with fo cus on clinicians/caregiv ers rather than patients. Usually a sp ecially trained p erson is required to interpret these results and communicate them to patien t. This thesis talks ab out steps tow ards dev elopmen t of a w earable non-in v asive de- vice for monitoring c hanges in bladder v olume by optical monitoring using Near-Infrared Sp ectroscop y (NIRS). Goal of this researc h is to dev elop a device that can communicate directly with patien ts to give them real-time feedbac k on the righ t time to v oid and at the same time cause minimum in terference in their day-to-da y activities. Such a device can th us enable these patien ts to empt y their bladder when they actually ha v e to and th us, bring back some normalcy to their lives. W ork done in this study is supp orted by CITRIS and the Banatao Institute at the Univ ersit y of California. Parts of this thesis are based on tw o previous publications with 2 other authors: • Non-In v asiv e Bladder V olume Sensing for Neurogenic Bladder Dysfunc- tion Managemen t . Daniel F ong, Alejandro V elazquez Alcantar, Pr ashant Gupta , Eric Kurzro ck, and Soheil Ghiasi presented at 15 th IEEE International Conference on W earable and Implantable Bo dy Sensor Netw orks (BSN), Marc h 2018, Las V egas, USA (F ong et al., 2018a). • Restoring the Sense of Bladder F ullness for Spinal Cord Injury P atien ts . Daniel F ong, Xiaofan Y u, Jiageng Mao, Mahy a Saffarpour, Pr ashant Gupta , Rami Abueshsheikh, Alejandro V elazquez Alcantar, Eric Kurzro c k and Soheil Ghiasi accepted in IEEE/ACM 3 rd Conference on Connected Health: Applications, Systems and Engineering T echnologies, Septem b er 2018, W ashington, D.C. (F ong et al., 2018b). 3 Chapter 2 Bac kground This c hapter co v ers relev ant bac kground theory and provides an o v erview to the researc h that has previously b een conducted in the field of bladder volume measurement. As this study is an in tersection of v arious domains, the idea b ehind this section is to giv e a high- lev el ov erview of the optical and biological parts inv olv ed in this research. Details on em b edded systems and phantom trials are cov ered in Chapter 3, while results on human trials are cov ered later under Chapter 4. 2.1 Near Infrared Sp ectroscop y (NIRS) NIRS is an optical measurement tec hnique that uses near-infrared region (700nm to 2000nm) of electromagnetic sp ectrum to inv estigate tissue comp osition. J¨ obsis in 1977 first demonstrated its use by measuring change in concen tration of o xy- and deo xy- hemoglobin for brain and m uscle tissues (Jobsis, 1977). This technique b ecame widely p opular b ecause of its c haracteristics like non-inv asiv eness, affordabilit y and ease-of-use. Some of its curren t applications include astronom y , agriculture, remote monitoring, ma- terial science and a large n um b er of medical applications lik e pulse o ximetry (Sc heeren et al., 2012; F ong et al., 2017), brain computer in terface, rehabilitation etc. Recently some researc hers ha v e sho wn p oten tial of using NIRS for urology applications lik e measuring c hanges in bladder conten t (Molavi et al., 2014), bladder contractions, tissue resp onse to ph ysiological ev ents etc. 4 2.1.1 Principle Opto de for NIRS consists of t w o ma jor comp onen ts - emitter and detector. While emitter could b e an y light source from halogen ligh t bulbs to LEDs, the main criterion of detector selection is that it should be sensitiv e to the w a velength of photons as emitted b y the emitter opto de. Another trade-off worth noting is that, as the size of detectors increases, the probabilit y of detecting photons also increase, at the same time it b ecomes more sus- ceptible to bac kground noise. On the other hand as detector size decreases probability of detecting photons also decreases and at the same time it is less susceptible to background noise. NIRS is usually p erformed by emitting ligh t to w ards the tissue surface and measuring diffused-reflected ligh t that escap es from the surface after it has trav elled some distance from the emitter. While the visible ligh t only p enetrates h uman tissue for short distances since it is mark edly attenuated b y several tissue comp onen ts, the near infrared (NIR) sp ectrum photons are capable for deep er p enetration (upto several cen timeters or more). In contin uous NIRS trend monitoring, a constan t opto de - skin contact is v ery imp ortant, as minor changes in contact induces ma jor c hanges in the signal v alue. Figure 2.1: Photon path 1, 2 and 3 depict p oten tial paths that a giv en photon can tra v el. After multiple reflections through the biological tissue; photon 3 is successfully detected at detector, photon 2 ends up getting absorb ed by tissue, while photon 1 escap es the tissue structure and is neither absorb ed by tissue nor detected by detector. Propagation of light through the biological tissue is gov erned by three ma jor phe- 5 nomenon namely reflection, absorption and scattering. Angle with whic h ligh t enters the tissue (with resp ect to tissue surface) determines ligh t reflection and in-turn decides the path through whic h photons tra vels within the medium. Photons en tering the b o dy through emitter go es through multiple reflections and can p otentially hav e three possible outcomes as describ ed in Figure 2.1. Photon 1 after multiple reflections escap es b ody without b eing detected, Photon 2 after multiple reflections gets absorb ed by tissue while Photon 3 ends up successfully getting detected b y detector. Out of the total near-infrared ligh t en tering the system, appro ximately 80% of the atten uation is as a result of scattering while the remaining 20% is lost due to absorption. Hence, one of the biggest hurdle while attempting to do quantitativ e measurements with NIRS is loss due to scattering. 2.1.2 Mo des of Op eration NIRS has tw o main modes of op eration, namely- T r ansmission Mo de and R efle ction Mo de . In transmission mo de, emitter is placed on one side of the biological tissue while detector is placed on the other end. Photons in this mo de tra v el through the entire tissue structure and therefore, can get global information of the tissue medium. T ransmission mo de is usually suitable when thic kness of the medium is less than 8 cm (P ellicer and del Carmen Bra v o, 2011). F or example, it is p opularly used in infants to get information ab out their brain’s oxygenation. In reflection mo de, both emitter and detector are placed on same side of the biological tissue and therefore, can only extract regional information as photons only trav el though a shallo w depth. Light in such a case can b e approximated to follo w a curv ed tra jectory as depicted in Figure 2.2 and the maxim um depth of that tra jectory is appro ximately half of the source-detector (SD) distance. As distance betw een detector and emitter increases, p enetration depth of photon en tering the bo dy also increases; at the same time, n um b er of photons reaching detector decreases b ecause of increased path-length resulting in higher atten uation due to increased probabilit y of tissue absorption. In this study , the dev elop ed device is operated in reflection mode so that the photons can successfully reac h the h uman bladder (2-5cm deep from the skin surface) after passing though m ultiple la yers of tissue i.e. muscle, fat etc. 6 Figure 2.2: Opto de pairs w orking in reflection mo de are placed on the same side of op- tical tissue. Photon path in this case can b e approximated to follo w a curved tra jectory ha ving a p enetration depth of “D/2” where, “D” is the emitter (source) - detector dis- tance. As detector mov es farther from emitter, in tensit y of detected light decreases, while p enetration depth of photon increases. 2.1.3 Measuremen t of Optical Signal Detection of optical signal coming out from the tissue structure p ost diffused-reflectance requires 3 ma jor components- Optical detector (e.g. Photo dio de), Optode actuation sub- system, Data handling and control subsystem. Optical detector measures optical signal and con v erts it in to electrical curren t using photo electric effect. F or detectors to measure optical signal as a result of emitter opto de, emitter-detector opto de pairs ha v e to actuate in sync hronization. Also, since the detected optical signal is prone to noise as a result of v ariable ambien t ligh t, an ambien t ligh t measuremen t is also tak en at detector while emitter is turned off. This am bien t light signal can later be subtracted from the detected signal (while emitter is turned-on) to remo v e the impact of noise due to am bient ligh t. Man y electrical measurement components use voltage signals rather than current sig- nals to buffer, conv ey and manipulate information b ecause of low transmission loss, low p o w er consumption, design flexibilit y etc. Hence, the curren t signal measured from the optical detector is th us conv erted in to v oltage signal using a transimp edence amplifier (TIA). Figure 2.3 shows the receiver-fron t of TI AFE4490 that has b een used for opto de actuation and data handling in this thesis. Gain of TIA can b e con trolled b y changing the resistance ( R F ) across op erational amplifier (op-amp) as seen b y the I-V Amplifier stage of the AFE. AFE4490 also pro vides a user-controlled ambien t light cancellation 7 system how ev er, the ambien t cancellation can also b e achiev ed in p ost-pro cessing stages. Lastly , the voltage signal present in analog domain is con v erted to digital domain using sample-and-hold circuitry presen t in the analog-to-digital con verter (ADC). Con v ersion of analog signal into digital domain comes with v arious adv an tages like less exp ensiv e signal pro cessing, less susceptible to noise etc. The digital signal obtained out of ADC can th us b e used to inv estigate the optical prop erties of tissue structure. Figure 2.3: Sc hematic diagram of Receiv er-F ron t End for TI AFE4490 (T ex, 2017). 2.1.4 Beer-Lam b ert La w(BLL) BLL giv es out a relationship b et w een ligh t atten uation and properties of the medium it is tra v elling through. The law is commonly applied to c hemical analysis measurements lik e analysis of a mixture by sp ectrophotometry and do es not require an y extensive sam- ple pre-pro cessing. In v estigating tissue comp osition from NIRS-based measuremen ts is accomplished through a mo dified version of the Beer-Lam bart La w (MBLL): A ( λ ) = l og ( I O /I ) = X i c i D L + G Namely , the MBLL sa ys that absorption of light in tissue A ( λ ), is log of the ratio of inciden t ligh t in tensit y I o , to transmitted ligh t in tensit y I . More usefully , it says that 8 absorption of light is a function of the concen tration of chromophores in tissue c i , their molar extinction co efficien ts i , source-detector distance L , differen tial path-length factor D and a term that accounts for the static atten uation due to ligh t scattering G . The molar extinction co efficien t (units: cm − 1 /(moles p er liter)) represents level of light absorption exp erienced and is sometimes represen ted as absorption co efficient µ a (units: cm − 1 ). Both co efficien ts represen t a chromophore’s level of absorption p er concentration and p er unit length, and differ only by a scaling factor. Similarly , the scattering co efficien t µ s (units: cm − 1 ) represents exp ected num ber of scattering ev en ts p er unit length and is inherently a part of b oth D and G . In h uman tissue, some of the main c hromophores include oxy- and deoxy- hemoglobin ( H bO 2 and H b ), lipids (fat), melanin (skin pigment), and w ater. Their normalized absorption co efficien ts, which is related to molar extinction co efficients, can b e seen in Figure 2.4. Figure 2.4: Normalized absorption coefficient spectra for the main c hromophores in tissue, namely water (Kou et al., 1993), o xy- and deo xy- hemoglobin (Prahl, 1999), and lipids (v an V een et al., 2004), (Wilson et al., 2015). Image source- (F ong et al., 2018a). 9 2.2 Human Bladder In NIRS, path of ligh t and medium through which ligh t propagates has a significan t impact on results and hence it b ecomes critical to study basic anatom y and physiology of h uman bladder. Figure 2.5 shows a dra wing depicting female and male bladder. Figure 2.5: Dra wing of a)F emale Bladder b) Male Bladder (College, 2013) 2.2.1 Anatom y Bladder is a m uscular sac, lo cated in lo w er ab domen of human b ody just ab o v e and b ehind the pubic bone, which collects urine pro duced by kidneys b efore b eing v oided. While different scientists ha ve differen t theories ab out human bladder capacit y and ho w m uc h urine it can hold, general consensus b eing a normal functioning capacit y in adults ranges from 400 to 600ml. F or a non-inv asiv e application of NIRS photons would ha ve to trav el through multiple lay ers of tissue before reac hing bladder (ha ving a thickness of ab out 2-5cm). Differen t lay ers of tissues that come b efore bladder wall are namely- Outer Skin, Sub cutaneous tissue, Adip ose tissue, F ascia, Muscle and Retropubic space. 2.2.2 Ph ysiology Kidneys filter bloo d flo wing through the b o dy and remo v e un w an ted c hemicals with excess w ater (91-96% of urine (Rose et al., 2015)) whic h all com bine to form urine. After urine is pro duced b y kidneys, it go es though ureters to reac h bladder. As volume of urine inside bladder increases, muscles of bladder accommo date urine b y passive relaxation con trolled b y the autonomic nervous system. Bladder starts to stretch lik e a ballo on and starts 10 Figure 2.6: Illustration depicting change in bladder shape as the v olume of urine inside bladder changes. getting more circular in shap e (Kristiansen et al., 2004a) to accommodate the urine b eing created. A t the same time, thickness of bladder wall also decreases to less than 3mm (3-5mm when bladder is empt y). Figure 2.6, sho ws c hange in shape of bladder as it starts to fill up. While bladder is filling up, first sensation happ ens at a v olume of ab out 150ml, and first desire to void happ ens at volume > 350ml. As it approac hes a v olume of > 450ml desire to v oid keeps getting stronger (Patel and Ric k ards, 2010). A healthy h uman b o dy is usually able to accommo date upto 500ml of liquid with comfort without an y abnormal detrusor pressure. While micturating, p ontine p ortion of the brain (cerebrum) sends a signal to the spinal cord that initiates a cascade of nervous signals and reflexes that allow v olitional v oiding. Bladder con tracts and almost simultaneously bladder nec k and urethral sphincter op en. This gives humans the ability to micturate infrequently and v oluntarily . 2.3 Related W ork A n umber of inv estigators in recen t times hav e tried to explore p ossibilities of estimating the volume of bladder for p eople suffering with neurogenic bladder. Dreher et al. (1972) 11 and W ang et al. (2009) used an implan table magnet to in teract with an external elec- tronics switch to sense c hanges in bladder shap e and in turn predict its volume. Suc h an approac h is prone to errors due to in terference from earth’s and other peripheral mag- netic fields. In addition to that, the magnetic strength degrades o v er time and can further hamp er patien t’s ability to hav e an MRI (Magnetic Resonance Imaging) scan p ost im- plan tation. Co osemans and Puers (2005) and Ma jerus et al. (2016) attempted to develop an implantable pressure sensor to measure bladder pressure. The inheren t elasticity of bladder allo ws it to fill close to its functional capacit y without significant c hange in pres- sure. Ev en as bladder pressure increases, it’s often v ery close to the leaking point whic h do es not give enough time to patients suffering from SCI to find a w ashro om and perform CIC. F urthermore, urinary reten tion beyond this p oin t ma y ha v e negativ e side effects, particularly in SCI patien ts, suc h as renal damage caused b y back pressure in the urinary tract. Another approach includes use of MEMs enabled implantable strain gauge sensors whic h detect c hange in bladder size to predict bladder volume (Chen et al., 2015a). This comes with issues of p o w er, bio-compatibility , telemetry etc. Bladder tissue attac hed to the prob e is lik ely to dev elop fibrosis after sometime which will alter the ph ysical prop- erties of tissue lik e reduce its ability to stretch, making the tec hnique ineffective for long term use. Sc hlebusc h et al. (2014) prop osed idea of using electrical-imp edance tomogra- ph y to sense conductance distribution of pelvic region using a b elt with m ultiple electrical con tacts. The approac h has not b een very successful in practice due to unreliabilit y of electrical contacts with skin and highly v ariable tissue comp osition causing v ariation in imp edance. A group of researchers used 950nm NIRS device to measure changes in o xy- and deoxy- hemoglobin of bladder wall, in which most notable changes o ccur during v oid- ing (Macnab et al., 2005). This tec hnique w as thus used to determine full v ersus empty states of bladder b y measuring atten uation in ligh t due to w ater (Molavi et al., 2014). Ho w ever, SCI patients show ed inconsisten t trends in tissue o xygen saturation, lik ely due to neurogenic bladder. F urthermore, chromophore c hanges that o ccur during voiding are not helpful in warning patient when bladder v olume increases. Curren tly in clinics, Doppler Ultrasound T omography is used to measure bladder di- 12 mensions and using that information volume of bladder is th us predicted assuming it ha ving an elliptical shap e (Kiely et al., 1987). This device is bulky , exp ensiv e and has high error rate of upto 25% (Dicuio et al., 2005). Recently , p ortable and wearable ultra- sonic devices for bladder monitoring ha v e b een dev eloped but they are either inaccurate or to o computationally in tensiv e to house the computational unit within the w earable part of the sensor (Kristiansen et al., 2004b). In addition to that, it requires a trained exp ert to op erate and in terpret its results making it imp ossible for patients to directly use the device. 13 Chapter 3 Device Setup and Exp erimen tal Analysis on Phan toms This c hapter 1 go es through the process of dev eloping a NIRS based optical sensor and co v- ers initial exp erimen ts done using a simple optical tissue phantom to v alidate the device. F urther this chapter entails the pro cess of selecting 970nm as the preferred w a v elength for the optical probe used in this study and cov ers details on ex vivo exp erimen ts using p orcine bladder to test the device with a more realistic bladder en vironment. 3.1 Device Setup The developed device comprises of tw o parts- embedded hardware and an optical probe. Prob e is placed o ver the outer skin in NIRS reflection mo de (section 2.1.2) to get infor- mation ab out the tissue structure b eneath it. On the other hand, embedded hardware is used to con trol prob e’s opto de system like driving the ligh t emitting dio de (LED) and recording the light after diffused reflectance as measured by detector photo diode (PD). 3.1.1 Optical Prob e As human tissue is a highly scattering medium (high signal attenuation), getting reason- able information from the deep er tissue suc h as lo cation of bladder or amount of urine presen t inside the bladder is highly dependent on the selected light source. In this prob e, a high-p ow er ligh t emitting dio de (LED) with a p eak wa v elength of 970nm and a viewing 1 W ork included in this c hapter was done join tly in collab oration with Alejandro V elazquez Alcantar. 14 angle of ± 10 ◦ is used. The exp erimental study leading to c hoice of 970nm as the preferred w a velength is cov ered later under section 3.2.2. Narrow viewing angle helps to reduce the impact of photons residing in sup erficial la y ers of tissue structure. The prob e is also co v ered with blac k tap e to help reduce the n um b er of escaped photons getting reflected bac k in to the tissue structure and hence, further reducing the n um b er of detected photons coming from sup erficial tissue lay ers. As mentioned earlier, measuring a ligh t signal that contains information about deep er tissues can b e accomplished b y observing the diffuse reflectance at a far distance from the originating light source. How ev er, as source-to-detector (SD) distance increases, the amoun t of light seen at photo dio de (PD) deca ys dramatically . Therefore, using photo- detectors with large activ e-areas help to capture as man y photons as p ossible at these large SD separations. As the size of detector increases, its cost also increases. In this setup, to balance b oth cost and functionalit y a PD with an active area of 6.25mm 2 , sensitive to 970nm w a v elength and ha ving a viewing angle of ± 60 ◦ w as used. Con trary to emitters, detectors with large viewing angle is preferred so as to capture as man y photons escaping the tissue as p ossible. As tissue lay er betw een bladder mimic and opto de in exp erimen ts cov ered under sec- tion 3.2 is roughly 2cm, therefore, SD distance for this prob e was pick ed to b e 4cm fol- lo wing the principle - depth of photon p enetration is approximately half the SD distance (V an der Zee et al., 1992; Zonios and Dimou, 2006). 3.1.2 System Arc hitecture The em bedded device consists of T exas Instrumen ts (TI) CC3200 micro con troller which is connected to a TI analog fron t-end c hip called AFE4490. The micro con troller in teracts with the optical prob e via AFE c hip. Figure 3.1 giv es high-level o v erview of system arc hitecture. AFE is capable of con trolling upto tw o LEDs indep enden tly with a programmable LED ON-time which giv es the flexibilit y of op erating LEDs in differen t mo des like alw ays-on, pulsating etc. Input curren t to LED is also programmable and has an 8-bit resolution for a fine con trol. In this setup, AFE is used to control only a single 970nm LED op erated 15 in pulsating mode. The pulsating mode is used to alternate b et w een measuring ambien t ligh t present in the system and measuring ligh t at detector PD when the emitter LED is turned on. Figure 3.1: High-lev el system arc hitecture Photo diode (PD) translates the detected photons exiting tissue into the electric cur- ren t using photoelectric effect. Many electrical measurement comp onen ts use v oltage sig- nals rather than current signals, to buffer, conv ey and manipulate information. T o tak e adv antage of this, current generated by photo dio de is passed through a transimp edance amplifier (with programmable gain settings) to con v ert it in to a voltage signal. T o accoun t for a v ariet y of en vironmen tal settings, this signal then go es through a user-set am bien t ligh t cancellation system. As mentioned earlier, this setting can b e estimated as taking measuremen t at detector when LED is turned off, and then fed bac k in to the system to accoun t for the lev el of ambien t ligh t seen. Output of this section is then buffered and fed into a 22-bit analog-to-digital conv erter (ADC) using a sample-and-hold circuit. Multiple ADC recordings are recorded and a veraged o v er time to impro v e system accuracy . These measuremen ts from ADC are carefully synchronized to the command and data handling subsystems to provide context to readings. 16 3.2 Exp erimen ts 3.2.1 Study using Optical Tissue Phan tom T o test v alidit y of abov e describ ed system, a simple optical phan tom w as dev eloped. Since 91-96% of urine is comp osed of w ater (Rose et al., 2015), goal of this study was to detect the diffuse-reflected light coming from 970nm LED source (driv en at 200mA) after it go es through the medium. Another imp ortan t goal of the study w as to test signal strength under v arious v olumes of w ater. Change in signal strength with differen t v olumes of w ater at PD would mean that the system is successfully able to distinguish b etw een c hanges in w ater v olume. 3.2.1.1 Setup The optical phantom was developed to mimic the gross anatomy , physiology and optical prop erties of h uman bladder along with its surrounding tissue as sho wn in figure 3.2. Bladder is represented with an 8*8cm container filled with w ater whereas length of en tire phan tom is 22cm. A 2cm thic k lay er of tissue consisting of b ovine muscle and fat was presen t b et w een the optical prob e and bladder mimic. After filling the container with w ater, surrounding area to the bladder mimic was also cov ered with the same tissue. (a) (b) Figure 3.2: (a) A picture sho wing con tainer of w ater represen ting the bladder before b eing co v ered with fo o d grade b o vine m uscle and fat represen ting the surrounding tissue (F ong et al., 2018a). (b) Phan tom mov es across opto de pair taking readings ev ery cm across the length of phantom (F ong et al., 2018a). Phan tom w as mov ed across the stationary opto de pair taking reading ev ery centimeter. Since the normal capacit y of human bladder is b etw een 400-500ml, measurements w ere 17 tak en at w ater v olumes- 100ml, 300ml and 500ml. 3.2.1.2 Results Figure 3.3: Measuremen ts performed on the optical phan tom o v er three v olumes of liquid (100ml, 300ml, 500ml) using a 970nm LED. As exp ected, as amoun t of water in the bladder increases, light intensit y drops (F ong et al., 2018a). Figure 3.3 shows results from the exp erimen t describ ed in section 3.2.1.1 for three lev els of w ater volume. It was observ ed that as amount of water inside the bladder-mimic increases, there is a noticeable decrease in in tensity of ligh t at the detector PD. Intensit y of ligh t is represen ted in term of v oltage [V] (describ ed in section 3.1.2) on y-axis while x-axis sho ws lo cation of probe as phan tom mov es across it. As total length of phan tom is 22cm, readings shown in figure 3.3 at 0cm and 23cm depict the case when phan tom is not cov ering opto des or in other w ords when medium for photons is air. 3.2.2 W av elength Selection As mentioned earlier, selecting the right w a v elength is critical for NIRS applications to attain a reasonable optical signal and get appropriate lev el of sensitivity . T o test this, three LEDs having peak w a v elengths at 890nm, 970nm and 1450nm resp ectiv ely were 18 tested, each of which has a peak for water absorption. These w av elengths were c hosen to in v estigate the effect that differen t absorption co efficien ts hav e on the o ve rall ligh t in tensit y measured, in addition to the co efficien t’s stabilit y o v er small v ariations in w a ve- length. Inv estigating these v ariations in w a v elength helps to reduce errors caused b y sligh t shifts in the p eak w a vele ngth of the LED. Absorption co efficien t for w ater at 890nm is 0.058cm − 1 , 970nm is 0.481cm − 1 , and 1450nm is 32.778cm − 1 (Kou et al., 1993). Eac h exp erimen t conducted with differen t w a velength of LED used the same setup as described in section 3.2.1.1 with only difference b eing the amount of w ater inside the con tainer b eing fixed at 300ml. 3.2.2.1 Results Figure 3.4: Measuremen ts p erformed on optical phantom o v er three wa v elengths (890nm, 970nm, 1450nm). As exp ected, the depth of the ligh t intensit y signal (in V olts) follo ws the absorption co efficient for w ater at these w av elengths (F ong et al., 2018a). Figure 3.4 shows ligh t in tensit y (in volts) detected at PD for v arious wa v elengths. It was observ ed that 1450nm wa v elength is too sensitiv e to w ater degrading its ability to reac h deep er tissue levels and hence, unable to predict the exact location of water in 19 phan tom. 970nm has optimal sensitivit y for this setup giving a maximum resolution of 0.6V. 3.2.3 Ex vivo study using P orcine Bladder Findings from initial Optical Tissue Phantom exp erimen t v alidates the idea, ho wev er in order to inv estigate the results in a more realistic bladder en vironment, ex vivo exp eri- men ts w ere done using p orcine bladder. Choice of p orcine bladder was made b ecause of its anatomical and physiological simi- larities with the h uman bladder. In addition to that, it has a capacit y of approximately 500-550ml whic h is comparable to human bladder. F or these reasons, it is a popular exper- imen tal mo del for conducting an y urology related research (Chen et al., 2015a). Porcine bladder and intestines used in this study were obtained from the UC Da vis Meat Lab. 3.2.3.1 Setup (a) (b) Figure 3.5: a) A picture of ex vivo setup sho wing the use of porcine bladder, large in testines to create a more realistic tissue mo del (F ong et al., 2018a). b) Phan tom mo ves across opto de pair taking readings ev ery cm across the length of phantom similar to the Optical Tissue Phantom (F ong et al., 2018a). The ex vivo exp erimen t w as aimed to realistically mimic anatomy , ph ysiology and optical prop erties of h uman bladder. P orcine bladder w as placed in the cen tre of phantom. A 2cm la yer of b ovine m uscle and fat w as present at bottom of phan tom b et ween bladder and opto de. Porcine bladder was surrounded b y in testines in order to create a more anatomically accurate depiction of bladder en vironmen t. Bladder w as filled with 200ml 20 of water using a system of syringes, tub es, and clamps. A 970nm LED driven at 670mA w as used to perform the measurements. Figure 3.5 sho ws a detailed visual presentation of the setup. Similar to section 3.2.1.1, phan tom w as mo v ed across the stationary optode pair taking reading every centimeter. 3.2.3.2 Results Figure 3.6 sho ws a noticeable drop in ligh t in tensity at the location where p orcine bladder is presen t inside the phan tom. In testines con tain partially digested fo o d, pancreatic juices, fecal matter etc. and despite that, NIRS based metho dology using IR LED at 970nm w a velength is successfully able to detect w ater inside bladder trav elling through a 2cm thic k la yer of human tissue. Figure 3.6: Measurements p erformed on p orcine bladder (filled to 200ml of w ater) using a 970nm LED. As the NIR light field passes o ver the bladder, characteristic drop in ligh t in tensit y app ears (F ong et al., 2018a). 21 Chapter 4 Exp erimen tal Analysis on Human Sub jects Human bo dy is full of v ariations, having different b o dy t ype, shap e and size. The exp eri- men tal analysis cov ered under section 3.2 pro ves that an NIRS based metho dology using 970nm w a velength is successfully able to detect w ater through a 2cm thic k la yer of tissue in a controlled environmen t. Making a transition from exp erimen tal setups to testing on h uman sub jects commanded ma jor impro v emen ts in the system arc hitecture so that the system could b e robust enough to handle the v ariations in the physical characteristics of bladder like shap e, size, capacit y , lo cation, dynamics etc. 4.1 Up dated Prob e Design In order to dev elop the up dated device, follo wing considerations were taken in to accoun t- • W earable System F or testing on h uman sub jects, the device had to be flexible and ligh t-weigh t so that it could b e easily wrapp ed around the ab dominal area. F or NIRS applications, ligh t source and detector should b e in flushed contact with skin to preven t an y ligh t loss and get reasonable information but it may also introduce thermal effects b et w een the tissue and prob e. Flexibility of the prob e thus w ould enable it to adjust to any b ody shap e. • Bladder Shap e, Size and Lo cation 22 Lo cation, shap e and size of h uman bladder v aries slightly from p erson to p erson. The probe describ ed earlier in section 3.2 had only one LED-PD pair and hence the c hance of missing the bladder if the prob e is not placed carefully w as extremely high. Another imp ortan t asp ect to account for is the v ariable w aist sizes resulting in v ariation of tissue thic kness (present betw een the prob e and the bladder). Hence, dev eloping a system with m ultiple LED-PD pairs has the ability to co v er a large ab dominal area and to measure the diffused reflectance of input light for v ariable p enetration depths. • Energy Consumption As h uman b o dy is a highly scattering and dynamic medium, driving the LEDs at a higher p o w er would increase the probability of photons b eing detected at PD. Ho w ever, as the input p o w er increases, heat generated by the system also increases whic h may lead to arbitrary b eha vior of em b edded systems. Increasing the num ber of LEDs and PDs on prob e also increases the energy budget required for switching in-b et w een them. A steady p o wer source is also desirable so as to increase reliabilit y of the data collected by the system. • Flexible Design A flexible design that is scalable and adapts as the user requiremen ts c hange is alw a ys desirable. F or example, having fine con trol o v er data acquisition, pro- grammable gain settings, ability to switch mo de of op eration etc. 4.1.1 Optical Prob e T aking the abov e men tioned design considerations into accoun t, system w as upgraded 1 b y adding eigh t 970nm LED-PD pairs to the probe made with copper-coated p olyimide (Kapton, DuPon t) to ensure full co v erage of bladder. P olyimide, a flexible bio-material that is used in v arious flexible electronics (Chen et al., 2015b), w as used instead of using a con v entional rigid substrate. It can b e etched or milled to create electrical traces, thereby 1 W ork included in this section w as done jointly in collab oration with Daniel F ong. 23 allo wing the in tegration of LEDs and PDs with the substrate. Any exp osed copp er was then cov ered with p olyimide tap e to preven t ov er-time corrosion. Since human tissue is a highly-scattering medium, when a photon enters tissue it is quic kly scattered from its initial tra jectory . This means that more photons will likely reside close to its entry point, and are more probable to exit the tissue closer to the source. How ev er, photons that exit the tissue further from the emitter are more likely to ha v e trav ersed deep er into the tissue. Keeping in mind that the total num ber of photons that exit at that distance is muc h lo w er, this setup uses a SD distance (distance b etw een LED and PD) of 4cm to k eep things consisten t with the prob e used for optical phan toms. Eac h opto de pair is then spaced 2cm aw a y from each consecutive pair as sho wn in Figure 4.1. T aking in to accoun t the in ternational standard of safet y limit for op eration on h uman sub jects (DIN, 2011; Commission et al., 2006) the LEDs were driv en at 800mA to ac hiev e the b est p ossible photon p enetration. Figure 4.1: A real life picture showing both parts of the setup - a wearable, flexible, non- in v asive optical probe; opto de con trol system that actuates betw een the ligh t emitters and records the resulting diffuse reluctance placed in a 3D printed b o x (F ong et al., 2018b). 4.1.2 System Arc hitecture The prob e control system can b e distributed into 2 main mo dules- driving LEDs and recording diffused reflectance as seen at PDs. T o con trol the up dated prob e, significan t 24 c hanges had to be made on the device side for enabling new features like LED-PD actu- ation and synchronization, data acquisition etc. Figure 4.2: High-lev el system architecture for curren t prob e having m ultiple LEDs, Pho- to diodes. As men tioned earlier, its desirable to op erate LEDs at high-p o w er for deep-tissue measuremen ts but it often requires LED driv ers that can handle large amoun ts of curren t. In order to dev elop a flexible system that could tune as per user requiremen ts, multiple LEDs with programmable current settings and high pow er LED drivers had to b e used. These drivers take up a lot of space, in addition to that, the TI AFE chip could only supp ort a maxim um of tw o LEDs as mentioned in section 3.1.2. T o o v ercome these limitations, one high p o w er LED driver was used in conjunction with series of high- curren t capable switches to con trol actuation betw een m ultiple LEDs. This remo v ed the requiremen t of ha ving m ultiple switc hes but allo wed only 1 LED to b e actuated at a giv en time. Current driv er uses a set v alue of resistor to con trol the amoun t of curren t fed into the LED which is achiev ed by using a digital p oten tiometer. It is programmed using a micro con troller which receives user settings and interprets them in real-time. Similar to LED actuation, PD switc hing is achiev ed b y a series of low-resistance switc hes b et w een PDs and transimp edance amplifier, to select the detector of interest and feed its signal in to a single set of aforemen tioned detection comp onen ts. Figure 4.2 shows a high-lev el 25 o v erview of the up dated system architecture. Micro con troller through a single c hannel is thus used to activ ate the desired LED and PD pair. Collected data after passing through the programmable ADC is off-loaded to a laptop via a USB connection which is also used for collecting user initiated requests and pow ering the device. The off-loaded data is further analyzed to discov er underlying patterns. T able 4.1: Comparison of the developed system with that of Molavi et al. (2014) Mola vi et al. (2014) Our System No. of Opto de P airs 1 8 Emitter W av elength 950nm 970nm Emitter Op eration 370mA, 60mW 800mA, 586mW Detector Active Area 5.22mm 2 6.25mm 2 Detector Resp onsivit y 0.45A/W 0.56A/W SD Gap 3cm 4cm AFE Gain 6x10 6 V/A ≈ 1x10 4 V/A Since, the tec hnique of using NIRS to sense change in bladder volume used in this study is closest to that of Mola vi et al. (2014), table 4.1 shows the specification comparison b et w een the systems used in each study . Higher SD gap enables the developed system to p enetrate deeper tissue la y er with an emitter w a velength of 970nm whic h is more sensitiv e to w ater as compared to 950nm. Higher op erating curren t and optical p o wer generated at the emitter translates to more photons reac hing the detector. Higher detector responsivity p oin ts to higher current pro duced by the PD p er w att of optical p o w er it receiv es. 4.2 V olun teer Enrollmen t and Data Collection Adult healthy sub jects were enrolled in the study after it w as appro ved b y UC Davis Institutional Review Board (IRB). Sub jects w ere con tacted through emails and flyers p osted across the UC Davis campus. F or eac h sub ject v olun teering for the study , prob e w as placed on the outer skin, (more details on probe placemen t are cov ered in section 26 (a) (b) Figure 4.3: V olun teer undergoing bladder v olume measurement trial using the device describ ed in section 4.1. a) Readings b eing collected with v olun teer in sitting p osition. b) Readings b eing collected with volun teer in reclined p osition. 4.2.1) and readings were taken in 3 p ositions - standing , sitting and r e cline d for 1 minute eac h. Readings collected ov er this time were later av eraged to reduce the error due to mov emen ts or other external factors. Idea b ehind different p ositions w as to co v er some basic scenarios that a p erson suffering from Neurogenic Bladder Dysfunction ma y go though in day-to-da y life. T o measure the amount of urine presen t inside bladder, sub jects w ere asked to v oid in a urine sp ecimen collection container. State of bladder just b efore v oiding is referred to as ful l-bladder state and it w as assumed that b eing health y sub ject the v olun teer w ould v oid their bladder to full and th us, volume of liquid inside their bladder p ost-v oid w as assumed to b e zero ml or empty-bladder state . F or each 27 sub ject other biographical information like age, gender, height, w eigh t and w aist (from hip to hip) w as also recorded. Figure 4.3 sho ws a volun teer undergoing bladder v olume measuremen t study . As h uman b o dy is an extremely v ariable system, biographical information thus col- lected will pro v e useful for the future goals of this study where using mac hine learning algorithms, a mo del can b e trained for tuning the device specifically to meet requirements of each individual sub ject (more details ab out this is cov ered in section 5.1). 4.2.1 Prob e Placemen t Figure 4.4: Picture outlining the normal placement of prob e on a participant(F ong et al., 2018b). F or collecting data on h uman sub jects probe was placed on lo w er ab domen b et w een um bilicus and pubic b one as sho wn in Figure 4.4. Opto de pairs are n um b ered from 1 to 8, ID n um b er 1 b eing closest to the pubic b one whereas ID nu mber 8 is closest to the um bilicus. As mentioned earlier, con tact betw een opto de and skin is v ery imp ortant for NIRS measuremen ts to a v oid an y signal loss. T o main tain a flushed con tact with the skin, probe w as placed under all clothes and a self-adheren t wrap was used to apply pressure to keep the sensor at a fixed lo cation. The wrap made sure that sensor remained stationary as the sub ject mov ed around for measurements. 28 4.3 Exp erimen ts This section cov ers details on the exp eriments that w ere conducted on health y sub jects after appro v al b y the IRB. Goal of these exp erimen ts w as to ev aluate feasibility of the dev elop ed device on human sub jects. F or exp eriments included in this section, signal detected at PD due to emitted LEDs is referred to as desir e d signal while detected signal as a result of any other light source, e.g ambien t light is referred as noise . Desir e d signal can b e separated from the detected signal by subtracting ambien t voltage v alue. 4.3.1 F ull and Empt y bladder state comparison with multiple v olun teers 10 adult healthy volun teers were selected to test the dev elop ed device. T o maintain v olun teer confidentialit y each volun teer was given a co de namely , UCD101 to UCD110 dep ending on the order in which they signed-up. Eac h v olun teer came in for the experiment with a ful l-bladder and then prob e w as placed on the ab domen taking readings in aforemen tioned positions as explained in sec- tion 4.2. After this, the sub ject w as ask ed to v oid in a urine specimen collection con tainer, to quan tify the amount of urine presen t inside the v olunteers bladder. P ost-voiding the same set of readings w ere rep eated for an empty-bladder state . In order to minimize error caused due to sensor mo v ement, prob e remained attached to the v olun teer throughout the exp eriment and was only remov ed after both pre- and p ost-v oid data w as successfully recorded. Measuremen ts were recorded at each of the opto de pairs presen t on the prob e along with am bien t light readings, to achiev e an ov erall sampling rate of 1Hz. As ph ysi- ological change in bladder volume is a slow pro cess, this sampling rate is appropriate for detecting those changes. Goal of this experiment w as to test if in tensity of ligh t at the detector increases as v olume of liquid inside the bladder decreases from full- to empt y-bladder state, as seen with phantom exp erimen ts. 29 4.3.1.1 Results Figure 4.5 and 4.6 show results from the exp erimen t done on volun teer UCD103 and UCD104 in all three aforemen tioned p ositions. While the full and empt y bladder states in the figures b elo w are represen ted with orange and blue color, the x-axis v alues represen t opto de ID as measurements were p erformed on eac h opto de pair presen t on the prob e. According to the study done on optical phan toms in section 3.2, as v olume of liquid inside the bladder increases photons detected at PD decreases b ecause of increased absorption b y w ater. (a) (b) (c) Figure 4.5: Measuremen ts p erformed on v olun teer UCD103 during the volun teer study . V oltage v alue rep orted for eac h pair is am bien t cancelled. Figure a), b) and c) sho w data in standing, sitting and reclined p osition resp ectiv ely . 30 (a) (b) (c) Figure 4.6: Measuremen ts p erformed on v olun teer UCD104 during the volun teer study . V oltage v alue rep orted for eac h pair is am bien t cancelled. Figure a), b) and c) sho w data in standing, sitting and reclined p osition resp ectiv ely . As seen in figures ab o v e, the expected trend is not consistent across opto de pairs. Main reason b ehind this randomness is the v ariation due to differen t b o dy shap e, size and t yp e, whic h makes it impossible to co-relate the data b et w een differen t volun teers. This randomness also mak es it difficult to find any underlying patterns b y visual insp ection. Hence, to test statistical significance of the collected data for full- and empt y-bladder states within each opto de pair, tw o-tailed Studen t’s t-test was used. Studen t’s t-test is commonly used statistical test to chec k if the t w o a v erages (means) are statistically significan t and in tw o-tailed t-test the critical area of a distribution is t wo-sided. T able 4.2 sho ws results across 3 p ositions for 8 opto de pairs presen t on the prob e using data 31 collected from all 10 v olun teers. p-v alue ( p >> 0 . 01) across all the data p oin ts sho ws failure to reject the n ull hypothesis meaning that the collected data is not statistically significan t. T able 4.2: Tw o-tailed Studen t’s t-test on data collected from full and empt y bladder state comparison study Standing Sitting Reclined Opto de P air 1 0.587 0.232 0.409 Opto de P air 2 0.393 0.215 0.336 Opto de P air 3 0.238 0.213 0.447 Opto de P air 4 0.104 0.852 0.144 Opto de P air 5 0.067 0.420 0.705 Opto de P air 6 0.334 0.340 0.368 Opto de P air 7 0.331 0.264 0.329 Opto de P air 8 0.362 0.073 0.627 4.3.2 Lo w-frequency longitudinal study with single v olun teer T o remo ve v ariation due to differen t b o dy shap e, size and type, device w as tested on a single v olun teer to c hec k for an y visible trend in ligh t in tensit y at the detector as v olume of liquid inside the bladder c hanges. Also, turning-on the device and prob e for a long-p erio d ga v e insights on its stability and reliability as a function of time. V olunteer in this case started with an empt y-bladder and readings w ere taken ev ery 40-min utes in all three aforemen tioned p ositions. 200ml of water w as consumed by the v olun teer after completing eac h set of readings (readings taken in all three p ositions for a minute each). The 40 minute gap b et w een sets allo w ed water to go through volun- teer’s digestiv e system and reach his/her bladder. Readings for empt y-bladder w as taken immediately after voiding and no water w as consumed during the ful l- to empty-bladder transition. As urine pro duction in human b o dy is an intermitten t pro cess, there was no wa y to quantitativ ely measure the volume of liquid inside bladder unless it w as in empty-bladder or ful l-bladder state. Th us, the state of bladder in b et w een these t w o is 32 simply referred as p artial ly-fil le d . As the volun teer drank water at end of each set, it w as assumed that volume of liquid inside the bladder kept increasing, unless ful l-bladder state was reached, p ost whic h volun teer v oided. Measurements w ere recorded at each of the opto de pairs present on the prob e, along with am bien t ligh t readings similar to section 4.3.1 and all sensor v alues (in volts) rep orted under the results section are p ost am bien t cancellation. Prob e remained attac hed to the v olun teer’s ab dominal area during the en tire length of exp erimen t and w as kept in place using self-adhesive wrap to a v oid error due to sensor mov emen t. 4.3.2.1 Results (a) (b) (c) Figure 4.7: Measuremen ts p erformed on volun teer during the longitudinal study . Bladder status is represented on the x-axis by Empty , P artial or F ull state. Figure a), b) and c) sho w the data in standing, sitting and reclined p osition resp ectiv ely . 33 Figure 4.7 shows results from a single volun teer low-frequency longitudinal study in all three p ositions. I t can b e seen that opto de pairs don’t follow a consistent trend, and the random v alues detected can b e attributed to noise. It w ould thus be useful to quantify the amount of noise that is b eing detected at the PDs. Noise F ree Measurement was done at ADC to measure the amount of noise quanti- tativ ely . Calculations w ere done for each opto de pair, k eeping gain of ADC as constant. Curren t measured at the photo dio de while LED is on is referred as I P hotodiode whic h is the sum of current due to LED I P leth and am bien t ligh t I Ambient . V oltage across the ADC V Dif f is gov erned by the following equation [source:T ex (2017)]- V Dif f = 2 ∗ R G [ I P leth ∗ R F 100 K + I Ambient ∗ R F 100 K − I C ancel ] where, R F and R G are first and second stage gain control resistances ha ving v alues 10KΩ and 100KΩ resp ectiv ely and I C ancel is the am bien t cancellation curren t which in this case is 0A. Noise free bits of the ADC N F B can b e calculated using the equation [source:T ex (2017)]- N F B = l og 2 [ I P hotodiode 6 . 6 ∗ I N oise ] where, I N oise is the input-referred RMS noise curren t which can b e calculated for corresp onding I P leth v alue sensed by the PD from the figure 4.8 tak en from AFE4490 datasheet. The current setup uses a duty cycle of 25% with typical v alues of I P leth lying in the range of 0 . 7 − 1 µ A. Hence, I N oise v alue can b e appro ximated as ab out 10pA. Since ADC has a resolution of 22-bits, n um b er of dirt y bits N Dir ty can be calculated b y: N Dir ty = 22 − N F B , having a typical v alue of about 12. F or the current setup, ADC has a v oltage p er division v alue of ab out 238.42nV and th us, the voltage magnitude of noise V N oise can b e calculated using the following equation- V N oise = 238 . 42 nV div ision ∗ 2 N Dir ty SNR v alues (in dB) can th us be calculated b y: 20 ∗ l og 10 ( V Dif f V N oise ). T able 4.3 sho ws SNR v alues for each opto de pair with measurements taken on the volun teer with an empt y 34 Figure 4.8: Input-referred RMS noise current for the TI AFE4490 (T ex, 2017). bladder in standing p osition. The SNR v alues for eac h opto de pair is less than the usual acceptable v alue of 40dB for em b edded systems. As the SD gap for this prob e is 4cm, there is a strong p ossibility of photons not actually hitting the bladder and b eing received at the detector from shallow depth of field. T able 4.3: Noise F ree Measuremen t for differen t opto de pair having fixed gain settings Opto de Num b er SNR v alue (dB) Opto de Pair 1 15.28 Opto de Pair 2 16.13 Opto de Pair 3 3.84 Opto de Pair 4 3.62 Opto de Pair 5 14.58 Opto de Pair 6 3.77 Opto de Pair 7 25.92 Opto de Pair 8 25.94 Also, as the prob e was attac hed to the volun teer’s ab domen for the entire length of this exp erimen t, it was noticed that prob e started to sho w some signs of deformit y and 35 had to b e manually brought bac k in to correct shap e so that opto de pairs w ere in flush con tact with volun teer’s skin. This could also hav e b een another potential source of error added to the system during measurements. 4.3.3 High-frequency longitudinal study with single v olun teer Since results from the lo w-frequency longitudinal study were not v ery promising and in order to reduce probable error due to v olunteer and prob e mov emen t as a result of 40 min ute gap b et w een readings, measuremen ts were tak en in fixed p osition (sitting) at high frequency to get a b etter understanding of system b eha viour. V olunteer, similar to the study cov ered in section 4.3.2, started with an empt y blad- der and measuremen ts w ere recorded at eac h opto de pair present on the prob e at high sampling frequency of 1 sample/second (1 sample con tains sensor v alue of all 8LED-PD pairs). V olun teer started with an empty bladder and approximately 100ml of water was consumed ev ery 15min while prob e remained attac hed to the volun teers ab domen during the entire length of study . All sensor v alues (in v olts) rep orted under the results section are p ost ambien t-cancellation. 36 4.3.3.1 Results (a) (b) (c) (d) Figure 4.9: Measuremen ts performed on v olunteer during the high-frequency longitudinal study . Eac h LED data is fitted using a 5 th order p olynomial function. Figure a) to d) represen t data from LED 1 to 4, resp ectiv ely . Data from LED 5 to 8 w as not rep orted b ecause of its closeness to Umbilicus. Figure 4.9 sho ws result from the single v olunteer high-frequency longitudinal study . Data collected from LED 5 to 8 was not rep orted b ecause of its closeness to Um bilicus. The 5 th order p olynomial fitted function for each LED helps to ignore small sources of noise and shows fairly stable v alues. The only v ariations presen t are b ecause of v olun teer’s mo v ement while he/she consumes water. Figure 4.10 sho ws sensor v alue as a function of time while volun teer is v oiding. V ertical green and red line represen ts b eginning and ending of voiding, resp ectively . As voiding b egins, the urine present in bladder starts to reduce rapidly . The chosen sampling rate is suitable to capture an y probable trends in sensor v alues as the bladder volume de- creases. While LED3 shows an increase in sensor v alue as v oiding b egins, no clear trends are observ ed in the measuremen t whic h is consistent with other studies done on human 37 sub jects. Figure 4.10: Measuremen ts p erformed during volun teer v oiding. The green line marks the b eginning of voiding while red line marks end of voiding. 4.3.4 Impact of v ariable SD distance Goal of this exp erimen t was to visualize penetration depth of photons in the current setup by ha ving v ariable SD distances on the prob e. As men tioned in section 3.1.1, depth of photon p enetration is approximately half the SD distance and hence, the maximum photon penetration depth can b e calculated once the corresponding SD distance is kno wn. Since the curren t prob e has eigh t opto de pairs, for getting v ariable SD distance, in- stead of recording measurements at each opto de pair, one LED was turned on and the measuremen ts w ere recorded at each of the eigh t PDs presen t in the prob e. As SD dis- tance increases path length of the photons also increases resulting in higher attenuation. Hence, if v alue of LED-on voltage b ecomes equal to the ambient-voltage , it means that the photons emitted by LED are not actually reaching the detector and detected v oltage can b e accounted to noise due to am bien t light, i.e., in suc h a case impact of emitter LED on the detector PDs can b e considered as zero. 4.3.4.1 Results T able 4.4 sho ws the impact of v ariable SD distance on the voltage detected at PDs. F or this exp eriment LED 1 w as turned on and the signal w as detected on eac h of the eight PDs. 38 It can b e seen that as SD distance increases, v alue of v oltage at detector PD decreases b ecause of the increased path length. V alue of am bien t-v oltage for this measuremen t w as ab out 3.96E-03V. Hence, the maximum photon p enetration depth for the curren t setup is ab out 2.25cm which can observ ed at SD of ab out 4.5cm. T able 4.4: Impact V ariable SD distance on the detected signal at PD PD Number SD Distance with V oltage(V) resp ect to LED 1(cm) PD 1 4.0 1.61E-02 PD 2 4.5 8.81E-03 PD 3 5.7 2.64E-03 PD 4 7.2 3.73E-03 PD 5 8.9 1.45E-03 PD 6 10.8 1.27E-03 PD 7 12.6 6.58E-04 PD 8 14.6 6.28E-04 4.3.5 Impact of lateral photon mo v emen t In NIRS, photons reac hing the PD give information on optical prop erties of the medium it trav els through. In case of air-gap betw een opto des and tissue structure, some optical signal may leak and tra v el laterally without entering the tissue structure or ma y trav el at shallow depths through the medium to reach PD. Such photons reaching the PD, con tribute to exp erimen tal noise as they don’t giv e an y information about the tissue medium. Th us, minimizing the impact of lateral photon mo vemen t is desired so as to impro v e the accuracy of the detected signal. Exp erimen tal setup to quan tify the impact of lateral photon mov ement is describ ed in figure 4.11. Blo c k of thic k blac k foam w as used as a high optical absorption medium and later the en tire setup was placed in a dark ro om to minimize the impact of ambien t ligh t. Th us, most photons en tering the medium are absorb ed and only the ones trav elling laterally or through shallo w depths mak e it to the PDs. The LED-PD measuremen ts were 39 recorded in pairs and the v alues were rep orted p ost ambien t cancellation. (a) Side-View (b) F ront-View Figure 4.11: a) Side-view showing the setup, where probe is placed on top of a medium with high optical absorption in a dark room. b) F ront-view showing ho w photons tra vel through the system. As medium below the prob e has high optical absorption, most photons en tering it get absorbed. Thus, photons reaching the PD are as a result of lateral mo v ement or tra v elling with shallow depths through the medium. Another p ossible technique to theoretically quan tify the impact of lateral photon mo v e- men t is to c hec k the radian t in tensit y of LED for viewing angles b et w een 90 ◦ to about 40 ◦ . The summation of radiant intensities for this viewing angle can th us b e appro ximately considered as causing lateral photon mov emen t and its impact can b e calculated using Mon te Carlo simulation, describ ed in section 4.4. This technique ho w ever is not used for calculation of the b elow men tioned results. 4.3.5.1 Results Using the setup as describ ed in figure 4.11, the typical voltage v alue detected as a result of lateral photon mo v emen t after m ultiple runs in a dark ro om, is ab out 0.0048V while the t ypical empty bladder v alues detected in the h uman sub jects is ab out 0.035V. Thus, it can b e concluded that lateral photon mo v emen t con tributes to ab out 14% of the total detected signal. T o reduce the impact of lateral photon mov emen t, it is imp ortan t to ha ve a flushed con tact b etw een the opto des and tissue structure. Also, having a thin opaque separation b et w een the LED-PD pairs might help in reducing this noise. 4.4 Mon te Carlo Sim ulation Mon te Carlo Sim ulation is a n umerical sim ulation method whic h estimates the ligh t trans- p ort in tissue structure and due to sto chastic nature of light propagation in tissue, it is 40 widely used for medical purp oses (Simpson et al., 1998; Zhang et al., 2007). As it can b e seen that the trials on h uman sub jects done in section 4.3 don’t sho w an y clear c hange in sensor v alues as volume of liquid inside bladder changes. Hence, to explain inconsistency in results and simulate the behaviour of developed system, a 3-dimensional Mon te Carlo algorithm (Boas et al., 2002) was used to sim ulate photon transp ort in human ab domi- nal tissue structure (Saffarp our and Ghiasi, 2018). 3-dimensional tissue mo del used for sim ulations can b e seen in figure 4.12. Though sim ulations were done o v er v arious SD distances, for purpose of this study only SD gap of 4cm is utilized so as to sim ulate the curren t setup. Figure 4.12: F ront-view of the abdomen mo del used for Mon te Carlo Sim ulations. Mo del is cub e with eac h side b eing 150mm and having follo wing la y ers, eac h of whic h is also represen ted by a cub e- Air(10mm), Dermis or outer-skin(2mm), Sub-Dermis or sub cuta- neous fat (10mm) and muscle(128mm). Single 970nm LED source is used and 18 detector PD are placed, eac h 5mm apart. Blue circle represents LED source while subsequent blue squares represent PDs. As men tioned earlier, 970nm LEDs presen t on the curren t probe w ere driv en at 800mA for trials on h uman sub jects. Since LED datasheet giv es a radiated p o w er for minimum 41 of 1A of forw ard current, the curve w as extrap olated in order to get a radiated p ow er of 586mW for an input forw ard current of 800mA (Mar, 2014). As p er results from Mon te Carlo simulation on mo del describ ed in figure 4.12 for 500million sim ulated photons (Saffarp our and Ghiasi, 2018), radiated optical p ow er of eac h LED is reduced by an appro ximate factor of 5 . 4 × 10 − 6 b y the time it reaches detector PD. Hence giv en 586mW of radiated optical p o w er from the current setup, appro ximately 3.18 µ W of optical p o w er is detected at PD. PD having an active area of 0.0625cm 2 and resp onsivit y of 0.05mW/cm 2 generates a forw ard current of appro ximately 2 µ A (F ai, 2016). Current generated b y PD is fed to an ADC for conv erting the generated current in to voltage v alues. Considering a single stage ADC gain having R F v alue 10KΩ, (as used in experiments cov ered under section 4.3.1) it can b e seen that the practical and simulated output voltage v alues are b oth of the order of 10mV, taking in to account the assumptions made for these calculations. 4.4.1 Results Lo oking at the output v oltage v alues observed by sim ulation and h uman exp erimen ts, it can b e concluded that results from the tw o studies align with each other. Although mo del used for simulations do es not consider a bladder within the tissue structure, it can b e inferred that the dev elop ed system describ ed under section 4.1.2, is probably not able to penetrate tissue structure to actually reach bladder i.e. detected photons are coming from muscle lay ers after diffused reflectance instead of actually reaching bladder. Random v ariation in readings observed during human trials can be explained by v ari- ous noise sources presen t inside the h uman bo dy lik e ab dominal m uscle mo v emen t, breath- ing, v olun teer mo v emen t etc. In order to pro v e ab o v e men tioned analogy , detailed analysis using a more realistic bladder mo del with different filling states needs to b e simulated. 42 Chapter 5 Conclusion and F uture W ork This thesis presen ted details on v arious stages during developmen t and testing of a w ear- able, flexible, non-inv asiv e device for monitoring the amoun t of urine presen t inside the h uman bladder. Dev elop ed device sho ws promising results in con trolled en vironments such as optical phan toms, where water present b eneath 2cm thic k la yer of b o vine tissue is successfully detected. As v olume of water inside the phan tom increases, attenuation of photons also increases resulting in decreased signal at the detector PD. Though, results obtained dur- ing phantom exp erimen ts don’t exactly translate to exp erimen ts with h uman sub jects but differen t methodologies tried during the course of this thesis will shed some ligh t in dev elopmen t of next generation bladder v olume estimation system. 5.1 F uture W ork F ollowing are some design considerations w orth noting, while developing next generation of prob e and opto de con trol system- • Prob e material and size The curren t prob e used for h uman trials w as made with copp er-coated p olyimide material which is a flexible bio-material. W rapping with p olyimide tap e to preven t copp er corrosion makes the prob e a little stiff. Another factor which mak es flushed con tact b et w een the opto des and skin difficult is length of prob e (18cm). 43 End goal of this study is to hav e a wearable device in form of an adhesiv e bio-sensor patc h that simply attac hes to the users’ outer skin. • Opto de Con trol System Human trials and simulation results sho w low current v alues b eing detected at PD b ecause of increased signal absorption. Increasing the PD active area can increase the num b er of detected photons at PD resulting in higher curren t v alues. Also, instead of using a wired connection for off-loading the data and getting user inputs using a wireless-connection lik e Blueto oth Lo w-Energy (BLE) w ould be ideal. This w ould give more freedom to user as they don’t ha v e to b e tethered at all times. Ev en tually , a smart device with built-in Blueto oth lik e smart watc h or smart phone can communicate with the sensor and thus, can b e used to notify the user on when is the right time to void. • Prob e attac hmen t As mentioned earlier, the current prob e in long p erio ds of operation, deforms out of shap e. Reducing the prob e size and making it more flexible will help in impro ving the opto de-skin con tact. Also, using a b etter attac hment mechanism will help in k eeping prob e at a constant p osition, so that error due to prob e mo v emen t could be minimized. • Mon te Carlo Sim ulation Mon te Carlo Sim ulations are used to estimate ligh t transp ort in tissue structure and ha v e wide range of medical applications. Sim ulation results from section 4.4 w as used to verify results from h uman trials and gav e insigh ts on the current setup. In a similar wa y , sim ulating a more realistic ab dominal tissue structure mo del can give insigh ts on minimum input p o w er required at eac h LED, exp ected output curren t at PD, optimal SD gap etc. which can pro v e useful for developing next generation bladder volume estimation system. 44 5.1.1 Mac hine Learning Humans are unique individuals and ha v e different shap es, sizes, and b o dy types. This mak es it difficult to create a generic system that p erforms equally well for different in- dividuals when lo oking at an inherently unique qualit y suc h as bladder capacit y . The data collected while testing the device on human sub jects can b e arc hived o v er time and th us can later b e used to train mo dels using mac hine learning (ML) for tuning the device whic h is sensitiv e to eac h individual’s characteristics. F or example, data collected from the sensors can b e fed to a trained mo del which using classification algorithms lik e supp ort v ector machines (SVM) and logistic regression w ould be able to differentiate b et ween full and empty bladder states and give feedbac k to the user on the right time to void. 45 References Behnam Mola vi, Babak Shadgan, Andrew J Macnab, and Guy A Dumon t. Nonin v asive optical monitoring of bladder filling to capacit y using a wireless near infrared sp ec- troscop y device. IEEE tr ansactions on biome dic al cir cuits and systems , 8(3):325–333, 2014. Non-Hispanic White and Non-Hispanic Blac k. Spinal cord injury (sci) facts and figures at a glance. National spinal c or d injury statistic al c enter, facts and figur es at a glanc e , 2016. Barbara Ann Shelton Bro ome. The impact of urinary incon tinence on self-efficacy and qualit y of life. He alth and Quality of Life Outc omes , 1(1):35, 2003. Dudley Robinson and Linda Cardozo. Urinary incontinence in the y oung woman: treat- men t plans and options a v ailable. Women ’s He alth , 10(2):201–217, 2014. Mik el Gray , Ric hard Ray ome, and Carol Anson. Incon tinence and clean intermitten t catheterization following spinal cord injury . Clinic al nursing r ese ar ch , 4(1):6–18, 1995. Laura S Nahm, Y uying Chen, Michael J DeViv o, and L Keith Llo yd. Bladder cancer mortalit y after spinal cord injury ov er 4 decades. The Journal of ur olo gy , 193(6):1923– 1928, 2015. Daneil F ong, Alejandro V elazquez Alcantar, Prashant Gupta, Eric Kurzrock, and So- heil Ghiasi. Non-in v asive bladder volume sensing for neurogenic bladder dysfunction managemen t. IEEE 15 th International Confer enc e on We ar able and Implantable Bo dy Sensor Networks (BSN) , March 2018a. Daneil F ong, Xiaofan Y u, Jiageng Mao, Mah y a Saffarp our, Prashan t Gupta, Rami Abueshsheikh, Alejandro V elazquez Alcan tar, Eric Kurzro c k, and Soheil Ghiasi. Restor- ing the sense of bladder fullness for spinal cord injury patients. IEEE/ACM 3 r d In- ternational Confer enc e on Conne cte d He alth: Applic ations, Systems and Engine ering T e chnolo gies , September 2018b. 46 F rans F Jobsis. Noninv asiv e, infrared monitoring of cerebral and m y o cardial o xygen sufficiency and circulatory parameters. Scienc e , 198(4323):1264–1267, 1977. TWL Sc heeren, P Schober, and LA Sc h warte. Monitoring tissue o xygenation by near infrared spectroscopy (nirs): background and current applications. Journal of clinic al monitoring and c omputing , 26(4):279–287, 2012. Daniel F ong, Andr ´ e Kno esen, and Soheil Ghiasi. T ransab dominal fetal pulse oximetry: The case of fetal signal optimization. In e-He alth Networking, Applic ations and Servic es (He althc om), 2017 IEEE 19th International Confer enc e on , pages 1–6. IEEE, 2017. Adelina P ellicer and Mar ´ ıa del Carmen Bra vo. Near-infrared sp ectroscop y: a metho dology-focused review. In Seminars in fetal and ne onatal me dicine , volume 16, n um b er 1, pages 42–49. Elsevier, 2011. AFE4490 Inte gr ate d analo g fr ont-end for pulse oximeters . T exas Instrumen ts, August 2017. SBAS861. Linhong Kou, Daniel Labrie, and P etr Ch ylek. Refractive indices of water and ice in the 0.65-to 2.5- µ m sp ectral range. Applie d optics , 32(19):3531–3540, 1993. SA Prahl. T abulated molar extinction co efficient for hemoglobin in water. http://omlc. o gi. e du/sp e ctr a/hemo globin/summary. html , 1999. Rob ert LP v an V een, HJCM Sterenborg, A Pifferi, A T orricelli, and R Cub eddu. Deter- mination of vis-nir absorption co efficien ts of mammalian fat, with time-and spatially resolv ed diffuse reflectance and transmission sp ectroscop y . In Biome dic al T opic al Me et- ing , page SF4. Optical So ciety of America, 2004. Rob ert H Wilson, Kyle P Nadeau, F rank B Ja worski, Bruce J T romberg, and An thon y J Durkin. Review of short-w a v e infrared spectroscopy and imaging metho ds for biological tissue characterization. Journal of biome dic al optics , 20(3):030901, 2015. Op enStax College. A natomy & Physiolo gy . Op enStax College, 2013. 47 C Rose, Alison P ark er, Bruce Jefferson, and Elise Cartmell. The characterization of feces and urine: a review of the literature to inform adv anced treatment technology . Critic al r eviews in envir onmental scienc e and te chnolo gy , 45(17):1827–1879, 2015. Niels Kristian Kristiansen, Steffen Ringgaard, Hans Nygaard, and Jens Christian Djurh uus. Effect of bladder v olume, gender and b o dy p osition on the shap e and p o- sition of the urinary bladder. Sc andinavian journal of ur olo gy and nephr olo gy , 38(6): 462–468, 2004a. Uda y P atel and David Rick ards. Imaging and ur o dynamics of the lower urinary tr act . Springer, 2010. Rob ert D Dreher, Gerald W Timm, and William E Bradley . Bladder v olume sensing by lo cal distension measuremen t. IEEE T r ansactions on Biome dic al Engine ering , BME-19 (3):247–248, 1972. Jianh uo W ang, Chunlin Hou, Xiany ou Zheng, W ei Zhang, Aimin Chen, and Zhen Xu. Design and ev aluation of a new bladder volume monitor. Ar chives of physic al me dicine and r ehabilitation , 90(11):1944–1947, 2009. Johan Co osemans and Rob ert Puers. An autonomous bladder pressure monitoring system. Sensors and actuators A: Physic al , 123:155–161, 2005. Stev e Ma jerus, Anisha S Basu, Iryna Mako v ey , Peng W ang, Hui Zhui, Christian Zorman, W en Ko, and Margot S Damaser. Wireless bladder pressure monitor for closed-lo op bladder neuromo dulation. In SENSORS, 2016 IEEE , pages 1–3. IEEE, 2016. Shih-Ching Chen, Tsung-Hsun Hsieh, W en-Jia F an, Chien-Hung Lai, Ch un-Lung Chen, W ei-F eng W ei, and Chih-W ei Peng. Design and ev aluation of p otentiometric princi- ples for bladder v olume monitoring: a preliminary study . Sensors , 15(6):12802–12815, 2015a. Thomas Schlebusc h, Steffen Nienke, S Leonhardt, and M W alter. Bladder v olume esti- 48 mation from electrical imp edance tomograph y . Physiolo gic al me asur ement , 35(9):1813, 2014. AJ Macnab, RE Gagnon, and L Stothers. Clinical nirs of the urinary bladder–a demon- stration case rep ort. Journal of Sp e ctr osc opy , 19(4):207–212, 2005. EA Kiely , GG Hartnell, RN Gibson, and Gordon Williams. Measuremen t of bladder v olume b y real-time ultrasound. BJU International , 60(1):33–35, 1987. Mauro Dicuio, Giorgio Pomara, F Menc hini F abris, V aleria Ales, Christer Dahlstrand, and Girolamo Morelli. Measuremen ts of urinary bladder volume: comparison of fiv e ultrasound calculation methods in v olun teers. Ar ch Ital Ur ol Andr ol , 77(1):60–62, 2005. NK Kristiansen, Jens Christian Djurhuus, and Hans Nygaard. Design and ev aluation of an ultrasound-based bladder v olume monitor. Me dic al and Biolo gic al Engine ering and Computing , 42(6):762–769, 2004b. P V an der Zee, M Cop e, SR Arridge, M Essenpreis, LA Po tter, AD Edwards, JS Wy att, DC McCormic k, SC Roth, EOR Reynolds, et al. Exp erimentally measured optical pathlengths for the adult head, calf and forearm and the head of the newb orn infant as a function of in ter opto de spacing. In Oxygen tr ansp ort to tissue XIII , pages 143–153. Springer, 1992. George Zonios and Aik aterini Dimou. Mo deling diffuse reflectance from semi-infinite turbid media: application to the study of skin optical prop erties. Optics expr ess , 14 (19):8661–8674, 2006. Ying Chen, Bingw ei Lu, Yihao Chen, and Xue F eng. Breathable and stretc hable temper- ature sensors inspired by skin. Scientific r ep orts , 5:11505, 2015b. EN DIN. 60601-2-57. T echnical report, VDE 0750-2-57: 2011-11, Medical electrical equip- men t—P art 2–57: Particular requiremen ts for the basic safet y and essential performance of non-laser light source equipmen t intended for therapeutic, diagnostic, monitoring and cosmetic/aesthetic use IEC 60601-2-57, 2011. 49 In ternational Electrotec hnical Commission et al. IEC 62471: 2006. Photobiolo gic al safety of lamps and lamp systems. Geneva: IEC , 2006. C Rebecca Simpson, Matthias Kohl, Matthias Essenpreis, and Mark Cope. Near-infrared optical prop erties of ex vivo h uman skin and sub cutaneous tissues measured using the mon te carlo in version tec hnique. Physics in Me dicine & Biolo gy , 43(9):2465, 1998. Quan Zhang, Emery N Bro wn, and Gary E Strangman. Adaptive filtering for global in terference cancellation and real-time recov ery of evok ed brain activity: a monte carlo sim ulation study . Journal of biome dic al optics , 12(4):044014, 2007. Da vid A Boas, JP Culv er, JJ Stott, and AK Dunn. Three dimensional monte carlo co de for photon migration through complex heterogeneous media including the adult h uman head. Optics expr ess , 10(3):159–170, 2002. Mah y a Saffarpour and Soheil Ghiasi. A design space exploration (DSE) on non-in v asiv e sensing of bladder filling using near infrared sp ectroscop y (NIRS). ArXiv e-prints , June 2018. Marub eni SMBB970D-1100-02, High Power LED. Marub eni, 2014. http://tech- led. com/wp- content/uploads/2017/09/SMBB970D- 1100- 02.pdf . QSB34GR/QSB34ZR/QSB34CGR/QSB34CZR Surfac e-Mount Silic on Pin Photo dio de . F airchild, Septem b er 2016. https://www.mouser.com/ds/2/149/QSB34- 1011917. pdf . 50
Original Paper
Loading high-quality paper...
Comments & Academic Discussion
Loading comments...
Leave a Comment