Estimating city-level travel patterns using street imagery: a case study of using Google Street View in Britain
Street imagery is a promising big data source providing current and historical images in more than 100 countries. Previous studies used this data to audit built environment features. Here we explore a novel application, using Google Street View (GSV) to predict travel patterns at the city level. We sampled 34 cities in Great Britain. In each city, we accessed GSV images from 1000 random locations from years overlapping with the 2011 Census and the 2011-2013 Active People Survey (APS). We manually annotated images into seven categories of road users. We developed regression models with the counts of images of road users as predictors. Outcomes included Census-reported commute shares of four modes (walking plus public transport, cycling, motorcycle, and car), and APS-reported past-month participation in walking and cycling. In bivariate analyses, we found high correlations between GSV counts of cyclists (GSV-cyclists) and cycle commute mode share (r=0.92) and past-month cycling (r=0.90). Likewise, GSV-pedestrians was moderately correlated with past-month walking for transport (r=0.46), GSV-motorcycles was moderately correlated with commute share of motorcycles (r=0.44), and GSV-buses was highly correlated with commute share of walking plus public transport (r=0.81). GSV-car was not correlated with car commute mode share (r=-0.12). However, in multivariable regression models, all mode shares were predicted well. Cross-validation analyses showed good prediction performance for all the outcomes except past-month walking. Street imagery is a promising new big data source to predict urban mobility patterns. Further testing across multiple settings is warranted both for cross-sectional and longitudinal assessments.
💡 Research Summary
This paper investigates whether Google Street View (GSV) imagery can be used to estimate city‑level travel patterns in Great Britain. The authors selected 34 primary urban areas (PUAs) representing a mix of randomly chosen and purposively sampled cities. For each city, they obtained GSV panoramas from 1,000 randomly selected street locations, restricting the image capture year to 2010‑2012 to align with the 2011 Census and the 2011‑2013 Active People Survey (APS). Using a custom Python package that accesses Google’s historic imagery API, the researchers retrieved two opposite‑direction images (0° and 180°) per location, yielding 2,000 images per city.
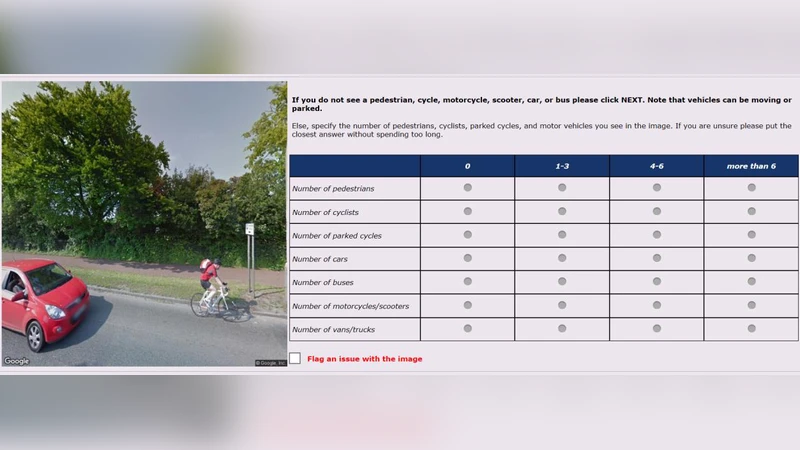
Four research assistants manually coded each image for the presence of seven road‑user categories: pedestrians, cyclists, parked cycles, cars, motorcycles, buses, and vans/trucks. Counts were collapsed into a simple “presence” variable for each category (e.g., GSV‑Cycle, GSV‑Car) because finer count categories were sparse. Seasonal variables were also derived from the month of image capture.
The outcome variables were mode‑share estimates from two established sources: (1) the 2011 Census, which reports the proportion of workers (aged 16‑74) commuting by walking/public transport, cycling, motorcycle, or car; and (2) the APS, which records the proportion of respondents who walked or cycled for any purpose in the past month.
Bivariate analyses showed very strong correlations between GSV‑Cycle and census cycling share (r = 0.92) and APS cycling participation (r = 0.90). Moderate correlations were observed for GSV‑Pedestrian with APS walking (r = 0.46), GSV‑Bus with census walking + public‑transport share (r = 0.81), and GSV‑Motorcycle with census motorcycle share (r = 0.44). GSV‑Car showed essentially no relationship with car commuting share (r = ‑0.12).
Multivariate linear regression models that included all GSV counts (and seasonal controls) explained a large proportion of variance for each mode share (adjusted R² ranging from 0.70 to 0.86). Leave‑one‑out cross‑validation indicated robust predictive performance for cycling, motorcycle, walking + public‑transport, and car commuting, but prediction of APS walking was comparatively weak, likely because pedestrians are less consistently captured in static street images.
A supplemental gender analysis attempted to infer the male‑to‑female ratio of cyclists from GSV images; however, limited sample size and image resolution prevented reliable comparison with census/APS gender data.
Key strengths of the study include: (i) a systematic, reproducible sampling framework across many cities; (ii) temporal alignment of imagery with external survey years; and (iii) the use of a real‑world, publicly available big‑data source. Limitations comprise potential seasonal and time‑of‑day bias in the images, reliance on manual coding (subject to inter‑rater variability), and reduced discriminative power for high‑frequency modes such as cars, which appear in almost every image.
The authors conclude that GSV imagery is a promising, cost‑effective tool for estimating urban mobility patterns, especially for active modes like cycling. They recommend future work to (a) automate image classification with computer‑vision or deep‑learning techniques, (b) test the approach in diverse international contexts, and (c) explore longitudinal applications to monitor changes in travel behavior over time.
Comments & Academic Discussion
Loading comments...
Leave a Comment