Classification of Epileptic EEG Signals by Wavelet based CFC
Electroencephalogram, an influential equipment for analyzing humans activities and recognition of seizure attacks can play a crucial role in designing accurate systems which can distinguish ictal seizures from regular brain alertness, since it is the…
Authors: ** *제공된 원문에 저자 정보가 명시되어 있지 않습니다.* **
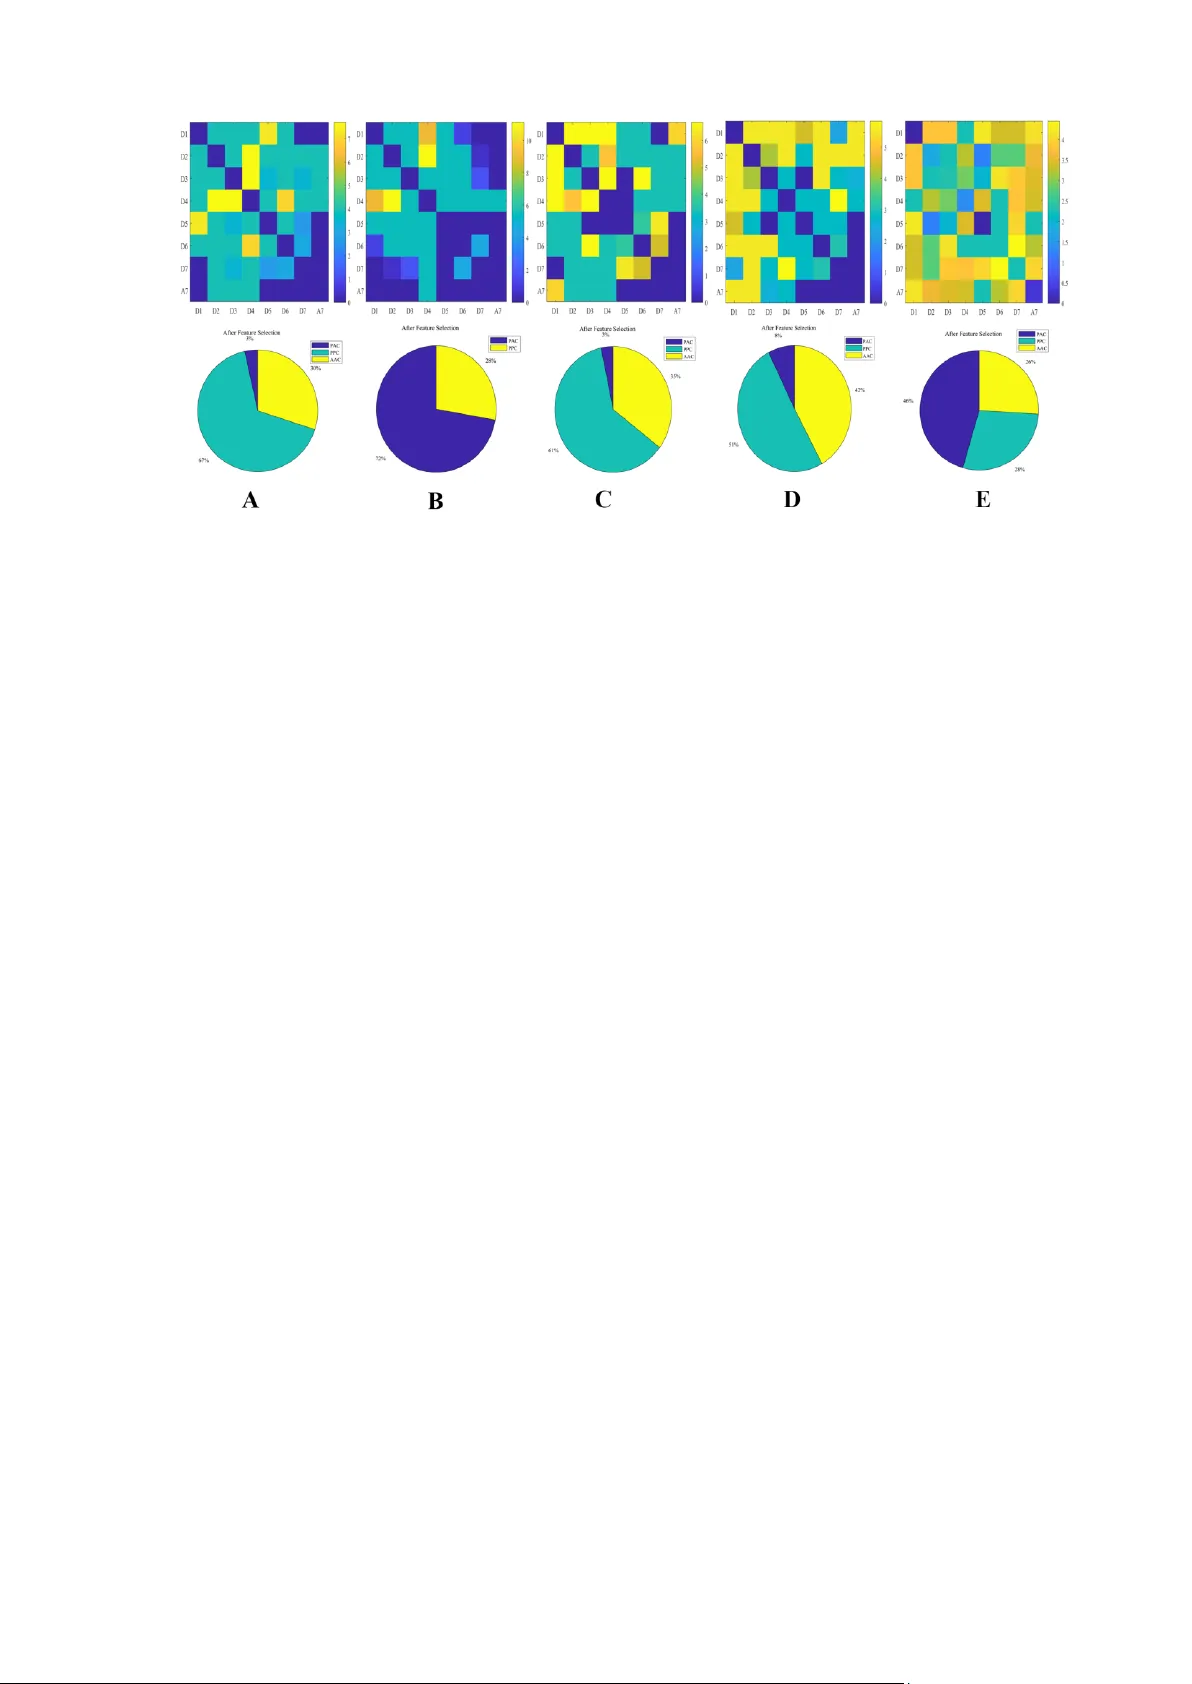
Classification of Epileptic EEG Signals by Wavelet based CFC Abstract — Electroencephalogram, an influential equipment for anal yzing human’s activities and recognitio n of seiz ure atta cks can play a crucial role in designing accurate systems which can distinguish ictal seizures from regular brain alertne ss , since it is the first step towards accomplishing a high accuracy computer aided diagnosis system (CA D). In this article a novel approach for classification of ictal signals with wavelet based cross frequency coupling (CFC) is suggested. After extracting features by wavelet based CFC, optimal features have been selected by t-test and quadratic discriminant analysis (QDA) have completed the Classification. Keywords — Electroencephalogram; Wavelet Decomposition; Cross Frequency Coupling;Quadratic Discriminant Analysis; T -test Feature Selection I. I NTRODUCTION The c omm on be lie f tha t s eizure is a sign o f e pile pti c bra in disor der is not very accura te. Occur renc e of seiz ure may take plac e regar dles s of circ um stanc es or hos t’s attr ibute s [ 1]. Repor ts of WHO claim s that the second plaus ibl e neurolo gica l disor der beneat h stroke is epilepsy . Monitoring and diagnos ing this consider abl e amount of afflict ed pati ents is achi evabl e by Elec troe ncepha log ram signa ls (E EG) [ 2,3]. Sinc e thi s di agno sis requi res physic ian’ s direct exami nati on and r esul ts are not on e and the same. Anticipat ion of epil epti c seizur e dema nds a met hod for aut oma ted com put er ai ded di agn osi s [4,5]. Time freque ncy doma in [6,7], freque ncy dom ai n [8 - 10 ] an d tim e doma in anal ysis [ 11 ] have been the basis of severa l feat ure extra cti on algorit hms to detect seizur e. After all , EEG signals ar e beli eved to be non-sta tion ary. Betwe en met hods based on time freque ncy for fea ture ext ract ion wa vele t tra nsform s are superi or options due to their loca liz ation and refle cti on of time varyi ng qual itie s of the data. Unproces sed EEG signals in conjun cti on with cer tai n proper rule s could be decom pound ed to preci se subdi visi ons, conse quent ly, noticeabl e amount of feat ures are conside red suc hli ke phase synchr oniz ati on [ 12 ] effec tive c orre lati on dime nsion [ 13 ], shor t term maximum Lyapu nov exponent s [ 14 ] acc umul ated energy [ 15 ] and dynam ical similari ty algorit hm [ 16 ] to decla re the e xist ence of an epil epti c seizur e. A real time low power algori thm for clas sifyi ng signals to detec t sei zure s in ambula tory EEG was sugges ted by Patel et al [ 17 ]. Quadrati c and line ar discrim inant anal ysis , support vect or mac hine (SVM) and Maha lanobi s disc rimi nant ana ly sis (MD A) cla ssif iers have been exa mi ned in the a forem entioned study on thir tee n sub ject s. In thi s ar tic le a new a pproa ch f or i ctal si gnals ’ clas sifi cati on based on wavelet is suggest ed after the extracti on of opti mal feat ures fr om wavel et coe ffi cient s the sign al ha s bee n cla ssif ied by QDA an d res ults claim that all cas es have been de sign ate d corre ctly . II. M ATERIAL S AND M ETHODS This s tudy denot es a W avel et ba sed CF C me thod whi ch first ly segregate s the EEG signa l into wavelet coeffic ient s subse quent ly phase and am plitud e of wavele t coeffi cie nts were com puted with Hilber t transfor m. After ranking the optim al feat ures by t-tes t, the class ifi cati on pro cedure has be en perfor me d by QDA ( Fig. 1). A bove me ntion ed c ases are: Case I: A vs.E ( Hea lthy vers us S eiz ure) Case II: B vs. E ( Heal thy vers us Ic tal ) Case III: C vs . E (Hip pocam pal Interi ctal vers us Se izure ) Case IV: D vs. E ( Epil eptog eni c Int eri ctal versus Sei zure) Case V: A BCD vs . E (Sei zur e-fre e ver sus Sei zure ) A. EEG Database of Epilepsy The EEG database is accumul ate d from Germa ny epil epsy cent er, Bonn univers ity hospita l of Freibu rg [ 18 ]. It consi sts of five subsets each co nta ining 10 0 si ngle channel EEG capture d in internat ional 10-20 electr ode placem ent montage. In spit e of the fact that C to E were captur ed intracra nia lly , A and B have been r eco rded as e xtra cra nial sign als. B. Stationary Wavelet Transform (SWT) The wave let coeffic ient s of SWT at all indi vidu al decom position l evel s impo rt the e qual sampl e num bers same as the origi nal signal. While DWT fail ed to face robustne ss and repea tabi lit y prob lem s, S WT sur vive d the obs tacles [ 19 ]. C. Feature Extrac tion based on Cross Frequenc y Coupling Hilbe rt transfo rm can indicat e instanta neous phas e and ampl itude as f oll ows: (M (n) i s a n ana lyt ic s ignal ) (1) Amirmasoud Ahmadi, Biomedical Engineerin g Department, School of Electrical Engineering, Iran University of Science and Technology, Tehran, Iran Mahsa Behroozi, Biomedical Engineerin g Department, School of Electrical Engineering, Iran University of Science and Technology Tehran, Iran Vahid Shalchyan, Biomedical Engineerin g Department, School of Electrical Engineering, Iran University of Science and Technology Tehran, Iran Mohammad Reza Daliri Biomedical Engineerin g Department School of Electrical Engineering, Iran University of Science and Technology Tehran, Iran Ampl it ude and instant aneou s phase of the signa ls are define d as: (2) (3) 1) Phase to Phase Coupling (P PC) Assum ing that each x( n) a nd y (n) s ignal s a re oscillat ing in dissim ilar wavele t coeffi cie nts, phase locki ng va lue could be estim ated if and sign als are T: R sync hroni zed. T=R=1 by reason of same reference s. PLV estim ation coul d be done as follows and this amount ca n osci llat e bet ween ze ro (no co upl ing) an d one ( absol ute coupli ng) [ 20 ]: (4) 2) Phase to Amplitude C oupling (PAC) At the time that Hilbert transfor m was done twic e phase of an ampl itud e is mea sure d to put to use in P my which is acce pted as P LV fo r PPC [ 21 ] . (5) 3) Amplitude to Amplitu de Coupling (AAC) Pears on correl ati on dissimi lar to af orem enti oned metho ds empl oys c orrel ati on to re pres ent c oupl ing be twe en +1 (absol ute coupl ing) to - 1 (no cou pli ng) a s fol lows: (6) D. Feature Selecti on 1) T-test With rega rd to an excelle nt featur e selec tion, for clas sific ation accel erati on in comput ati ons shoul d be done by expel ling valuel ess feature s and retai ning pro fit able on es. A stati stic al test , T-test , which opera tes based on arbit rat ing betwe en quantit ies to check crucial diverge nt means have been appli ed i n thi s re sear ch [ 22 ]. E. Quadratic and linear discriminant analysis LDA appl ies l inear hy per-pl anes i n t he cha ract er of dec ision surfac es to des igna te the inp ut vec tor to diff erent clas ses. The assum ption of L DA a s a clas sifi er i s tha t t he non-i dent ica l Gauss ian distr ibut ions are the basis of data generat ions in diffe rent clas ses. The training procedure can appro xim ate the param eters wi th t he fitting fu ncti on. T he train model looks for the class with the lowest miscl assif icati on cost presum ing ident ica lnes s of cova ria nce m atr ix (hom osce dast icity ) . Howeve r, QDA is connec ted to LDA covaria nce matric es are not assum ed to be the sam e and it form a quadrat ic decisi on bounda ry among cla sses [ 23 ]. III. R ESULTS AND D ISCUSSION In t his articl e a no vel approac h for classi fic ation of ictal signa ls base d on wave let have bee n sugg est ed. Fir s t, ‘db4’ mothe r wavele t SWT have bee n employ ed on all tri als. Then, Hilbe rt t rans form w er e em ploy ed on wavel et c oeffi cie nts so the phase a nd am plit ude of each w ave let coe ffic ient wa s calc ula ted, final ly PPC, PAC a nd AAC fe atur es we re ca lculate d. In t his res earc h 1 0-fol d c ross va lida ti on wa s used in order t o calc ulate the perfo rm ance . 90% of trials were random ly select ed as t rain data and the 10% res idua l we re de term ine d as the test data . The pr oce dure wa s repe ate d 10 t ime s and the aver age resul t was consider ed as the perf orm ance of system s. Extracted feat ures of trai n data have been ranked by t-te st and clas sific ation was perform ed by QDA. Optim al feature num bers were selecte d bas ed o n perf orm anc e (Fi g.2) . In all cas ed tri als were correct ly classif ied (Table I). Choosi ng wave let l evel s play s an impor tant role in feat ure extrac tion. In t his arti cle based on system perfo rma nce in diffe rent cases, 7 level s were experi m ente d (Tabl e II ). Fig. 1. Block diagram of proposed algorithm TABLE I. O BTAINED R ESULTS C LASSIFYING E PILEPSY P ATIENTS ’ EEG S IGNALS . Fig. 2. A ccura cy for differ ent n umber of fea tures TABLE II. O BTAINED R ESULTS OF D IFFERENT WAVELET DECOMPOSITION LEVELS Wavele t Dec ompo sition Level s 5 6 7 8 9 C ASES A VS E 100 100 100 100 100 B VS E 100 100 100 100 100 C VS E 99 99.5 100 100 100 D VS E 99 99 100 100 99.5 ABCD VS E 99.63 99.63 100 100 100 TABLE III. PROPOSED SYSTEM ’ S ACCURACY COMPARED WITH PREVIOUS SYSTEMS. Cases Metho d Accu racy D Vs E DWT ba sed fuz zy approx im ate entrop y + SVM [ 25] 96 Sim ple r andom sampl ing + Clus ter ing techn ique + LS -SVM [26] 93.6 Wavel et b ased CFC + QDA 100 ABCD Vs E Tunabl e-Q wave let trans form + K orsa kov entrop y + LS-S VM [27] 97.75 CFC + t-t est + Ra ndom Fores t [2 8] 99.87 Wavel et b ased CFC + QDA 100 Sele cte d optim al feature s have be en evalua te d from t wo aspec ts. Consi deri ng select ed feature s in each case belongs to which wavele t coeffic ient s and thei r partic ipat ion rati o Fig.3 is prese nted . PAC, PPC and AAC were the afore me ntion ed feat ures. A s an an other p oin t of vie w selecte d features w ere eval uate d in order to find th e most popular fea ture . Result s decl ared that PPC has t the highe st partic ipati on ratio among feat ures. In com parison w ith ot her sug gest ed wave let bas ed m et hods, this novel appr oach cl aim s a more signi fic ant perf orm ance, in all cases gaining 100 percent corre ct class ifica tion , tabulated in Tabl e I II . IV. C ONCLUSION In this rese arch a novel m ethod for clas sifi cati on of ictal EEG signals is sugges ted which has gained 100% corr ect clas sific ation perfor ma nce. The inn ovat ion in feat ure ext rac tion could com ple tely clar ify the differ ences bet wee n cla sses . R EFERENCES [1] F. Mormann, T. Kreuz, C. Rieke, R. G. Andrzejak, A. Kraskov, P. David , et al. , "On the p redictability of epileptic seizures," Clinical neurophysiology, vol. 116, pp. 56 9-587, 2005. [2] W. H. Organization, "http://www. who. int/mediacentre/factsheets/fs340/en," url> http://www. who. int/mediacentre/factsheets/fs241 /en/
Original Paper
Loading high-quality paper...
Comments & Academic Discussion
Loading comments...
Leave a Comment