In situ TensorView: In situ Visualization of Convolutional Neural Networks
Convolutional Neural Networks(CNNs) are complex systems. They are trained so they can adapt their internal connections to recognize images, texts and more. It is both interesting and helpful to visualize the dynamics within such deep artificial neural networks so that people can understand how these artificial networks are learning and making predictions. In the field of scientific simulations, visualization tools like Paraview have long been utilized to provide insights and understandings. We present in situ TensorView to visualize the training and functioning of CNNs as if they are systems of scientific simulations. In situ TensorView is a loosely coupled in situ visualization open framework that provides multiple viewers to help users to visualize and understand their networks. It leverages the capability of co-processing from Paraview to provide real-time visualization during training and predicting phases. This avoid heavy I/O overhead for visualizing large dynamic systems. Only a small number of lines of codes are injected in TensorFlow framework. The visualization can provide guidance to adjust the architecture of networks, or compress the pre-trained networks. We showcase visualizing the training of LeNet-5 and VGG16 using in situ TensorView.
💡 Research Summary
The paper introduces In situ TensorView, a novel framework that brings in‑situ scientific visualization techniques to the domain of deep convolutional neural networks (CNNs). By leveraging ParaView’s Catalyst co‑processing library, the authors embed a lightweight adaptor directly into the TensorFlow training loop, enabling real‑time streaming of both weight tensors and activation feature maps to a ParaView client without the need for expensive disk I/O. This loosely‑coupled design requires only a few lines of code insertion, preserving the original model’s performance while dramatically reducing the overhead associated with traditional post‑hoc visual analytics.
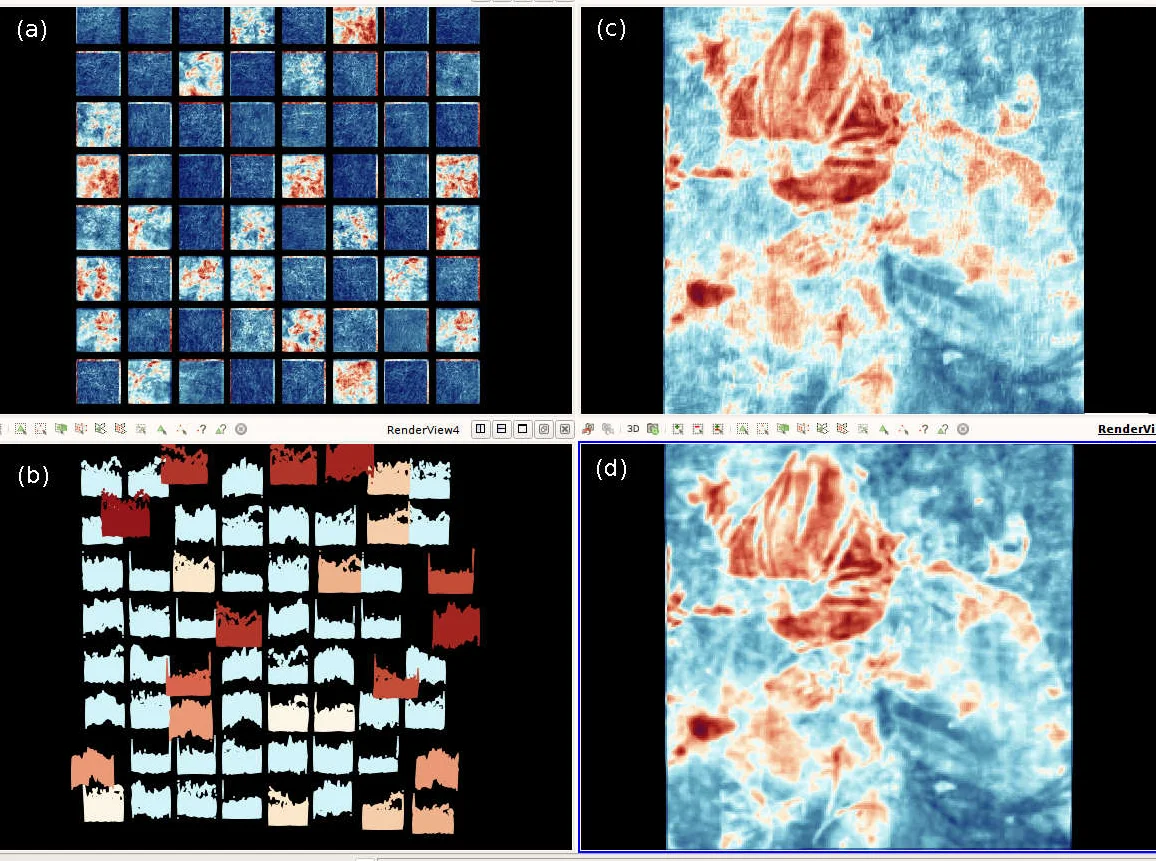
The framework provides four complementary viewers: (1) a Weight‑grid that renders each filter as a colored cell, encoding magnitude and sign; (2) a Trajectory view that projects the high‑dimensional parameter space onto a low‑dimensional manifold (PCA, t‑SNE, etc.) to expose the learning dynamics, including rapid early‑stage changes, plateau phases, and possible gradient‑vanishing or explosion events; (3) an Image‑grid that displays batches of activation maps as tiled images, allowing users to see how individual filters respond to whole datasets; and (4) a Distribution‑grid that visualizes activation histograms, highlighting similarity clusters, redundancy, and potential over‑fitting. Together, these visualizations give researchers immediate feedback on neuron contributions, filter redundancy, and the overall health of the training process.
Two case studies validate the approach. On the small LeNet‑5 network trained on MNIST, the system reveals early gradient instability, identifies filters that become static after a few epochs, and suggests pruning opportunities based on activation similarity. On the much larger VGG‑16 model trained on ImageNet (≈138 M parameters), the Catalyst pipeline streams less than 1 % of the total data volume, yet still supports interactive exploration of thousands of filters and millions of activation points. The Trajectory view clearly separates the high‑variance initial learning phase from the fine‑tuning phase, while the Weight‑grid uncovers layers where weights cease to evolve, prompting learning‑rate adjustments or layer reduction. Performance measurements show an added overhead of under 1 % of total training time for both models, confirming the scalability of the in‑situ approach.
The authors discuss limitations: the current implementation targets TensorFlow 1.x, so extending to TensorFlow 2.x, PyTorch, or other frameworks will require additional adaptor development. Moreover, the visualizations are primarily designed for 2‑D image data, leaving text, time‑series, or graph‑structured inputs for future work. Potential extensions include automatic importance scoring of filters, integration of quantitative metrics (e.g., mutual information, saliency), and support for non‑image modalities.
In summary, In situ TensorView demonstrates that importing mature scientific visualization pipelines into deep learning can provide real‑time, low‑overhead insights into the internal dynamics of CNNs, facilitating model debugging, hyper‑parameter tuning, and network compression. This bridges a gap between the deep learning community and high‑performance visualization tools, opening new avenues for interactive, data‑driven model development.
Comments & Academic Discussion
Loading comments...
Leave a Comment