SONYC: A System for the Monitoring, Analysis and Mitigation of Urban Noise Pollution
We present the Sounds of New York City (SONYC) project, a smart cities initiative focused on developing a cyber-physical system for the monitoring, analysis and mitigation of urban noise pollution. Noise pollution is one of the topmost quality of lif…
Authors: Juan Pablo Bello, Claudio Silva, Oded Nov
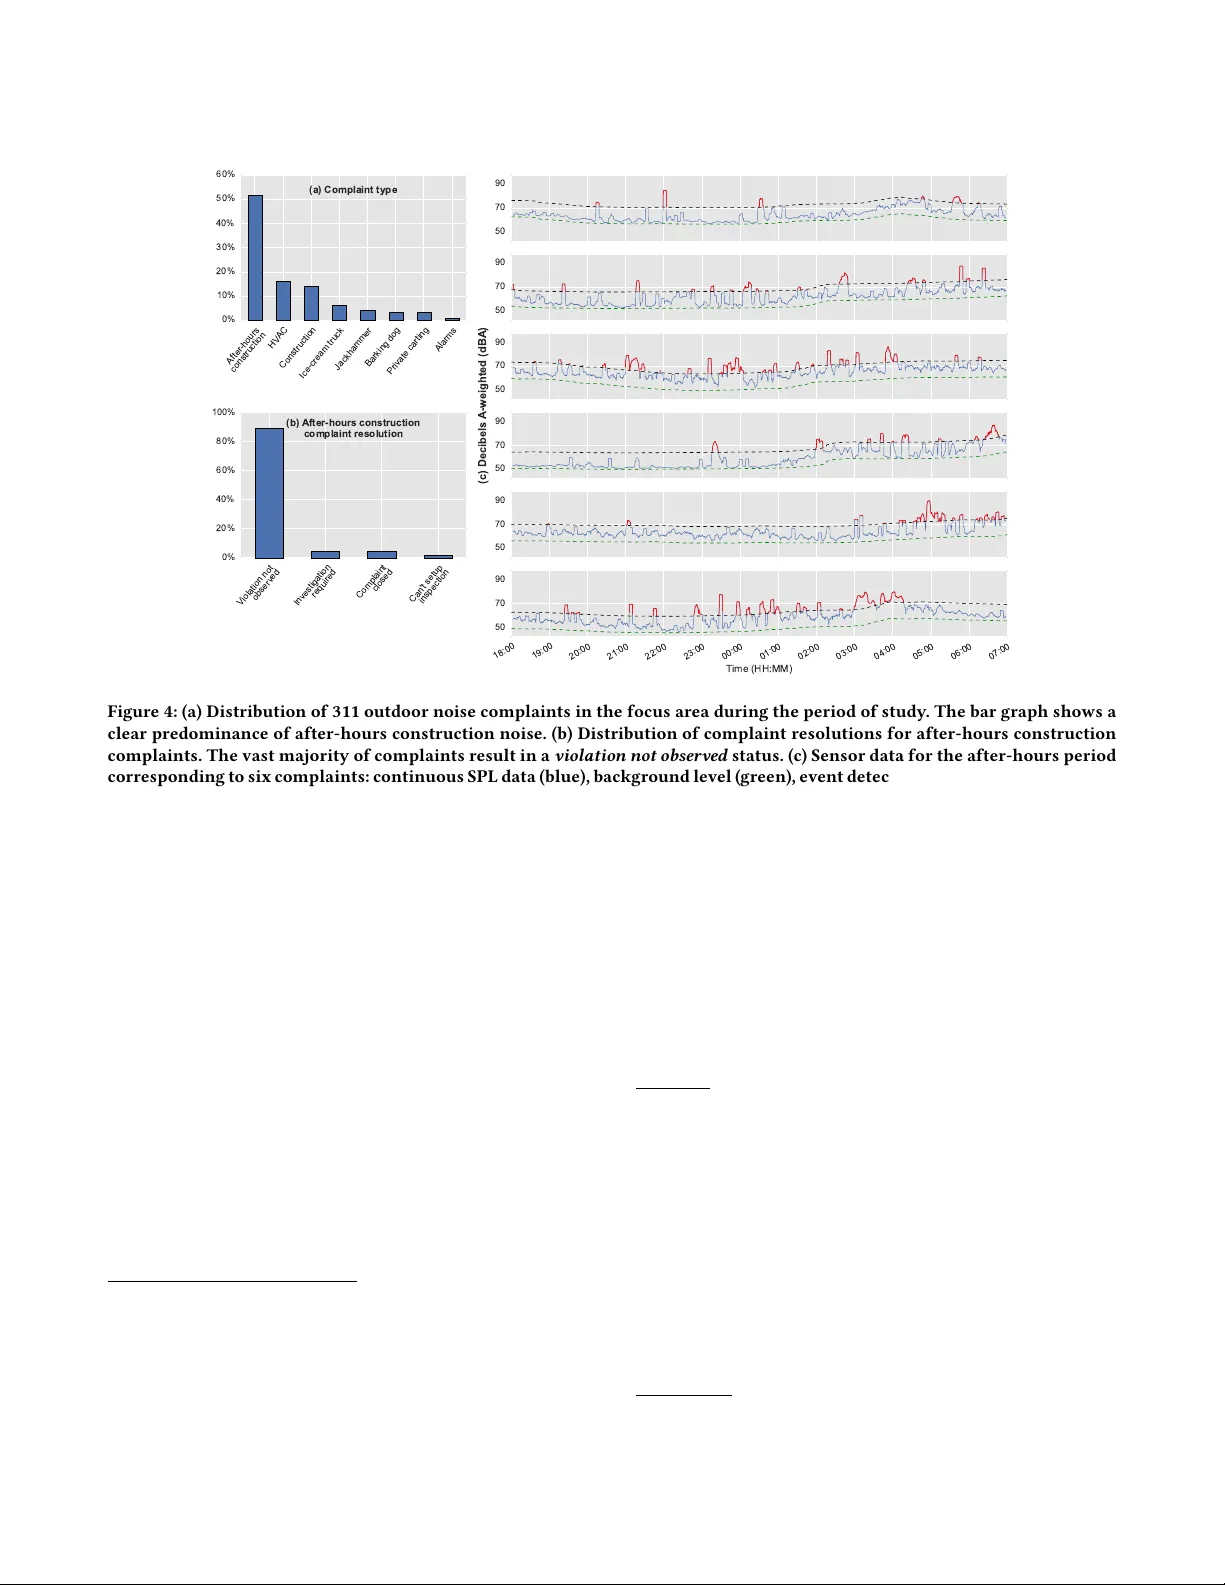
SON Y C: A System for the Monitoring, Analysis and Mitigation of Urban Noise Pollution Juan P . Bello New Y ork University New Y ork, NY 10012 jpbello@nyu.edu Claudio Silva New Y ork University New Y ork, NY 10012 csilva@nyu.edu Oded Nov New Y ork University New Y ork, NY 10012 onov@nyu.edu R. Luke DuBois New Y ork University New Y ork, NY 10012 dubois@nyu.edu Anish Arora Ohio State University Columbus, OH 43210 arora.9@osu.edu Justin Salamon New Y ork University New Y ork, NY 10012 justin.salamon@nyu.edu Charles Mydlarz New Y ork University New Y ork, NY 10012 cmydlarz@nyu.edu Harish Doraiswamy New Y ork University New Y ork, NY 10012 harishd@nyu.edu CCS CONCEPTS • Human-centered computing → Collaborative and social computing ; Geographic visualization ; • Computing method- ologies → Articial intelligence ; • Computer systems orga- nization → Sensor networks ; • Hardware → Digital signal processing ; Sensor devices and platforms ; Sound-based in- put / output ; KEY W ORDS noise pollution, sensor netw orks, machine listening, citizen science, visualization, smart cities, cyber-physical systems A CM Reference format: Juan P. Bello, Claudio Silva, Oded Nov, R. Luke DuBois, Anish Ar ora, Justin Salamon, Charles Mydlarz, and Harish Doraiswamy . 2018. SON Y C: A System for the Monitoring, Analysis and Mitigation of Urban Noise Pollution. In Proceedings of Communications of the ACM, New Y ork, N Y , USA, May 2018, 8 pages. https://doi.org/10.475/123_4 1 NOISE POLLU TION Noise refers to unwanted or harmful sound from envir onmental sources such as trac, construction, industrial and so cial activities. Noise pollution is one of the topmost quality of life issues for urban residents in the United States, with ov er 70 million people across the country exposed to noise lev els beyond the limit of what the EP A considers to be harmful [13]. Permission to make digital or hard copies of all or part of this work for personal or classroom use is granted without fee provided that copies are not made or distribute d for prot or commercial advantage and that copies bear this notice and the full citation on the rst page. Copyrights for components of this work owned by others than ACM must be honored. Abstracting with cr edit is permitted. T o copy otherwise, or republish, to post on servers or to redistribute to lists, r equires prior specic permission and /or a fee. Request permissions from permissions@acm.org. Communications of the ACM, May 2018, New Y ork, N Y , USA © 2018 Association for Computing Machinery . ACM ISBN 123-4567-24-567/08/06. . . $15.00 https://doi.org/10.475/123_4 Such levels of exposure have prov en eects on health, including acute eects such as sleep disruption, and long-term eects such as hypertension, heart disease and hearing loss [ 5 , 12 , 13 ]. In addition, there is evidence of impact on educational p erformance, with stud- ies showing that noise pollution pr oduces learning and cognitive impairment in children, resulting in decreased memor y , reading skills and lower test scores [2, 5]. The economic impact of noise is also signicant. The WHO estimates that, in W estern Europe alone, 1 million healthy life-years are lost annually to environmental noise [ 12 ]. Other estimates put the external cost of noise-related health issues in the EU between 0.3-0.4% of GDP [ 15 ], 0.2% in Japan [ 17 ]. Studies in the US and Europe also demonstrate the relationship between environmental noise and real state markets, with housing prices falling as much as 2% per decibel (dB) of noise increase [20, 30]. In short, noise pollution is not merely an annoyance but an im- portant problem with broad-ranging societal eects that apply , to a varying extent, to a signicant portion of the population. Therefor e, it is clear that ee ctive noise mitigation is in the public interest, with proven health, economic, and quality-of-life impact. 2 THE CHALLENGE OF NOISE MI TIGA TION Noise can be mitigate d at the receiver’s end, e.g. by wearing ear plugs, or along the transmission path, e.g. by erecting sound bar- riers around major roads. These strategies do not reduce noise emissions, and place the burden of mitigation on the receiver [ 13 ]. Alternatively , we can mitigate noise at the source, e .g. by designing aircrafts with quieter engines, acoustically treating clubs, using mued jackhammers in roadworks, or stopping unnecessary honk- ing. Such actions are commonly incentivized with a regulatory framework that uses nes and other penalties to raise the cost of emitting noise [ 29 ]. However , enforcing noise codes in large urban areas, to the point where they eectively deter noise emissions, is far from trivial. T ake NYC as an example. Beyond occasional physical inspections, the city monitors noise via its 311 service for civil complaints. Since 2010, 311 has logged more than 2.3 million noise-related complaints, Communications of the ACM, May 2018, New Y ork, N Y , USA J.P. Bello et al. signicantly more than for any other issue 1 . This averages about 834 complaints a day , the largest citizen noise reporting system anywhere in the world. How ever , research by NY C’s Department of Health and Mental Hygiene (DOHMH) shows that 311 data does not accurately capture information about all noise exposure in the city [ 21 ]. Their study shows the top sources of disruptiv e noise to be trac, sir ens and construction; the eect to be similar in the boroughs of Manhattan, Brooklyn and the Bronx; and low-income and unemployed New Y orkers amongst those most fr equently ex- posed. In contrast, 311 noise complaint data colle cted for the same period prioritizes so cial noise such as parties, car alarms, loud talk- ing, music and TV , with a minority of complaints citing trac or construction. Notably , residents of Manhattan, where most auent New Y orkers live, are more than twice as likely to le 311 com- plaints than those in other boroughs. This clearly highlights the need for collecting obje ctive measur ements of noise across the city , alongside citizen reporting, to fully characterize the phenomenon. A closely related issue concerns ho w to eectively respond to po- tential violations of the noise code. In N Y C, the subset of noise com- plaints pertaining to static, systemic sources such as construction, animals, trac, air conditioning and ventilation units, are routed to the Department of Environmental Protection (DEP). The DEP employs about 50 highly-qualied inspectors to measure sound lev- els and issue a notice of violation whene ver needed. Unfortunately , the limited human resources and the high volume of complaints result in average response times of more than 5 days. Given the transient nature of sound, a v ery small proportion of inspections actually result in a violation observed, let alone penalized. T o make matters worse, even when noise sources are active dur- ing inspections, it is hard to isolate their eect. Noise is commonly measured in overall sound pressure levels (SPL) expressed in A - weighted decibels ( dBA) [ 29 ], which aggregate all sound energy in an acoustic scene. Thus, existing technologies cannot isolate the eect of oending sources, especially in urban envir onments featuring a large number of sounds. A s a result, inspectors have to resort to long and complicated measurement strategies that often require help from the pe ople responsible for the violation in the rst place – an additional factor contributing to the diculty and reduced eciency of the enforcement process. In this paper we outline the opportunities and challenges as- sociated with SONYC, a cyb er-physical systems appr oach to the monitoring, analysis and mitigation of urban noise pollution. This initiative connects multiple sub-elds of computing including wire- less sensor networks, machine learning, collaborative and social computing and computer graphics, to create a potentially transfor- mative solution to this important quality-of-life issue. T o illustrate this potential, we present ndings from an initial study showing how SONYC can help understand and address important gaps in the process of urban noise mitigation. 3 SON Y C There hav e been multiple attempts to inject technological solutions to improve the cycle of urban noise pollution. For example , various initiatives have used mobile devices to crow dsource instantaneous SPL measurements, noise labels and subjective responses [ 3 , 23 , 1 http://www1.nyc.gov/311 27 ], but they lag well behind the coverage in space-time of civic complaint systems such as 311, while the reliability of their objective measurements suers from lack of adequate calibration. Others have deployed static sensing solutions that are often too costly to scale up and fail to go beyond the capabilities of standar d noise meters [ 4 , 22 , 28 ]. On the analytical side, there has be en a signicant amount of work on noise maps generated from sound propagation models for major urban noise sources such as industry , road, rail and air trac [ 6 , 14 ]. How ever , these maps lack temporal dynamics and make modeling assumptions that often render them to o inaccurate to supp ort mitigation or action planning [ 1 ]. V er y few of these initiatives have inv olved acting upon the sensed or modeled data to ae ct noise emissions, and even fewer have counted with the participation of local governments [16]. SONYC (Sounds of New Y ork City), the novel solution depicted in Fig. 1, aims to address these limitations via an integrated cyb er- physical systems’ approach to noise pollution. First, it proposes a low-cost, intelligent sensing platform capable of continuous, real-time, accurate and source-specic noise moni- toring. Our sensing solution is scalable in terms of coverage and power consumption, does not suer fr om the same biases as 311- style reporting, and goes well beyond SPL-based measurements of the acoustic environment. Second, SONYC adds new layers of cutting-edge data science methods for large-scale noise analysis . These include predictive noise modeling in o-network lo cations using spatial statistics and physical modeling, the development of interactiv e 3D visualizations of noise activity across time and space to enable a better under- standing of noise patterns, and novel information retrieval to ols that e xploit the topology of noise events to facilitate search and discovery . Third, this sensing and analysis framework is used to impro ve mitigation in two ways: rst, by enabling optimized, data-driven planning and scheduling of inspections by the local government, thus improving the likelihood that co de violations will be detecte d and enforced; and second, by increasing the ow of information to those in a position to control emissions – e.g. building and construction-site managers, driv ers, neighbors – thus providing credible incentives for self-regulation. Be cause the system con- stantly monitors and analyzes noise pollution, it generates infor- mation that can be used to validate, and iteratively rene any noise mitigating strategy . T ake for example a scenario in which the system integrates information from the sensor network and 311 to identify a pattern of after-hours jackhammer activity around a construction site . This information triggers targeted inspections by the DEP which results in the issuing of a violation. Through statistical analysis we can then validate whether the action is short-lived in time, or whether its eect propagates to neighboring construction sites or distant ones by the same company . By systematically monitoring interventions, we can understand how often penalties ne ed to be imparted before the ee ct be comes long-term. The overarching goal is to understand how to minimize the cost of interventions while maximizing noise mitigation, a classic resource allocation problem that motivates much research on smart-cities initiatives. SONYC: A System for the Monitoring, Analysis and Mitigation of Urban Noise Pollution Communications of the ACM, May 2018, New Y ork, N Y , USA SENSING Empower Citizens A N A L Y S IS ' ANAL YSIS MIT IG A T IO N ' ACTUA TION Empower Researc h Figure 1: The SONYC cyber-physical system loop including intelligent sensing, noise analysis at city-scale and data-driven mitigation. SONYC empowers new resear ch in the social sciences and public health, while empowering citizens to impro ve their communities. All of this is made possible by formulating our solution in terms of a cyber-physical system (CPS). However , unlike most CPS work in the literature, the distribute d and decentralized nature of the problem requires the leveraging of multiple socio-economic incen- tives – e.g. nes or peer comparisons – to exercise indirect control on tens of thousands of sub-systems contributing noise emissions. It also calls for the dev elopment and implementation of a set of nov el mechanisms for integrating humans in the CPS loop at scale and at multiple levels of the system’s management hierarchy , including the extensive use of human-computer interaction (HCI) resear ch in, e.g., citizen science and data visualization, to facilitate seamless interactions between humans and cyb er-infrastructure . It is worth emphasizing that this line of work is fundamentally dierent from current research on human-in-the-loop CPS, which is often focused on applications where control is centralized and fully or mostly automated, while there is usually a single human involved – e .g. in assistive robots and intelligent pr osthetics. W e believe that the synthesis of approaches from social computing, citizen science and data science to advance the integration, management and control of large and variable numbers of human agents in CPS is potentially transformative, addressing a crucial bottleneck for the widespread adoption of similar methods in socio-technical systems such as transportation networks, power grids, smart buildings, environ- mental control and smart cities. Finally , SON Y C uses N Y C, the largest, densest, noisiest city in North America, as its experimental ground. The city has long been at the forefront of discussions about noise pollution, has an exem- plary noise code 2 and, in 311, the largest citizen noise reporting system. Beyond noise, N Y C collects large amounts of data about everything from public safety , trac, taxi activity , and construction, 2 http://www.ny c.gov/html/dep/html/noise/index.shtml and makes much of that information open 3 . Our work involves close collaboration with city agencies such as the Department of Environmental Pr otection (DEP), the Department of Health and Mental Hygiene (DOHMH), various business improvement districts (BIDs), and private initiatives, such as LinkN Y C, that provide access to existing infrastructure. Thus, as a powerful sensing and anal- ysis infrastructur e, SONY C holds the potential to empower new research in environmental psy chology , public health and public policy , as well as empower citizens seeking to improv e their own communities. In the following sections we describe the technology and meth- ods underpinning the project, present some of our early ndings, and discuss future challenges. 4 A COUSTIC SENSOR NETWORK As discussed earlier , SONYC’s intelligent sensing platform should be scalable and capable of sour ce identication and high-quality , 24/7 noise monitoring. T o that end we have developed an acoustic sensor [ 18 ] – shown in Figure 2 – based on the popular Raspb erry Pi single-board com- puter (SBC) outtted with a custom microelectromechanical sys- tems (MEMS) microphone module. MEMS microphones are chosen for their low cost, consistency across units and size , which can be 10x smaller than traditional microphones. Our custom, standalone microphone module includes additional circuitry such as in-house ADC and pre-amps stages, as well as an on-board micro-controller which enables pre-processing of the incoming audio signal to com- pensate for the microphone ’s frequency response. The digital MEMS microphone features a wide dynamic range of 32-120 dBA, ensuring 3 https://nycopendata.socrata.com Communications of the ACM, May 2018, New Y ork, N Y , USA J.P. Bello et al. Figure 2: Acoustic sensing unit deployed on a New Y ork City street. all urban sound pressure le vels can be eectively monitored. It was calibrated using a precision grade sound-lev el meter as refer ence under low-noise, anechoic conditions, and was empirically shown to pr oduce sound pressure le vel data at an accuracy compliant with the ANSI T ype-2 standard [ 29 ] that is required by most local and national noise codes. The sensor’s computing core is housed within an aluminum casing chosen to reduce RFI interference and solar heat gain. The microphone module is mounte d e xternally via a repositionable metal goose-neck allowing the sensor node to b e recongured for deployment in varying locations such as building sides, light poles and building ledges. Apart from continuous SPL measurements, the nodes will b e sampling 10-se cond audio snippets at random intervals during a limited perio d of time. This is to collect data to train and benchmark our machine listening solutions. The audio is compressed using the lossless FLA C encoder , and encrypted using 4096 bit AES encr yption and the RSA public/private key-pair encryption algorithm. Sensor nodes communicate with the server via a Virtual Private Network (VPN), uploading audio and SPL data at 1 minute intervals. At the time of writing, the cost in parts of each sensor is around US$80 using mostly o-the-shelf components. W e fully expect the unit cost to be signicantly reduce d via custom redesigns for high- volume, thir d-party assembly . However , ev en at the current price tag, SON Y C sensors are signicantly more aordable, and thus amenable to large-scale deployment, than existing noise monitor- ing solutions. Furthermore, this increase in aordability does not come at the expense of measurement accuracy , with our sensors performing comparably to high-quality devices that are orders of magnitude more costly , while outperforming solutions in the same price range. Finally , the addition of a powerful and dedicated com- puting core, opens the possibility for edge computing, particularly for in-situ machine listening intended to automatically and robustly identify the presence of common sound sources. This is a unique feature of SON Y C that is well beyond the capabilities of existing noise monitoring solutions. 5 MA CHINE LISTENING ON THE EDGE Machine listening is the auditory counterpart to computer vision, combining techniques from signal processing and machine learning to de velop systems able to extract meaningful information from sounds. In the context of SON Y C, we are focused on developing computational methods to detect specic types of sound sources, such as jackhammers, idling engines, car horns, or police sirens, automatically from environmental audio. This is a challenging prob- lem given the complexity and diversity of sources, auditory scenes and background conditions that can be found in urban acoustic environments. T o addr ess these challenges we have contributed an urban sound taxonomy , annotated datasets, and various cutting-edge methods for urban sound source identication [ 24 , 25 ]. Our research shows that feature learning, even using simple dictionary-based methods such as spherical k-means, makes for signicant improvement in performance upon the traditional approach of feature engineer- ing. Imp ortantly , w e have found that temporal shift invariance, whether using modulation spectra or de ep convolutional networks, is crucial not only for overall higher accuracy , but also to increase robustness in low signal-to-noise (SNR) conditions, as is the case when sources of interest are in the backgr ound of acoustic scenes. Shift invariance also results in more compact machines that can be trained with less data, thus adding value for edge computing. More recent results highlight the benets of using convolutional- recurrent architectures, as well as ensembles of various models via late fusion. Deep learning models necessitate high volumes of lab eled data, which have been traditionally unavailable for environmental sound. SONYC: A System for the Monitoring, Analysis and Mitigation of Urban Noise Pollution Communications of the ACM, May 2018, New Y ork, N Y , USA T o alleviate this, we hav e developed an audio data augmentation framework, that systematically deforms the data using w ell-known audio transformations such as time stretching, pitch shifting, dy- namic range compression and the addition of background noise at dierent SNRs, signicantly increasing the amount of data avail- able for model training. W e have additionally developed an open- source tool for soundscape synthesis [ 26 ]. Given a collection of isolated sound events, this tool acts as a high-level sequencer that can generate multiple soundscapes from a single, probabilistically dened, “specication” . W e have utilized this method to generate large datasets of perfectly annotated data in order to assess algo- rithmic p erformance as a function of, e.g., maximum polyphony and SNR ratio, studies that would be prohibitive at this scale and precision using manually-annotated data. The combination of an augmented training set and the increased capacity and representational power of deep learning models results in state-of-the-art performance. Our curr ent models can perform robust 10-class, multi-label classication in real-time, running on a laptop machine, and will soon be adapted to run under the compu- tational constraints of the Raspberry Pi. Howev er , despite the advantages of data augmentation and syn- thesis, the lack of signicant amounts of annotated data for super- vised learning r emain the main bottleneck. T o address this need, we dev eloped a framework for web-based human audio annotation, and conducted a large-scale, experimental study on how visual- ization aids and acoustic conditions aect the annotation process and efectiveness [ 7 ]. In this work, we aimed to quantify the relia- bility/redundancy trade-o in cr owdsourced soundscape annota- tion, investigate how visualizations aect accuracy and eciency , and characterize how performance varies as a function of audio characteristics. Our study followed a between-subjects factorial experimental design in which we tested 18 dierent experimental with 540 participants recruited via Amazon’s Mechanical Turk. W e found that more complex audio scenes result in low er anno- tator agreement, and that spectrogram visualizations are superior in producing higher quality annotations at lower cost of time and human labor . Given enough time, all tested visualization aids enable annotators to identify sound e vents with similar recall, but the spe c- trogram visualization enables annotators to identify sounds more quickly . W e speculate that this may be because annotators ar e able to more easily identify visual patterns in the spe ctrogram, which in turn enables them to identify sound e vents and their boundaries in time more precisely and eciently . W e also see that participants learn how to use each interface more eectively over time, sug- gesting that we can expect higher quality annotations with even a small amount of additional training. Crucially , we found that the value of additional annotators de- creased after 5-10 annotators and that 16 annotators captured 90% of the gain in annotation quality . Howev er , when resources are lim- ited and cost is a concern, our ndings suggest that ve annotators may be a reasonable choice for reliable annotation with respect to the trade-o between cost and quality . These ndings are valu- able for the design of audio annotation interfaces, and the use of crowdsour cing and citizen science strategies for audio annotation at scale. 6 NOISE ANAL Y TICS One of the main promises of SON Y C is the ability to analyze and understand noise pollution at city-scale in an interactive and e- cient manner . At the time of writing, w e have already deployed 45 sensors, primarily in the Greenwich Village neighborho od of NYC, but also in other locations in Manhattan and Brooklyn. Collectively , these sensors have gather ed the equivalent of 8 years of audio data, more than twice that in sound pressure le vels and telemetry . These numbers give a clear indication of the magnitude of the problem from a data analytics perspective. Therefore we ar e developing a exible and powerful visual ana- lytics framework that can enable the visualization of noise lev els in the context of the city together with other related urban data streams. W orking with urban data poses new resear ch challenges. Although there has been much work on scaling databases for big data, existing technologies do not meet the requirements nee ded to interactively explore massive or even reasonably-sized data sets [ 9 ]. Accomplishing interactivity not only requires ecient techniques for data and query management, it also raises the need for scalable visualization techniques capable of rendering large amount of in- formation. In addition, visualizations and interfaces must be easily understood by both domain experts and non-expert users, including crowdsour cing workers and volunteers, and bear meaningful rela- tionship to the properties of the data in the physical world, which in the case of sound implies the need for 3-dimensional visualization. Our team has been working on a 3D , urban GIS framework called Urbane [ 10 ], see Figure 3. Urbane is an interactiv e tool, including a nov el 3D map layer , that has been dev eloped from the ground up by the project’s data science team to take advantage of the GP U capabilities of modern computing systems. It allows for fast, potentially real-time computations, as well as the integration and visualization of multiple data streams commonly found for major cities such as NYC. In the context of SON Y C, we have e xpanded Urbane’s capabilities to include the ecient management of high- resolution, temporal data. This is achieved via a novel data structure , called the time lattice , which allows for fast retrieval, visualization and analysis of individual and aggr egate sensor data at multiple time scales such as hours, days, weeks, and months. An example of data retrieved using this capability can be se en on the right plot in Figure 3. Urbane and the time lattice, have been used to support the preliminary noise analysis in Section 7, but their applicability goes well beyond audio. W e are currently expanding Urbane to support visual spatio- temporal queries over noise data, including the use of computational topology methods for pattern detection and retrieval. Similar tools have already pro ved useful in smart cities situations, such as prior collaborations between team memb ers, the NYC Department of Transportation and the T axi and Limousine Commission [8, 11]. 7 MAKING THE CASE FOR D A T A -DRIVEN MI TIGA TION W e conducted a preliminary study on the validity and response of noise complaints around the W ashington Square area of N Y C using SONYC’s current sensing and analytics infrastructure [ 19 ]. The study combines information mined from the log of civic complaints made to the city over the last year via its 311 system, the analysis Communications of the ACM, May 2018, New Y ork, N Y , USA J.P. Bello et al. Figure 3: (left) An interactive 3D visualization of a N Y C neighborhoo d using Urbane . By sele cting specic sensors (red pins) and buildings (purple) we can easily and eciently r etrieve and visualize multiple data streams associate d with those locations. (right) SPL data at various resolutions and time scales retrieved using the time laice . All gures show individual (gray) and aggregated (red) sensor data, for the 3 sensor units highlighte d on the left plot. of a subset of our own sensor data during the same perio d, and information gathered via interactions and site visits with inspe ctors from NYC’s Department of Environmental Protection (DEP) tasked with enforcing the noise code. For our study we chose an ar ea with a relatively dense deploy- ment of 17 nodes. W e established a 100 m boundar y ar ound each node and merged to form the focus area. From 311, we collected all non-duplicate noise complaints occurring within this area that were routed to the DEP while neighboring sensors were active. Note that this criterion discards, for example , complaints about noise from neighbors, which are routed to the police department, and tend to dominate the 311 log. The breakdown of selected complaint types can be observed in Figure 4(a). Over an 11-month period, 51% of all noise complaints in the focus area were related to after-hours construction activity ( between 6PM–7AM), 3 times the amount of the next category . Note that combining all construction-related complaints adds up to 70% of this sample, highlighting the importance of this issue. Figure 4(c) shows SPL values (blue line), at a 5-minute resolution, for the after-hours period during or immediately pr eceding a subset of the complaints. Dotted green lines correspond to background lev- els, computed as the moving average of SPL measurements within a 2-hour window . Dotted black lines correspond to SPL values 10dB above the background, the threshold dened by the city’s noise code to indicate potential violations. Finally , we can detect events (marked in red), where instantaneous SPL measurements are above the threshold. Our analysis resulted in the dete ction of 324 such events. W e classied those by noise source, and determine d that 76% (246) were related to construction as follows: jackhammering (223), compressor engine (16) and metallic banging/scraping (7); with the remainder corresponding to non-construction sources, predominantly sirens and other trac noise . Our analysis shows that for 94% of all after-hours construction complaints, we can nd quantitative evidence in our sensor data of a potential violation. How does this evidence stack against the enforcement record for those complaints? Citizen complaints submitte d via 311 and routed to the DEP trigger an insp ection, with the city open data including information about how each complaint is r esolved. For all complaints in this study , 78% resulted in a “No violation could be observed” status, and only 2% in a violation ticket b eing issued. Fig- ure 4(b) shows that in the specic case of after-hours construction noise, no violation could be observed in 89% of all cases, and none of the inspections resulted in a violation ticket being issue d. There are multiple explanations for the signicant gap between the evidence collected by the sensor network and the results of the inspections. For example, we can spe culate that the mismatch is partly due to the delay in the city’s response to complaints, 4-5 days in average, which is too high for phenomena that are both tran- sient and trace-less. Another factor is the conspicuousness of the inspection crew , which in itself modies the behavior of potentially oending sources, as we observed during site visits with the DEP . Moreover , under some circumstances the city gov ernment grants special, after-hours construction permits under the assumption of minimal noise impact as dened by the noise code. Thus, it is possi- ble that some of this after-hours activity results from those permits. Unfortunately after-hours construction permit data is not readily available, and we are curr ently exploring alternative mechanisms for its collection. In all cases, we argue that the SON Y C sensing and analytical framework can address the shortcomings of current monitoring and enforcement mechanisms by providing hard data to: ( a) quan- tify the actual impact of after-hours construction permits on the acoustic environment ( and thus the city inhabitants); (b) pr ovide historical data that can validate complaints and thus support in- spection eorts in an inconspicuous and continuous basis; and (c) SONYC: A System for the Monitoring, Analysis and Mitigation of Urban Noise Pollution Communications of the ACM, May 2018, New Y ork, N Y , USA After-hours construction HV AC Construction Ice-cream truck Jackhammer Barking dog Private carting Alarms (a) C omplaint type 0% 10% 20% 30% 40% 50% 60% V iolation not observed Investigation required Complaint closed Can't s etup inspection (b) A fter-hours construction complaint r esolution 0% 20% 40% 60% 80% 100% 50 70 90 50 70 90 50 70 90 50 70 90 50 70 90 18:00 19:00 20:00 21:00 22:00 23:00 00:00 01:00 02:00 03:00 04:00 05:00 06:00 07:00 T i me (HH:MM) 50 70 90 (c) D ecibels A-weighted (dBA) Figure 4: (a) Distribution of 311 outdoor noise complaints in the focus area during the p eriod of study . The bar graph shows a clear predominance of after-hours construction noise. ( b) Distribution of complaint resolutions for after-hours construction complaints. The vast majority of complaints result in a violation not observed status. (c) Sensor data for the after-hours perio d corresponding to six complaints: continuous SPL data (blue), background level (green), event dete ction threshold at 10dB above background level ( black), potential noise code violation events (red). develop novel, data-driven strategies for the ecient allocation of inspection crews in space and time using the same to ols from operations research that optimize routes for delivery trucks and taxis. It is worth noting that, even though our preliminary study focused on validating 311 complaints, SON Y C can b e used to gain insight beyond the complaint data, allowing us to understand the extent and typ e of unreported noise events, to identify biases in complaint behavior , and to accurately measure the level of noise pollution in the environment. 8 LOOKING FORW ARD The SON Y C project has just completed the rst of ve years of its research and development agenda. The current focus of the project is squarely on the development and deployment of the intelligent sensing infrastructure, but as the work progresses that focus will progressively shift to wards analytics and mitigation, in collaboration with city agencies and other stakeholders. Here are some areas of future work. Low-power mesh sensor network: to support deployment of sen- sors at signicant distances from Wi-Fi or other communication infrastructure and at locations lacking easy access to wired power , we are de veloping a second generation of the sensor node that is mesh enabled and batter y/solar powered. Each sensor node will it- self serve as a router in a low-power multi-hop wireless network in the 915MHz band, using FCC-compatible cognitive radio techniques over relativ ely long links and energy-ecient multi-channel rout- ing for communicating to and from infrastructure-connected base stations. Our sensor design will further reduce power consumption for the multi-label noise classication, by leveraging heterogeneous processors for duty-cycled/event-driven hierarchical computing. Specically , our sensor node is based on a low power System-on- Chip, the Ineda i7 4 , for which we are redesigning “mote-scale ” com- putation techniques originally developed for single micro-controller devices to now support heterogeneous processor-specic operating systems via hardware virtualization. Modeling: the combination of noise data collected by sensors and citizens will b e necessarily sparse in space and time. In order to perform meaningful analyses and help inform decisions by city agencies, it is essential to compensate for this sparseness. Se veral open data sets are available that could, either directly or indirectly , provide information on the noise levels in the city: the locations of restaurants, night clubs and tourist hot spots indicate areas where social noise sources are likely , while so cial media data streams can be used to understand the temporal dynamics of crow d behavior . Likewise, multiple data streams about, e.g., taxi, buses and air crafts, can provide indir ect information on trac-based noise levels. W e plan to develop noise models that use spatio-temporal covariance to predict unseen acoustic r esponses using a combination of sensor and open data. W e will also explore combinations of this data-driven 4 http://inedasystems.com/wearables.php Communications of the ACM, May 2018, New Y ork, N Y , USA J.P. Bello et al. modeling, with physical models that exploit the 3D geometr y of the city , sound type and localization cues from sensors and 311, and basic sound propagation principles. W e expect that through a com- bination of techniques from data mining, statistics, and acoustics, as well as our signicant expertise in developing models suitable for GP U implementation using ray casting queries in the context of computer graphics, we can pioneer the generation of accurate, dynamic and 3D urban noise maps in real time. Citizen Science and civic participation: the role of humans in SON Y C is not limited to annotating sound. In addition to the xed sensors located in various parts of New Y ork City , a SON Y C mobile platform is expected to enable citizens to recor d and annotate sounds in situ, view existing data contributed and analyze d by others, and contact authorities about noise-related concerns. A mobile platform will allow users to leverage slices taken from this rich set of data to describe their concerns, and support them with evidence, as the y approach city authorities, regulators, and policy makers. Citizens will not only be more informed and more engaged with their en- vironment, but also better equipp ed in voicing their concerns in eective ways as they interact with authorities. SONYC is a smart cities, next-generation application of cyber- physical systems. Its development calls for innovation in various elds of computing and engine ering, including sensor networks, machine learning, human-computer interaction, citizen science and data science. Furthermore , our technology can support novel scholarly work on noise p ollution in public health, public p olicy , environmental psychology and economics. But the project is far from a purely scholarly endeavor . By seeking to improve urban noise mitigation, a critical quality-of-life issue, SONY C has direct potential to benet urban citizens around the w orld. Our agenda calls for SON Y C to be deployed, tested and used in real-world conditions, the outcome potentially a mo del that can be scaled and replicated across the US and beyond. A CKNO WLEDGMEN TS This work is partially supported by the National Science Foundation (A ward # 1544753), N YU’s Center for Urban Science and Progress, NY U T andon School of Engineering, and the Translational Data Analytics Institute at OSU. REFERENCES [1] M A usejo, M Recuero, C A sensio, I Pavón, and R Pagán. 2010. Study of uncertainty in noise mapping. In Proceedings of 39th International Congress on Noise Control Engineering, Internoise (2010, Lisbon, Portugal) . 6210–6219. [2] Mathias Basner , W olfgang Babisch, Adrian Davis, Mark Brink, Charlotte Clark, Sabine Janssen, and Stephen Stansfeld. 2014. Auditory and non-auditory eects of noise on health. The Lancet 383, 9925 (2014), 1325–1332. [3] Martin Becker , Saverio Caminiti, Donato Fiorella, Louise Francis, Pietro Gravino, Mordechai Muki Haklay , Andreas Hotho, Vittorio Loreto, Juergen Mueller , Fer- dinando Ricchiuti, et al . 2013. Awar eness and learning in participatory noise sensing. PloS one 8, 12 (2013), e81638. [4] Margaret Carol Bell and Fabio Galatioto. 2013. Novel wireless pervasive sensor network to improve the understanding of noise in street canyons. A pplied Acoustics 74, 1 (2013), 169–180. [5] Arline Bronzaft. 2007. Neighb orhood Noise and Its Consequences. (2007). [6] Brüel & Kjær. 2015. Predictor-LimA Software Suite Type 7810. (March 2015). http://www.bksv .com/Products/EnvironmentManagementSolutions/ Noise%20Mapping%20and%20Prediction/predictor- lima- 7810 [7] M. Cartwright, A. Seals, J. Salamon, A. Williams, S. Mikloska, D. McConnell, E. Law , J.P. Bello, and O. Nov . 2018. Seeing Sound: Investigating the Eects of Visu- alizations and Complexity on Crowdsour ced Audio Annotations. In Proceedings of the 21st ACM Conference on Computer-Supported Cooperative Work and Social Computing (CSCW). October . [8] Harish Doraiswamy , Nivan Ferreira, Theodoros Damoulas, Juliana Freire, and Cláudio T . Silva. 2014. Using T opological Analysis to Support Event-Guided Exploration in Urban Data. IEEE Trans. Vis. Comput. Graph. 20, 12 (2014), 2634– 2643. [9] Jean-Daniel Fekete and Cláudio Silva. 2012. Managing Data for Visual Analytics: Opportunities and Challenges. IEEE Data Eng. Bull. 35, 3 (2012), 27–36. [10] Nivan Ferreira, Marcos Lage, Harish Doraiswamy , Huy V o, Luc Wilson, Heidi W erner , Mu Chan Park, and Claudio Silva. 2015. Urbane: A 3D Framework to Support Data Driven Decision Making in Urban De velopment. In 2015 IEEE Conference on Visual A nalytics Science and T e chnology, V AST 2015 . 97–104. [11] Nivan Ferreira, Jorge Poco, Huy T . V o, Juliana Freire, and Claudio T . Silva. 2013. Visual Exploration of Big Spatio-T emporal Urban Data: A Study of New Y ork City T axi Trips. IEEE TVCG 19, 12 (2013), 2149–2158. [12] Lin Fritschi, Lex Brown, Rokho Kim, Dietrich Schwela, and Stelios Kephalopolos. 2012. Introduction [Burden of disease from environmental noise: Quantication of healthy years life lost in Europe] . W orld Health Organisation. [13] Monica S. Hammer , Tracy K. Swinburn, and Richar d L. Neitzel. 2014. Envir onmen- tal Noise Pollution in the United States: Developing an Eective Public Health Response. Environmental Health Perspectives 122, 2 (Feb 2014). [14] Kenneth Kaliski, Eddie Duncan, and James Cowan. 2007. Community and r egional noise mapping in the United States. Sound and Vibration 41, 9 (2007), 12. [15] Markus Maibach, C Schreyer , D Sutter , HP V an Essen, BH Boon, R Smokers, A Schroten, C Doll, B Pawlowska, and M Bak. 2007. Handb ook on estimation of external costs in the transport se ctor . CE Delft Delft. [16] D. Manvell, L. Ballarin Marcos, H. Stapelfeldt, and R. Sanzb. 2004. SADMAM âĂŞ Combining Measurements and Calculations to Map Noise in Madrid. In Proceedings of the 33rd Congress and Exposition on Noise Control Engineering (Inter-Noise), Prague, Czech Republic, A ugust 22-25 . [17] Fumitoshi Mizutani, Yusuke Suzuki, and Hiroki Sakai. 2011. Estimation of social costs of transport in Japan. Urban Studies 48, 16 (2011), 3537–3559. [18] C. Mydlarz, J. Salamon, and J.P. Bello. 2017. The Implementation of Low-cost Urban Acoustic Monitoring Devices. A pplied Acoustics, Sp ecial Issue on Acoustics for Smart Cities 117, B (Februar y 2017), 207–218. [19] C Mydlarz, C Shamoon, and J.P Bello. 2017. Noise monitoring and enforcement in New Y ork City using a remote acoustic sensor network. In IN TER-NOISE and NOISE-CON Congress and Conference Procee dings . Institute of Noise Control Engineering. [20] Jon P Nelson. 1982. Highway noise and property values: a survey of recent evidence. Journal of transport economics and policy (1982), 117–138. [21] New Y ork City Department of Health and Mental Hygiene . 2014. A mbient Noise Disruption in New Y ork City . Data brief 45. New Y ork City Department of Health and Mental Hygiene. [22] Congduc Pham and Philippe Cousin. 2013. Streaming the sound of smart cities: Experimentations on the smartsantander test-be d. In Green Computing and Com- munications (GreenCom), 2013 IEEE and Internet of Things (iThings/CPSCom), IEEE International Conference on and IEEE Cyber , P hysical and Social Computing . IEEE, 611–618. [23] Lukas Ruge, Bashar Altakrouri, and Andreas Schrader . 2013. Soundofthecity- continuous noise monitoring for a healthy city . In Pervasive Computing and Communications W orkshops (PERCOM W orkshops), 2013 IEEE International Con- ference on . IEEE, 670–675. [24] J. Salamon and J.P. Bello . 2017. Deep Convolutional Neural Networks and Data Augmentation for Environmental Sound Classication. IEEE Signal Processing Letters 24, 3 (March 2017), 279–283. [25] J. Salamon, C. Jacoby , and J. P. Bello. 2014. A Dataset and Taxonomy for Urban Sound Research. In 22nd ACM International Conference on Multimedia (A CM- MM’14) . Orlando, FL, USA, 1041–1044. [26] J. Salamon, D. McConnell, M. Cartwright, P . Li, and J.P. Bello . 2017. SCAPER: A Library for Soundscape Synthesis and Augmentation. In Proceedings of the IEEE W orkshop on Applications of Signal Processing to Audio and Acoustics (W ASP AA-17). Mohonk, NY, USA. October . [27] Immanuel Schweizer , Christian Meu risch, Julien Gedeon, Roman Bärtl, and Max Mühlhäuser . 2012. Noisemap: multi-tier incentive mechanisms for participative urban sensing. In Proceedings of the Third International W orkshop on Sensing A pplications on Mobile Phones . ACM, 9. [28] Daniel Steele, Dirkjan Krijnders, and Catherine Guastavino. 2013. The Sensor City Initiative: cognitive sensors for soundscape transformations. In GIS Ostrava 2013 - Geoinformatics for City Transformation . Ostrava. [29] R T aber . 2007. T echnology for a Quieter A merica, National Academy of Engineering . Technical Report. NAEPR-06-01-A. [30] Marcel AJ Theeb e. 2004. Planes, trains, and automobiles: the impact of trac noise on house prices. The Journal of Real Estate Finance and Economics 28, 2-3 (2004), 209–234.
Original Paper
Loading high-quality paper...
Comments & Academic Discussion
Loading comments...
Leave a Comment