Adversarial adaptive 1-D convolutional neural networks for bearing fault diagnosis under varying working condition
Traditional intelligent fault diagnosis of rolling bearings work well only under a common assumption that the labeled training data (source domain) and unlabeled testing data (target domain) are drawn from the same distribution. However, in many real…
Authors: Bo Zhang, Wei Li, Jie Hao
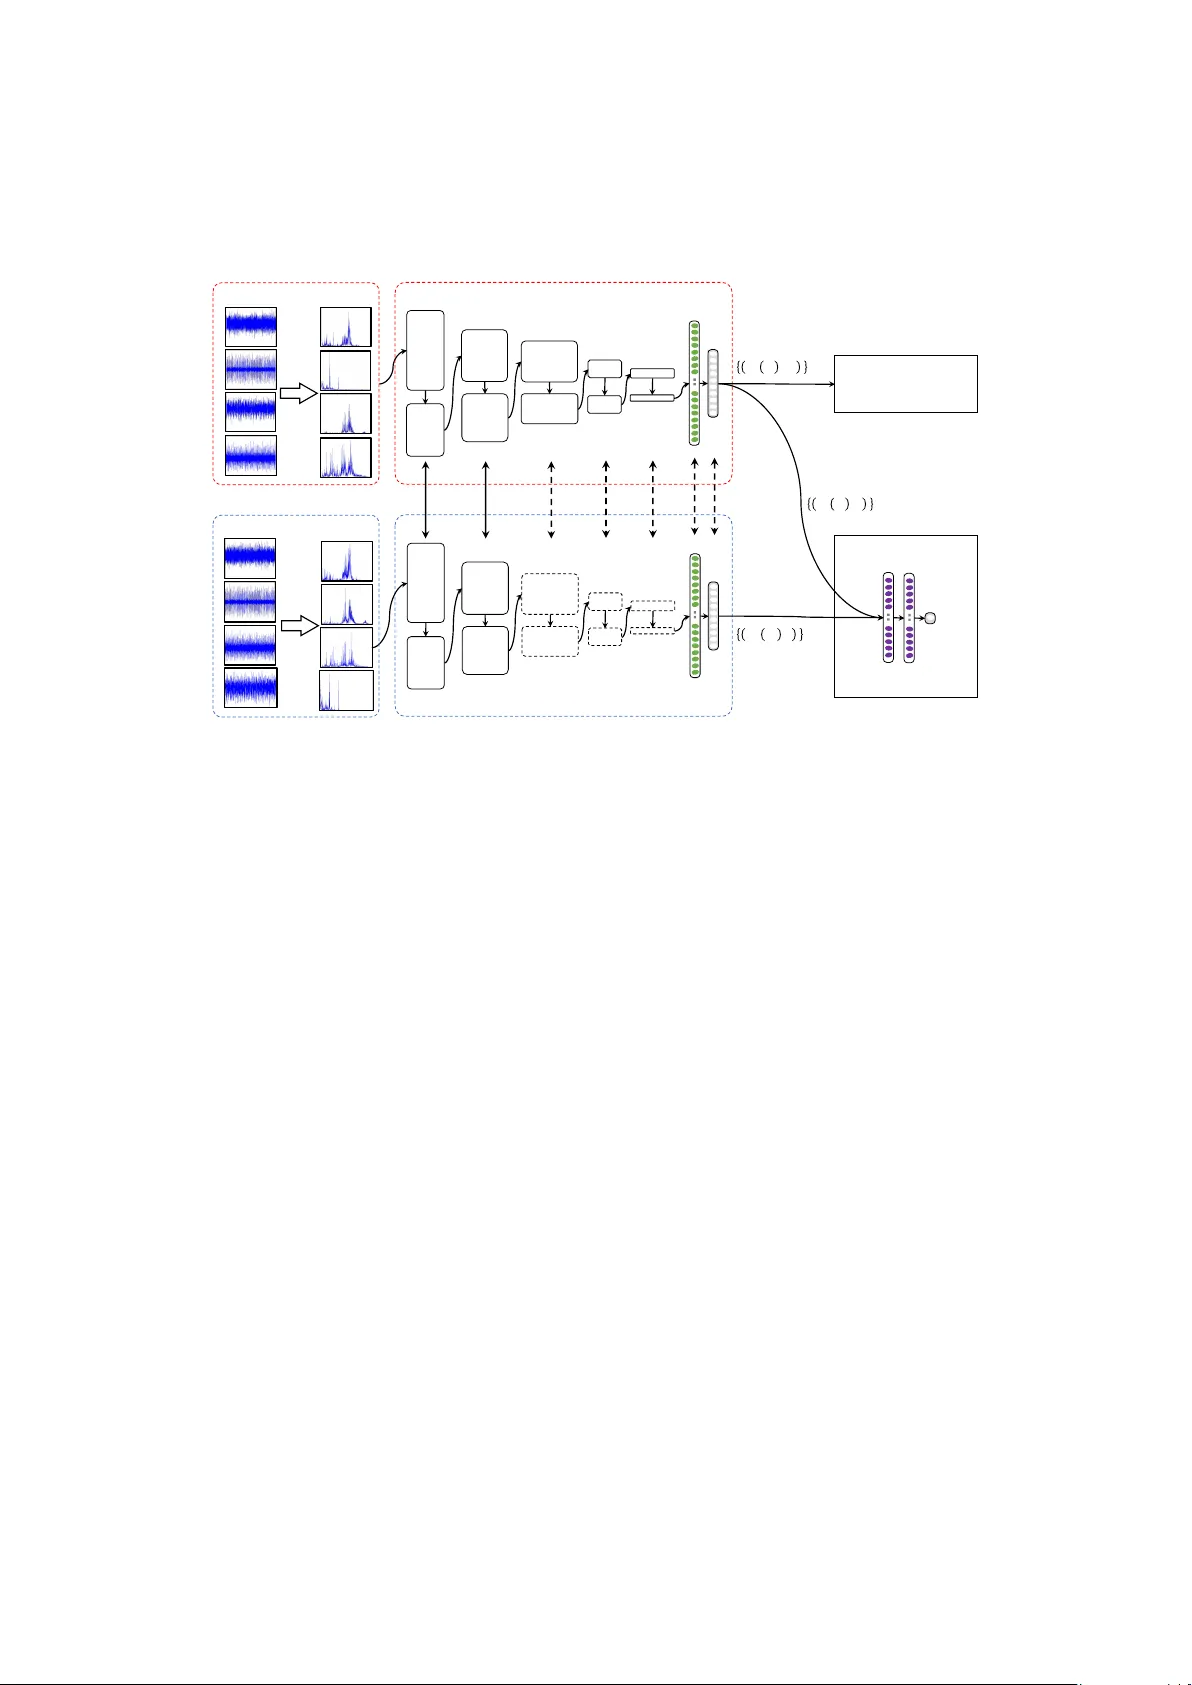
Adversarial adapti ve 1-D con v olutional neural networks for bearing fault diagnosis under v arying working condition Bo Zhang a,b , W ei Li a , Jie Hao c , Xiao-Li Li d , Meng Zhang a a School of Mechatr onic Engineering, China University of Mining and T echnology Xuzhou 221116, P eoples Republic of China b School of Computer Science And T echnology , China University of Mining and T echnology Xuzhou 221116, P eoples Republic of China c School of Medicine Information, Xuzhou Medical University , Xuzhou 221004, P eoples Republic of China d Institute for Infocomm Resear ch (I 2 R), A ∗ ST AR, 1 Fusionopolis W ay #21-01 Connexis, 138632, Singapor e Abstract T raditional intelligent f ault diagnosis of rolling bearings work well only under a common as- sumption that the labeled training data (source domain) and unlabeled testing data (target do- main) are drawn from the same distribution. Howe ver , in many real-world applications, this assumption does not hold, especially when the working condition v aries. In this paper , a ne w adversarial adapti ve 1-D CNN called A2CNN is proposed to address this problem. A2CNN consists of four parts, namely , a source feature extractor , a target feature extractor , a label clas- sifier and a domain discriminator . The layers between the source and target feature extractor are partially untied during the training stage to take both training e ffi ciency and domain adaptation into consideration. Experiments sho w that A2CNN has strong fault-discriminativ e and domain- in variant capacity , and therefore can achie ve high accuracy under di ff erent working conditions. W e also visualize the learned features and the networks to explore the reasons behind the high performance of our proposed model. K eywor ds: intelligent f ault diagnosis; con volutional neural networks; domain adaptation; adversarial network 1. Introduction Machine health monitoring is of great importance in modern industry . Failure of these ma- chines could cause great economical loss, and sometimes poses threats to the people who work with the machines. Therefore, in order to keep the industrial machines working properly and reliably , demand for better and more intelligent machine health monitoring technique has never ceased [1, 2]. Rolling element bearings are the most commonly used components in rotating machinery , and bearing faults may result in significant breakdowns, and ev en casualties [3, 4]. Therefore, e ff ecti ve fault diagnosis plays a highly significant role in increasing the safety and reliability of machinery and prev enting possible damage [5]. In recent years, deep learning techniques have achieved huge success in computer vision [6, 7] and speech recognition [8, 9]. Some deep learning techniques ha ve already found their way into machine health monitoring systems. For example, Jia et al. took the frequency spectra generated by fast Fourier transform (FFT) as the input of a stack ed autoencoder (SAE) with three hidden layers for fault diagnosis of rotary machinery components [10]. Zhu et al. proposed a Pr eprint submitted to Journal of L A T E X T emplates May 10, 2018 SAE model for hydraulic pump fault diagnosis that used frequency features generated by Fourier transform [11]. Liu et al. used the normalized spectrum generated by Short-time Fourier trans- form (STFT) of sound signals as the input of a SAE model consisting of two layers. Moreover , multi-domain statistical features including time domain features, frequency domain features and time-frequency domain features were fed into the SAE model as a way of feature fusion [12, 13]. There are also some researchers focusing on deep belief network (DBN) [14, 15, 16]. Con volu- tional neural networks (CNN) [17, 18] as one of the most popular deep learning networks, which hav e been successfully used in image recognition, is also used to realize fault diagnosis of me- chanical parts. Many CNN architectures were proposed, such as VGGNet [19], ResNet [20] and Inception-v4 [21], for 2-D image recognition. Also, CNN models for 1-D vibration signal were proposed. For e xample, 1D raw time vibration signals were used as the inputs of the CNN model for motor fault detection in [22], which successfully a voided the time-consuming feature e xtrac- tion process. Guo et al. [23] proposed a hierarchical CNN consisting of two functional layers, where the first part is responsible for fault-type recognition and the other part is responsible for fault-size e valuation. Most of the above proposed methods are only applicable to the situation that the data used to train classifier and the data for testing are under the same working condition, which means that these proposed methods work well only under a common assumption: the labeled train- ing data (source domain) and unlabeled testing data (target domain) are drawn from the same distribution. Howe ver , many real recognitions of bearing faults show this assumption does not hold, especially when the working condition v aries. In this case, the labeled data obtained in one working condition may not follo w the same distrib ution in another di ff erent w orking condition in real applications. When the distribution changes, most fault diagnosis models need to be rebuilt from scratch using newly recollected labeled training data. Ho wever , it is very expensiv e, if not impossible, to annotate huge amount of training data in the tar get domain to rebuild such new model. Meanwhile, large amounts of labeled training data in the source domain have not been fully utilized yet, which apparently waste huge resources and e ff ort. As one of the important research directions of transfer learning, domain adaptation (DA) typically aims at minimizing the di ff erences between distrib utions of di ff erent domains in order to minimize the cross-domain prediction error by taking full adv antage of information coming from both source and target domains. Recently , DA has been introduced into the field of bearings fault diagnosis, such as [24, 25, 26, 27]. For instance, Zhang et al. [26] took 1-D raw time vibration signal as the input of the CNN model, which realize fault diagnosis under di ff erent working loads. The domain adap- tation capacity of this model originates from the method named Adaptive Batch Normalization (AdaBN). Lu et al. [25] inte grated the maximum mean discrepancy (MMD) as the regularization term into the objecti ve function of DNN to reduce the di ff erences between distributions cross domains. In general, the main problem existing in domain adaptation is the div ergence of distribution between the source domain and the target domain. W e need to learn a new feature representa- tion, which should be fault-discriminati ve and simultaneously be domain-in variant. The fault- discriminativ e ability refers that the learned feature representation should minimize the label classifier error, i.e., has a good ability to identify di ff erent faults. The domain-in variant ability means that the learned feature representation should maximize the domain classification loss for all domains. That is to say , instances sampled from the source and tar get domains have similar distributions in the learned feature space. As a result, a domain classifier cant distinguish whether data come from the source domain or from the target domain. In 2014, Goodfellow et al. [28] proposed Generati ve Adversarial Nets (GAN). GAN simul- 2 taneously train two models: a generative model G captures the data distribution and a discrimi- nativ e model D estimates the probability that a sample came from the training data o generated by G . Inspired by GAN, we designed a adversarial adapti ve model based on 1-D CNN named A2CNN, which simultaneously satisfied the abov e fault-discriminativ e and domain-in variant re- quirements. The details of the model will be sho wn in Section 3. T o our best kno wledge, this is the first attempt for solving the domain adaptation issues in fault diagnosis by introducing adversarial network. The main contributions of this literature are summarized as follo ws. 1) W e propose a novel adversarial adapti ve CNN model which consists of four parts, namely , a source feature extractor , a target feature e xtractor, a label classifier and a domain discriminator . During the training stage, the layers between the source and target feature extractor are partially untied to take both training e ffi ciency and domain adaptation into consideration. 2) This proposed model has strong fault-discriminati ve and domain-in variant capacity , and therefore can achie ve high accurac y under di ff erent working conditions. W e visualize the fea- ture maps learned by our model to explore the intrinsic mechanism of proposed model in fault diagnosis and domain adaptation. 3) Besides the commonly used fault diagnostic accuracy , we introduce two ne w ev aluation indicators, pr ecision and recall . Compared with accuracy , pr ecision and r ecall can ev aluate the reliability of a model for certain type of fault recognition in more detail. The rest of paper is org anized as follo ws. In Section 2, some preliminary knowledge that will be used in our proposed framew ork is briefly revie wed. Section 3 introduced the construction of our proposed A2CNN. A series of e xperiments are conducted in Section 4. Finally , we conclude this paper in Section 5. 2. Preliminary Kno wledge The abo ve CNNs for fault diagnosis mentioned in 1 work well only under a common as- sumption: The training and test data is drawn from the same distribution. Howe ver , vibration signals used for fault diagnosis usually show disobedience of the above assumption. In the run- ning process of rotating machinery , because of complicated working conditions, the distributions of fault data under varying working condition are not consistent. For example, the training sam- ples for building the classifier might be collected under the work condition without the motor load, nev ertheless the actual application is to classify the defects from a bearing system under di ff erent motor load states. Although the cate gories of defects remain unchanged, the target data distribution changes with the motor load v aries. Our ultimate goal is to be able to predict labels gi ven a sample from one working condition while the classifier is trained by the samples collected in another working condition. Then, the problem abo ve can be regarded as a domain adaptation problem, which is a realistic and challenging problem in f ault diagnosis. T o solve this challenge, a domain adaption technique, would be needed to learn a discriminati ve classifier or other predictor in the presence of a ”shift” between training and test distrib ution by taking full adv antage of information coming from both source and target domains. 2.1. Domain Adaptation According to the surve y on domain adaptation (D A) for classification [29], a domain D consists of two components: a feature space X and a marginal probability distrib ution P X , where 3 X ∈ X . Give a specific domain, a task T consists of two components: a label space Y and a prediction function f ( X ). From a probabilistic vie w point, f ( X ) can be written as the conditional probability distribution P Y | X . Giv en a source domain D S and a corresponding learning task T S , a target domain D T and a corresponding learning task T T , domain adaptation aims to improve the learning of the target predicti ve function f T in D T using the kno wledge in D S and T S , where D S , D T and T S = T T , i.e., the tasks are the same but the domains are di ff erent. In real world applications of fault diagnosis, the working conditions (e.g. motor load and speed) may change from time to time according to the requisite of the production. As a kind of classification problem, the goal of intelligent fault diagnosis is to train classifier with sam- ples collected and labeled in one working condition to be able to classify samples from another working condition. Samples collected under di ff erent working conditions can be regarded as dif- ferent domains. Correspondingly , the fault diagnosis settings in domain adaptation situation are as follows: • The feature spaces between domains are the same, X S = X T , e.g. the fast Fourier transform (FFT) spectrum amplitudes of raw vibration temporal signals. • The label spaces between domains are the same, Y S = Y T = { 1 , ..., K } , where K is the quantity of fault types. • P S X Y and P T X Y only di ff er in the mar ginal probability distrib ution of the input data, i.e., P S X , P T X , while P S Y | X = P T Y | X . which is similar to the assumptions in cov ariate shift [30, 31, 32] or sample selection bias [33]. 2.2. Domain Diver gence Measur e The main problem existing in domain adaptation is the di vergence of distrib ution between the target domain and source domain. Ben-David et al. [34, 35] defines a di ver gence measure d H ∆ H ( S , T ) between tw o domains S and T , which is widely used in the theory of nonconservati ve domain adaptation. Using this notion, they established a probabilistic bound on the performance T ( h ) of some label classifier h from T ev aluated on target domain giv en its performance S ( h ) on the source domain. Formally , T ( h ) ≤ S ( h ) + 1 2 d H ∆ H ( S , T ) + λ (1) where λ is supposed to be a negligible term and dose not depend on classifier h . Eq. 1 tells us that to adapt well, one has to learn a label classifier h which works well on source domain while reducing the d H ∆ H ( S , T ) di ver gence between S and T . Estimating d H ∆ H ( S , T ) for a finite sample is e xactly the problem of minimizing the empirical risk of a do- main classifier h d that discriminates between instances drawn from S and instances drawn from T , respectively pseudo-labeled with 0 and 1. More specifically , it in volv es the following steps: 1. Pseudo-labeling the source and target instances with 0 and 1, respecti vely . 2. Randomly sampling two sets of instances as the training and testing set. 3. Learning a domain classifier h d on the training set and verifying its performance on the testing set. 4. Estimating the distance as ˆ d H ∆ H ( S , T ) = 1 − 2 ( h d ), where ( h d ) is the test error . 4 It’ s obvious that if two domains perfectly ov erlap with each other, ( h d ) ≈ 0 . 5, and ˆ d H ∆ H ( S , T ) ≈ 0. On the contrary , if two domains are completely distinct from each other , ( h d ) ≈ 0, and ˆ d H ∆ H ( S , T ) ≈ 1. Therefore, ˆ d H ∆ H ( S , T ) ∈ [0 , 1]. The lower the v alue is, the smaller tw o domains div ergence. 2.3. Generative Adversarial Networks In 2014, Goodfello w et al. proposed a no vel method named Generativ e Adversarial Networks (GAN). A GAN consists of two part: a generator G that synthesizes data whose distrib ution closely matches that of the real data, and a discriminator D that estimates the probability that a sample came from the real data rather than G [36]. Similar to Section 2.2, real data are labeled with 0 and data generated by G are labeled with 1. The discriminator is trained to maximize the probability of assigning the correct label to both real samples and samples from G [36]. While, the training procedure for G is to maximize the probability of D making mistake. Therefore, the tw o models G and D formulated as a two- player minimax game, are trained simultaneously . A unique solution exists with G recovering the real data and D is unable to distinguish between real and generated samples, i.e. D ( x ) = 0 . 5 ev erywhere [36]. By comparing DA, domain div ergence measure d H ∆ H and GAN, we observ e that they have a similar objectiv e, that is, finding a feature representation that the data drawn from di ff erent distributions or di ff erent domains hav e the same distribution and perfectly o verlap with each other after mapping to the learned feature space. As a result, a domain discriminator (resp. classifier) cant distinguish between the real (resp. the source domain) data and the generated (resp. the target domain) data. 3. Proposed adv ersarial adaptive 1-D CNN 3.1. Pr oblem F ormalization Let the labeled source domain data as D S = { ( x i S , y i S ) }| N S i = 1 , where x i S ∈ R m × 1 is the data instance and y i S ∈ { 1 , ..., K } is the corresponding class label. While, D T = { ( x i T ) }| N T i = 1 is the unlabeled target domain data. Here, N S and N T are the numbers of instances in D S and D T . In addition, each data instance is pseudo-labeled with a domain label d ∈ { 0 , 1 } respectiv ely , which indicates whether the instance comes from the source domain ( d = 0) or from the target domain ( d = 1). The overall frame work of the proposed Adversarial Adaptiv e 1-D CNN (A2CNN) is shown in Figure 1. It includes a source feature extractor M S , a tar get feature extractor M T , a label classifier C and a domain discriminator D , which together form a deep feed-forward architecture that maps each input sample x i S (resp. x i T ) to a K -dimensional feature v ector M S ( x i S ) (resp. M T ( x i T )) ( K equals to the number of class label) and predicts its class label y ∈ { 1 , ..., K } and its domain label d ∈ { 0 , 1 } . Compared with the traditional deep domain adaptation models, the proposed framew ork is more like an adversarial learning frame work similar to GAN. The parameters of C and D should be optimized to minimizes the label prediction loss S ( C ) (for the labeled source domain) and the domain classification loss ( D ) (for all domains). And the parameters of the feature extractor M S and M T should be discriminati ve to minimize S ( C ) and domain-in variant to maximize ( D ). 5 Pool1 !"# $% Conv3 Conv2 Pool2 Pool3 Conv4 Pool4 Conv5 Pool5 1 2 3 4 5 6 7 8 9 0 Source Domain Examples + Labels NO &' (' )' )' (' &' NO ''* ''* Target Domain Examples Pool1 !"# $% Conv3 Conv2 Pool2 Pool3 Conv4 Pool4 Conv5 Pool5 1 2 3 4 5 6 7 8 9 0 + , + - ( Soft - max Re gression Model ) Source Feature Extractor Target Feature Extractor + , . / 0 1 23 3 4 056 7 8 + - . - 0 1 9 3 4 056 7 : + , . / 0 1 ; , 0 3 3 4 05 6 7 8 Domain Discriminator < Tied Layers Adaptation Layers Label = lassifier > Figure 1: The proposed Adv ersarial Adapti ve 1-D CNN (A2CNN) includes a source feature extractor M S , a tar get feature extractor M T , a label classifier C and a domain discriminator . Solid lines indicate tied layers, and Dashed lines indicate adaptiv e layers. Source feature extractor M S . As shown in Figure 1, we compose the source feature extractor M S from five 1-D conv olutional layers and two fully-connected layers. The input of the first con volution layer (i.e. ’Conv1’) is the fast F ourier transform (FFT) spectrum amplitudes of vibration signals, which is the most widely used approach of bearing defect detection. The last fully-connected layer (i.e. ’FC2’) is called label layer [37] with an output of K neurons (equals to the number of class label), which is fed to label classifier C which estimate the posterior probability of each class. It is common to add a pooling layer after each con volution layer in the CNN architecture separately . It functions as a down-sampling operation which results in a reduced-resolution output feature map, which is robust to small variations in the location of features in the previous layer . The most commonly used pooling layer is max-pooling layer , which performs the local max operation ov er the input features. The main di ff erence between the traditional 2-D and the 1-D CNN is the usage of 1-D arrays instead of 2-D matrices for both feature maps and filter kernels. In order to capture the useful information in the intermediate and low frequency bands, the wide kernels should be used in the first con volutional layer which can better suppress high frequency noise[26]. The following con volutional kernels are small (specifically , 3 × 1) which make the netw orks deeper to acquire good representations of the input signals and improv e the performance of the network. Label classifier C . For an source domain instance x i S , the output feature vector M S ( x i S ) ∈ R K × 1 mapped by the source feature extractor M S is the input of the label classifier C . Here, the soft- max regression model [38] is used as the label classifier on source domain to incorporate label information. The soft-max regression model is a generalization of the logistic regression model for multi-class classification problems. W e can estimate the probabilities of each class that x i S 6 belongs to as follows, C M S ( x i S ) = p y = 1 | x i S p y = 2 | x i S . . . p y = K | x i S = 1 P K j = 1 e u j e u 1 e u 2 . . . e u K , (2) where u j = M S ( x i S ) j is the j -th v alue of M S ( x i S ), P K j = 1 e u j is a normalized term, and p y = j | M S ( x i S ) represent the distribution of the class j ∈ { 1 , 2 , ..., K } gi ven the input M S ( x i S ). Gi ve the source domain data D S , the parameters of the source feature extractor M S can be derived by maximizing the following supervised loss, max M S L cl s ( D S ) = 1 N S N S X i = 1 K X j = 1 1 { y i S = j } h log C M S ( x i S ) i . (3) where 1 { y i S = j } is an indicator function, whose value is 1 if y i S = j , otherwise is 0. T arget feature extractor M T . Based on ”How to parametrize the target feature extractor”, the approaches of most published adversarial adaptation works can be summarized into two cate- gories: symmetric transformation and asymmetric transformation. For man y prior symmetric transformation methods [39, 40], all layers are constrained, thus enforcing exact source and tar - get mapping consistency . Although learning a symmetric transformation can reduce the number of parameters in the model, this may make the optimization poorly conditioned, since the same network must handle samples from two separate domains [41]. The intuiti ve idea behind the asymmetric transformation is to constrain a subset of the layers. Rozantse v et al. [42] showed that partially shared weights can lead to e ff ecti ve adaptation in both supervised and unsupervised settings. W e choose to learn parameters of the target feature extractor M T by partially untying layers between source and target mappings. As shown in Figure 1, solid lines indicate tied layers, and dashed lines indicate adapti ve layers. Gi ven that the tar get domain is unlabeled, we initialize the parameters of the target feature e xtractor M T with the source feature extractor M S . Domain discriminator D. F or an instance x i S (resp. x i T ), the output feature vector M S ( x i S ) (resp. M T ( x i T )) mapped by the feature extractor M S (resp. M T ), pseudo-labeled with a domain label d i = 0 (resp. d i = 1), is the input of the domain discriminator D . The domain discriminator D is a multi-layer perceptron (MLP), which is composed of se veral fully-connected layers (e.g. in put → 500 → 500 → 1). The domain discriminator is in the binary classification setting. W ith the logistic regression model, its loss takes the form belo w , max D L adv D = 1 N S N S X i = 1 h log D ( M S ( x i S )) i + 1 N T N T X i = 1 h log (1 − D ( M T ( x i T )) i . (4) In order to obtain domain-in variant features, we seek the parameters of the tar get feature extractor M T to fool the domain discriminator D by maximizing the follo wing loss function L adv M T with in verted domain labels [36], max M T L adv M T = 1 N T N T X i = 1 h log D ( M T ( x i T )) i . (5) 7 3.2. Model Learning W e have used tw o training steps to enhance the domain adaptation ability of our model. The details of the proposed algorithm is summarized in Algorithm 1. 1. Pre-train . T rain the source feature extractor M S with labeled source training examples. 2. Adversarial adaptiv e fine tune .Initialize the parameters of the target feature extractor M T with the trained source feature extractor M S and learn a tar get feature extractor M T such that a domain discriminator D can not predict the domain label of mapped source and target e xamples reliably . 3.3. Classifier Construction After all the parameters are learned, we can construct a classifier for the tar get domain by directly using the output of the last fully connected layer (i.e. ’FC2’) of the tar get feature ex- tractor M T . That is, for any instance x i T in the tar get domain, the output of the tar get feature extractor M T ( x i T ) can computer the probability of instance x i T belonging to a label j ∈ { 1 , ..., K } using Eq. 2. W e choose the maximum probability using Eq. 6. and the corresponding label as the prediction, y i T = max j e u j P K l = 1 e u l , with u j = M T ( x i T ) j . (6) 4. Experimental analysis of proposed A2CNN model In real world applications, data under di ff erent load condition usually draw from di ff erent distribution. So it is significant to use unlabeled data under an y load condition to rebuilt the classifier trained with samples collected in one load condition. In the reminder of this section, Case W estern Reserve Uni versity (CWR U) bearing database is used to in vestigate how well the proposed A2CNN method performs under this scenario. 4.1. Datasets and Pr eprocessing The test-bed in CWRU Bearing Data Center is composed of a driving motor, a two hp mo- tor for loading, a torque sensor / encoder , a power meter , accelerometers and electronic control unit. The test bearings locate in the motor shaft. Subjected to electro-sparking, inner-race faults (IF), outer -race faults (OF) and ball fault (BF) with di ff erent sizes (0.007in, 0.014in, 0.021in and 0.028in) are introduced into the dri ve-end bearing of motor . The vibration signals are sampled by the accelerometers attached to the rack with magnetic bases under the sampling frequency of 12kHz. The experimental scheme simulates three working conditions with di ff erent mo- tor load and rotating speed, i.e., Load1 = 1hp / 1772rpm, Load2 = 2hp / 1750rpm and Load3 = 3hp / 1730rpm. The vibration signals of normal bearings (NO) under each working condition are also gathered. In this paper , a vibration signal with length 4096 is randomly selected from raw vibration signal. Then, fast Fourier transform (FFT) is implemented on each signal and the 4096 Fourier coe ffi cients are generated. Since the coe ffi cients are symmetric, the first 2048 coe ffi cients are used in each sample. The samples collected from the abov e three di ff erent conditions form three domains, namely A, B and C, respecti vely . There are ten classes under each working condition, including nine kinds of faults and a normal state, and each class consists of 800 samples. There- fore, each domain contains 8000 samples of ten classes collected from corresponding working condition. The statistics of all domains are described in T able 1. 8 Function Pretrain() : Data: Gi ven one source domain D S = { ( x i S , y i S ) }| N S i = 1 . Result: The parameters in the source feature extractor M S . begin for number of tr aining iterations do Sample minibatch of m instances { ( x 1 S , y 1 S ) , ..., ( x m S , y m S ) } from the source domain D S ; Update the domain discriminator M S by ascending its stochastic gradient; 5 M S 1 m P m i = 1 P K j = 1 1 { y i S = j } h log C M S ( x i S ) i . end end end Function Finetune() : Data: Giv en one source domain D S = { ( x i S , y i S ) }| N S i = 1 , and one target domain D T = { ( x i T ) }| N T i = 1 . The parameters in the source feature extractor M S . The number of adaptiv e layers, l . The number of steps to apply to the discriminator , k . Result: Results of the feature vector mapped by M T , i.e., { M T ( x i T ) }| N T i = 1 . begin Initialize the parameters of the target feature e xtractor M T with the source feature extractor M S . for number of tr aining iterations do for i ← 1 to k do Sample minibatch of m instances { x 1 S , ..., x m S } from the source domain D S . Sample minibatch of m instances { x 1 T , ..., x m T } from the target domain D T . Update the domain discriminator D by ascending its stochastic gradient: 5 D 1 m P m i = 1 h log D ( M S ( x i S )) + log (1 − D ( M T ( x i T ))) i . end Sample minibatch of m instances { x 1 T , ..., x m T } from the target domain D T . Update the final l adaptiv e layers of the target feature extractor M T by ascending its stochastic gradient: 5 M T 1 m P m i = 1 h log D ( M T ( x i T )) i . end for j ← 1 to N T do Computing the M T ( x i T ). end end end Algorithm 1: Adversarial Adapti ve CNN (A2CNN) 9 T able 1: Description of the CWRU dataset Category labels 1 2 3 4 5 6 7 8 9 10 Fault location None IF BF OF Load Fault diameter (in.) 0 0.007 0.014 0.021 0.007 0.014 0.021 0.007 0.014 0.021 Domain A 800 800 800 800 800 800 800 800 800 800 1 Domain B 800 800 800 800 800 800 800 800 800 800 2 Domain C 800 800 800 800 800 800 800 800 800 800 3 #Features 2048 2048 2048 2048 2048 2048 2048 2048 2048 2048 T o construct domain adaptation problems, we randomly choose two from the three domains, where one is considered as the source domain and the other is considered as the tar get domain. Therefore, we construct six ( P 2 3 ) domain adaptation problems. T ake the domain adaption task A → B as an example. The examples of domain A are used as the source domain data D S , and the examples of domain B are used as the tar get domain data D T . 4.2. Experimental setup 4.2.1. Baseline Methods W e compare our methods with the following baselines, 1. T raditional SVM and Multi-layer Perceptron (MLP) which work with the data transformed by Fast F ourier transformation (FFT). 2. The deep neural network (DNN) system with frequency features [10] proposed by Lei et al. in 2016. This neural network consists of three hidden layers. The number of neurons in each layer is 1025, 500, 200, 100 and 10. The input of the netw ork is the normalized 1025 Fourier coe ffi cients transformed from the ra w temporal signals using FFT . 3. The Deep Conv olution Neural Networks with W ide first-layer kernels (WDCNN) system [26] proposed by Zhang et al. in 2017. The WDCNN system works directly on raw temporal signals. It contains fi ve con volutional layers and batch normalization layers. The domain adaptation capacity of this model originates in the domain adaptation method named Adaptiv e Batch Normalization (AdaBN). 4.2.2. P arameters of the pr oposed A2CNN The feature extractor M S and M T used in experiments is composed of fiv e con volutional layers and pooling layers follo wed by two fully-connected hidden layers. The pooling type is max pooling and the acti vation function is ReLU. The parameters of the con volutional and pooling layers are detailed in T able 2. In order to minimize the loss function, the Adam Stochastic optimization algorithm is applied to train our CNN model. The final l ( l ∈ [1 , 7]) layers of the target feature e xtractor M T is untied and used as adapti ve layers. The domain discriminator D consists of three fully-connected layers. The number of neurons in each layer is 500, 500 and 1. The experiments were implemented using T ensorflow toolbox of Google. 10 A-> B A-> C B- >A B- >C C- >A C- >B AVG SVM 68.60% 60.00% 73.20% 67.60% 68.40% 62.00% 66.63% ML P 82.10% 85.60% 71.50% 82.40% 81.80% 79.00% 80.40% DNN 82.20% 82.60% 72.30% 77.00% 76.90% 77.30% 78.05% WDC NN 99.20% 91.00% 95.10% 91.50% 78.10% 85.10% 90.00% WDCNN(AdaBN) 99.40% 93.40% 97.50% 97.20% 88.30% 99.90% 95.95% A2CNNs 99.86% 98.40% 97.89% 89.46% 89.65% 99.14% 95.73% A2CNN 99.99% 99.30% 98.18% 99.90% 97.93% 99.99% 99.21% 50.00% 60.00% 70.00% 80.00% 90.00% 100.00% Acc uracy Figure 2: Accuracy (%) on six domain adaptation problems. T able 2: Details of the feature extractor M S and M T used in experiments. No. Layer type Kernel stride Channel Output Padding 1 Con volution1 32 × 1 2 × 1 8 1009 × 8 Y es 2 Pooling1 2 × 1 2 × 1 8 504 × 8 No 3 Con volution2 16 × 1 2 × 1 16 245 × 16 Y es 4 Pooling2 2 × 1 2 × 1 16 122 × 16 No 5 Con volution3 8 × 1 2 × 1 32 58 × 32 Y es 6 Pooling3 2 × 1 2 × 1 32 29 × 32 No 7 Con volution4 8 × 1 2 × 1 32 11 × 32 Y es 8 Pooling4 2 × 1 2 × 1 32 5 × 32 No 9 Con volution5 3 × 1 2 × 1 64 2 × 64 Y es 10 Pooling5 2 × 1 2 × 1 64 1 × 64 No 11 Fully-connected 500 1 500 12 Fully-connected 10 1 10 By contrast, for an instance from the target domain x i T , in order to in vestigate the e ff ectiveness of adversarial adaptation, we use the corresponding output of the well-trained source feature extractor M S ( x i T ) to computer the probability of the instance x i T belonging to a label j ∈ { 1 , ..., K } using Eq. 2, which is denoted as A2CNN S . 4.3. Accuracy acr oss di ff er ent domains As Figure 2 sho ws, SVM, MLP and DNN perform poorly in domain adaptation, with average accuracy in the six scenarios being around 65%, 80% and 80%. Which pro ve that samples under di ff erent working conditions draw from the di ff erent distributions and models trained under one working condition is not suitable for fault classification under another w orking load condition. Compared with the WDCNN with AdaBN, which achieved the state-of-art domain adaptation ability , A2CNN which achie ves 99.21% accuracy in average is obviously greater than WDCNN 11 (AdaBN) with average accuracy being 95.95%. This result prove that the features learned by A2CNN are more domain in variant than the features learned by the other methods. In addition, by comparing A2CNN with A2CNN S , we can find that in e very scenario, the performance of A2CNN is superior to A2CNN S . This means that the adversarial adaptation training can significantly improv e the bearing fault diagnosis under v arying working conditions. It is also interesting that when adapting from Domain A to B, from B to A, from B to C, and from C to B, the fault diagnosis accuracy of the proposed A2CNN is only a bit better than WDCNN (AdaBN). Howe ver , when adapting from domain A to C and C to A, the proposed A2CNN is significantly better than the other methods. This result prove that A2CNN is good at solving the problem that the distributions of source domain and tar get domain are far di ff erent. 4.4. Sensitivity Analysis of F aults For each type of fault detection, in order to further analyze the sensiti vity of the proposed A2CNN model, we introduce two new e valuation indicators, i.e. pr ecision and r ecall , which are widely used in pattern recognition, information retriev al and binary classification. In the fault diagnosis context, the pr ecision and recall for a kind of fault type f can be calculated as below , pr ecision ( f ) = T P T P + F P , recall ( f ) = T P T P + F N , (7) where true positives ( T P ) means the number of faults correctly identified as f , false positives ( F P ) means the number of faults incorrectly labeled as f and false ne gatives ( F N ) means the number of faults f incorrectly labeled as not belonging to f . A pr ecision score of 1.0 for a fault type f means that e very sample labeled as belonging to class f does indeed belong to class f (i.e. there is no false alarm), b ut it can’t tell us about the number of samples from class f that were not labeled correctly (i.e. how many failures are missing?). Whereas a r ecall of 1.0 means that e very item from a fault type f was labeled as belonging to class f (i.e. there is no missing alarm), but says nothing about ho w many other items were incorrectly also labeled as belonging to class f (i.e. ho w many false alarms are there?). The precision and recall of ev ery class processed by A2CNN and A2CNN S are detailed in T able 3 and T able 4. In T able 3, for the 3rd kinds of fault (i.e. IF with fault size being 0.014 in.), A2CNN S has low pr ecision when adapting from domain B to C and from C to A, which are 49.63% and 57.55% respectiv ely . This means that about half of that kind of fault alarms are unreliable. Meanwhile, in T able 4, for the 2nd kinds of f ault (i.e. IF with fault size being 0.007 in.), A2CNN S has very lo w r ecall when adapting from domain B to C and from C to A, which are 1.13% and 26.75% respecti vely . This means that about a large number of that kind of failures are not detected. In general, the pr ecision and r ecall of A2CNN are higher than that of A2CNN S , which im- plies that A2CNN has fe wer false alarms (i.e. high precision score ) and missed alarms (i.e. high r ecall score ). W e can find that A2CNN can make almost all class classified into right class, except BF with fault size being 0.014 in and BF with fault size being 0.021 in. This result shows that after adversarial fine tuning, the classification performance on ev ery class achie ve remarkable improv ement. 12 T able 3: precision of the proposed A2CNN S and A2CNN on six domain adaptation problems. Fault location None IF BF OF Fault diameter (in.) 0.007 0.014 0.021 0.007 0.014 0.021 0.007 0.014 0.021 Category labels 1 2 3 4 5 6 7 8 9 10 pr ecision of A2CNN S A → B 100% 100% 100% 100% 100% 100% 98.64% 100% 100% 100% A → C 92.27% 100% 100% 100% 99.75% 92.82% 99.46% 100% 100% 100% B → A 100% 100% 100% 100% 87.43% 93.68% 100% 100% 100% 100% B → C 96.74% 100% 49.63% 100% 100% 99.49% 100% 100% 100% 100% C → A 100% 100% 57.55% 100% 83.33% 95.40% 100% 95.12% 100% 100% C → B 100% 100% 93.13% 99.88% 98.89% 100% 100% 100% 100% 100% pr ecision of A2CNN A → B 100% 100% 100% 100% 100% 100% 99.88% 100% 100% 100% A → C 93.46% 100% 100% 100% 100% 100% 100% 100% 100% 100% B → A 100% 100% 100% 100% 90.70% 92.59% 100% 100% 100% 100% B → C 100% 100% 99.01% 100% 100% 100% 100% 100% 100% 100% C → A 100% 100% 100% 100% 90.91% 90.40% 100% 100% 100% 100% C → B 100% 100% 100% 100% 99.88% 100% 100% 100% 100% 100% T able 4: recall of the proposed A2CNN S and A2CNN on six domain adaptation problems. Fault location None IF BF OF Fault diameter (in.) 0.007 0.014 0.021 0.007 0.014 0.021 0.007 0.014 0.021 Category labels 1 2 3 4 5 6 7 8 9 10 r ecall of A2CNN S A → B 100% 100% 100% 100% 98.63% 100% 100% 100% 100% 100% A → C 100% 100% 99.75% 100% 99.50% 92.13% 92.88% 100% 99.50% 100% B → A 100% 100% 100% 100% 100% 100% 78.88% 100% 100% 100% B → C 100% 1.13% 100% 100% 100% 96.63% 99.50% 100% 97.38% 100% C → A 100% 26.75% 100% 100% 100% 96.00% 73.75% 100% 100% 100% C → B 100% 92.63% 100% 100% 100% 99.88% 98.88% 100% 100% 100% r ecall of A2CNN A → B 100% 100% 100% 100% 100% 99.88% 100% 100% 100% 100% A → C 100% 100% 100% 100% 100% 93.00% 100% 100% 100% 100% B → A 100% 100% 100% 100% 100% 100% 81.75% 100% 100% 100% B → C 100% 100% 100% 100% 100% 100% 100% 100% 99.00% 100% C → A 100% 100% 100% 100% 100% 100% 79.38% 100% 100% 100% C → B 100% 100% 100% 100% 100% 100% 99.88% 100% 100% 100% 4.5. P arameter Sensitivity In this section, we in vestigate the influence of the parameter l , which represents the number of untied layers in the tar get feature extractor M T during the adversarial adaptiv e fine tune. Gi ven that the target feature e xtractor M T contains fi ve con volutional layers and pooling layers and two fully-connected hidden layers, l is selected from { 1 , ..., 7 } in our experiment. W e use A2CNN l to denote the A2CNN model with the parameter l . For example, A2CNN 1 indicates that only the last fully-connected hidden layer is untied (i.e. FC2 in Figure 1), and A2CNN 7 means all the sev en layers in M T are untied (i.e. from ’Conv1’ to ’FC2’ in Figure 1). Figure 3 reports the results. From the figure, we can generally observe that the more untied layers inv olved in adversarial adaptive fine tuning stage, the higher the accuracy of recognition. Howe ver , the sensitivity of di ff erent adapti ve problems to parameters l is di ff erent. First of all, when adapting from domain A to B and from B to A, the enhancement of recog- nition accuracy is limited. W e can use A2CNN S directly to achieve the accuracy of 99.86% and 97.89% respectiv ely , which is only a little worse than A2CNN 7 . Moreo ver , in these two cases, 13 the pr ecision and r ecall of A2CNN S are also very similar to A2CNN 7 . This can be interpreted as that there is little di ff erence in the distribution between domain A and domain B. Then, for the domain adaptation from A to C and from C to B, we only need to untie the last two fully-connected hidden layers (i.e. A2CNN 2 ) to achie ve the same highest accurac y as A2CNN 7 . Howe ver , the distrib ution di ff erences between domains are not symmetrical. By contrast, for the domain adaptation from C to A and from B to C, we hav e to respectively untie the last six (i.e. A2CNN 6 ) and four (i.e. A2CNN 4 ) layers to achiev e the almost best results. 85 .00% 87 .00% 89 .00% 91 .00% 93 .00% 95 .00% 97 .00% 99 .00% A2 CNN s A2 CNN 1 A2 CNN 2 A2 CNN 3 A2 CNN 4 A2 CNN 5 A2 CNN 6 A2 CNN 7 Ac c u rac y A- >B A- >C B- >A B- >C C- >A C- >B Figure 3: The Parameter influence of the number of untied layers l on A2CNN. 4.6. Networks visualizations Generally , deep learning is an empirical success rather than a mathematical solution to the learning problem. In order to explain why the proposed A2CNN model can achie ve such a great performance in bearing fault diagnosis under v arying working conditions vi vidly , the features extracted by the M S and M T are visualized in this subsection. t-Distributed Stochastic Neighbor Embedding ( t-SNE ) is a technique for dimensionality re- duction that is wildly used for the visualization of deep neural networks. The goal of t-SNE is to take a set of points in a high-dimensional space and find a faithful representation of those points in a lower-dimensional space, typically the 2D plane. In this paper , t-SNE is used to visualize the features extracted by A2CNN. F or more details about t-SNE one can refer to Ref.[43]. T ake the domain adaption task B → C as an e xample, t-SNE is used to visualize the high- dimensional features e xtracted by the source feature extractor M S and the tar get feature extractor M T . The result is sho wn in Figure4. In all subgraphs of Figure 4, features of the source sample { x i S }| N S i = 1 are extracted by M S , i.e., M S ( x i S ) | N S i = 1 . For the tar get sample, features extracted by M S (i.e., M S ( x i T ) | N T i = 1 ) are shown in (a) and features extracted by the fine-tuning M T after 1000 and 2000 iterations are sho wn in (b) and (c). For con venience, these features are denoted by M S ( x S ), M S ( x T ) and M it T ( x T ), where the number of iterations it is selected from { 1000 , 2000 } . There are some interesting observations as follo ws. 1. M S ( x S ), M S ( x T ) and M it T ( x T ) are classifiable when they are diagnosed separately . This illustrates that 1-D CNN used for M S and M T has a very strong ability to distinguish various rolling bearing faults and explains the reason why A2CNN S can ev en achie ve such a good classification accuracy . 2. In Figure4(a), the distrib ution of fault ’0.007 / IF’ is completely di ff erent between domains. This e xplains why A2CNN S has the very lo w recall of 1.13% when adapting from domain B to C. 14 3. During the stage of fine tuning, with the increasing of the adversarial iterations, the distri- butions of features between M S ( x S ) and M it T ( x T ) gradually become consistent. When the features M 1000 T ( x T ) and M 2000 T ( x T ) are applied to fault detection, the accuracies are 99.75% and 99.90% respectiv ely . The observation indicates that the adversarial network is e ff ec- tiv e in improving the domain adaptation capacity of the A2CNN. −100 −50 0 50 100 −60 −40 −20 0 20 40 60 80 (a) −100 −50 0 50 100 −80 −60 −40 −20 0 20 40 60 80 (c) NO 0.007/IF 0.014/IF 0.021/IF 0.007/BF 0.014/BF 0.021/F 0.007/OF 0.014/OF 0.021/OF −100 −50 0 50 100 −80 −60 −40 −20 0 20 40 60 80 (b) NO 0.007/IF 0.014/IF 0.021/IF 0.007/BF 0.014/BF 0.021/F 0.007/OF 0.014/OF 0.021/OF Figure 4: V isualization of the e xtracted features of samples collected from the source domain B and target domain C via t-SNE . Square symbols represent the features of the sample { x i S }| N S i = 1 collected from the source domain B. Cross symbols represent the features of the sample { x i T }| N S i = 1 collected from the tar get domain C. T en di ff erent kinds of faults are denoted by ten di ff erent colors respectiv ely . Finally , we visualize all nodes in the entire A2CNN model, including M S , M T and the soft- max outputs of the label predictor C . W e randomly select a sample of the fault type ’0.007 / IF’ from domain C, denoted by x 0 . 007 / I F C , as the input of the A2CNN model trained for adapting from domain B to domain C. The visualized results are shown in Figure 5(a) and Figure 5(b). From these visual results, we can find out that the output of the first three con volutional layers (i.e. ’Con v1’, ’Con v2’ and ’Conv3’) are very similar . Starting from the fourth layer con volution layer (i.e. ’Con v4’), the extracted features of M S ( x 0 . 007 / I F C ) and M T ( x 0 . 007 / I F C ) gradually change to some extent. This observation is consistent with the result in the section 4.5. That is, for the domain adaptation from B to C, we only have to untie last four layers starting from ’Con v4’ to ’FC2’ as the features extracted from the the first three con volutional layers are almost the same. The last fully-connected layer (i.e. ’FC2’) has K neurons (equals to the number of class label). The output of ’FC2’ is fed to label classifier C to estimate the posterior probability of each class using soft-max regression model. According to the results of ’FC2’ and ’Softmax’ in Figure 5(a), x 0 . 007 / I F C is misdiagnosed as the fault type of ’0.014 / IF’, based on the extracted features of M S ( x 0 . 007 / I F C ). As a contrast, in Figure 5(b), x 0 . 007 / I F C is correctly identified as as the fault type of ’0.007 / IF’, based on the extracted features of M T ( x 0 . 007 / I F C ). 5. Conclusion This paper proposes a adversarial adapti ve model based on 1-D CNN named A2CNN, to address the fault diagnosis problem under varying working condition. T o our best kno wledge, 15 Conv1 Conv2 Conv3 Conv4 Conv5 FC1 FC2 0 2 4 6 8 10 12 14 16 18 20 0 0.1 0.2 0.3 0.4 0.5 0.6 0.7 0.8 0.9 1 NO IF/0.007 IF/0.014 IF/0.021 BF/0.007 BF/0.014 BF/0.021 OF/0.007 OF/0.014 OF/0.021 Softmax (a) M S ( x 0 . 007 / I F C ) and the corresponding soft-max result. Conv1 Conv2 Conv3 Conv4 Conv5 FC1 FC2 0 2 4 6 8 10 12 14 16 18 20 0 0.1 0.2 0.3 0.4 0.5 0.6 0.7 0.8 0.9 1 NO IF/0.007 IF/0.014 IF/0.021 BF/0.007 BF/0.014 BF/0.021 OF/0.007 OF/0.014 OF/0.021 Softmax (b) M T ( x 0 . 007 / I F C ) and the corresponding soft-max result. Figure 5: V isualization of all nodes in M S , M T and the soft-max results of the label predictor C . Domain B is the source domain and domain C is the target domain. 16 this is the first attempt for solving the domain adaptation issues in fault diagnosis by introducing adversarial network. A2CNN contains four parts, a source feature extractor , a target feature e xtractor, a label clas- sifier and a domain discriminator . In order to get the strong fault-discriminativ e and domain- in variant capacity , we adopt the training process similar to Generating Adversarial Network (GAN). First, in order to get fault-discriminativ e features, the source feature extractor is pre- trained with labeled source training examples to minimize the label classifier error . Then, during the adversarial adaptiv e fine tuning stage, the target feature extractor is initialized and trained to maximize the domain classification loss, such that the domain discriminator can’ t predict the do- main label of mapped source and tar get examples reliably . That is to say , instances sampled from the source and target domains hav e similar distributions after mapping. In addition, the layers between the source and tar get feature extractor during the training stage are partially untied to giv e consideration to the training e ffi ciency and the domain adaptability . Results in Section 4 shows that, compared with the state-of-the-art domain adapti ve model WDCNN (AdaBN), the proposed A2CNN achie ve higher accuracy under di ff erent working con- ditions. Besides the commonly used fault diagnostic accur acy , we introduce tw o ne w ev aluation indicators, pr ecision and r ecall , to analyze the sensitivity of the proposed for each type of fault detection. A pr ecision score of 1.0 for a fault type means that there is no false alarm. Whereas a r ecall of 1.0 means that there is no missing alarm. Compared with accuracy , precision and r ecall can ev aluate the reliability of a model for certain type of fault recognition in more detail. This result shows that after adv ersarial training, the classification performance on every class achie ve remarkable improv ement. W e can find that A2CNN can make almost ev ery fault classified into the right class. The high pr ecision and r ecall score of A2CNN implies that our model has fewer false alarms and missed alarms. Finally , through visualizing the feature maps learned by our model, we explore the inner mechanism of proposed model in fault diagnosis and domain adaptation, and v erify that partially untied the layers between the source and target feature e xtractor is correct. References References [1] G. J. V achtse vanos, F . Lewis, A. Hess, B. W u, Intelligent fault diagnosis and prognosis for engineering systems, W iley Online Library , 2006. [2] Z. Qiao, Y . Lei, J. Lin, F . Jia, An adaptive unsaturated bistable stochastic resonance method and its application in mechanical fault diagnosis, Mechanical Systems and Signal Processing 84 (2017) 731–746. [3] P . Albrecht, J. Appiarius, E. Cornell, D. Houghtaling, R. McCoy , E. Owen, D. Sharma, Assessment of the reliability of motors in utility applications, IEEE Transactions on Energy Conversion EC-2 (3) (1987) 396–406. doi:10. 1109/TEC.1987.4765865 . [4] A. K. S. Jardine, D. Lin, D. Banje vic, A re view on machinery diagnostics and prognostics implementing condition- based maintenance, MECHANICAL SYSTEMS AND SIGNAL PROCESSING 20 (7) (2006) 1483–1510. doi: {10.1016/j.ymssp.2005.09.012} . [5] L. Y a-Guo, H. Zheng-Jia, Advances in applications of hybrid intelligent fault diagnosis and prognosis technique [j], Journal of V ibration and Shock 9 (2011) 030. [6] K. He, G. Gkioxari, P . Doll ´ ar , R. Girshick, Mask r-cnn, in: Computer V ision (ICCV), 2017 IEEE International Conference on, IEEE, 2017, pp. 2980–2988. [7] L.-C. Chen, G. Papandreou, I. Kokkinos, K. Murphy , A. L. Y uille, Deeplab: Semantic image segmentation with deep conv olutional nets, atrous convolution, and fully connected crfs, IEEE transactions on pattern analysis and machine intelligence 40 (4) (2018) 834–848. 17 [8] W . Xiong, J. Droppo, X. Huang, F . Seide, M. Seltzer, A. Stolcke, D. Y u, G. Zweig, The microsoft 2016 conversa- tional speech recognition system, in: Acoustics, Speech and Signal Processing (ICASSP), 2017 IEEE International Conference on, IEEE, 2017, pp. 5255–5259. [9] Y . Zhang, W . Chan, N. Jaitly , V ery deep conv olutional networks for end-to-end speech recognition, in: Acoustics, Speech and Signal Processing (ICASSP), 2017 IEEE International Conference on, IEEE, 2017, pp. 4845–4849. [10] F . Jia, Y . Lei, J. Lin, X. Zhou, N. Lu, Deep neural networks: A promising tool for fault characteristic mining and intelligent diagnosis of rotating machinery with massiv e data, Mechanical Systems and Signal Processing 72 (2016) 303 – 315. doi:http://dx.doi.org/10.1016/j.ymssp.2015.10.025 . [11] Z. Huijie, R. Ting, W . Xinqing, Z. Y ou, F . Husheng, Fault diagnosis of hydraulic pump based on stacked autoen- coders, in: Electronic Measurement & Instruments (ICEMI), 2015 12th IEEE International Conference on, V ol. 1, IEEE, 2015, pp. 58–62. [12] L. Guo, H. Gao, H. Huang, X. He, S. Li, Multifeatures fusion and nonlinear dimension reduction for intelligent bearing condition monitoring, Shock and V ibration 2016. [13] N. K. V erma, V . K. Gupta, M. Sharma, R. K. Sev akula, Intelligent condition based monitoring of rotating machines using sparse auto-encoders, in: Prognostics and Health Management (PHM), 2013 IEEE Conference on, IEEE, 2013, pp. 1–7. [14] F . AlThobiani, A. Ball, et al., An approach to fault diagnosis of reciprocating compressor v alves using teager–kaiser energy operator and deep belief networks, Expert Systems with Applications 41 (9) (2014) 4113–4122. [15] M. Gan, C. W ang, et al., Construction of hierarchical diagnosis network based on deep learning and its application in the fault pattern recognition of rolling element bearings, Mechanical Systems and Signal Processing 72 (2016) 92–104. [16] J. T ao, Y . Liu, D. Y ang, Bearing fault diagnosis based on deep belief network and multisensor information fusion, Shock and V ibration 2016. [17] A. Krizhe vsky , I. Sutske ver, G. E. Hinton, Imagenet classification with deep con volutional neural networks, in: Advances in neural information processing systems, 2012, pp. 1097–1105. [18] Y . LeCun, L. Bottou, Y . Bengio, P . Ha ff ner, Gradient-based learning applied to document recognition, Proceedings of the IEEE 86 (11) (1998) 2278–2324. [19] K. Simonyan, A. Zisserman, V ery deep conv olutional networks for large-scale image recognition, arXiv preprint [20] K. He, X. Zhang, S. Ren, J. Sun, Deep residual learning for image recognition, in: Proceedings of the IEEE conference on computer vision and pattern recognition, 2016, pp. 770–778. [21] C. Sze gedy , S. Io ff e, V . V anhoucke, A. A. Alemi, Inception-v4, inception-resnet and the impact of residual connec- tions on learning., in: AAAI, 2017, pp. 4278–4284. [22] T . Ince, S. Kiranyaz, L. Eren, M. Askar, M. Gabbouj, Real-time motor fault detection by 1-d conv olutional neural networks, IEEE T ransactions on Industrial Electronics 63 (11) (2016) 7067–7075. [23] X. Guo, L. Chen, C. Shen, Hierarchical adaptive deep con volution neural network and its application to bearing fault diagnosis, Measurement 93 (2016) 490–502. [24] F . Shen, C. Chen, R. Y an, R. X. Gao, Bearing fault diagnosis based on svd feature extraction and transfer learning classification, in: Prognostics and System Health Management Conference (PHM), 2015, IEEE, 2015, pp. 1–6. [25] W . Lu, B. Liang, Y . Cheng, D. Meng, J. Y ang, T . Zhang, Deep model based domain adaptation for fault diagnosis, IEEE T ransactions on Industrial Electronics 64 (3) (2017) 2296–2305. [26] W . Zhang, G. Peng, C. Li, Y . Chen, Z. Zhang, A new deep learning model for fault diagnosis with good anti-noise and domain adaptation ability on raw vibration signals, Sensors (Basel, Switzerland) 17 (2) (2017) 425. [27] W . Zhang, C. Li, G. Peng, Y . Chen, Z. Zhang, A deep con volutional neural network with new training methods for bearing fault diagnosis under noisy environment and di ff erent working load, Mechanical Systems and Signal Processing 100 (2018) 439–453. [28] I. Goodfellow , J. Pouget-Abadie, M. Mirza, B. Xu, D. W arde-Farley , S. Ozair, A. Courville, Y . Bengio, Generati ve adversarial nets, in: Advances in neural information processing systems, 2014, pp. 2672–2680. [29] S. J. Pan, Q. Y ang, A survey on transfer learning, IEEE Transactions on Knowledge and Data Engineering 22 (10) (2010) 1345–1359. [30] H. Shimodaira, Improving predictive inference under covariate shift by weighting the log-likelihood function, Jour- nal of Statistical Planning and Inference 90 (2) (2000) 227 – 244. [31] M. Sugiyama, T . Suzuki, S. Nakajima, H. Kashima, P . von B ¨ unau, M. Ka wanabe, Direct importance estimation for cov ariate shift adaptation, Annals of the Institute of Statistical Mathematics 60 (4) (2008) 699–746. [32] J. Huang, A. J. Smola, A. Gretton, K. M. Borgwardt, B. Scholkopf, Correcting sample selection bias by unlabeled data, in: Proceedings of the 19th International Conference on Neural Information Processing Systems, MIT Press, Cambridge, MA, USA, 2006, pp. 601–608. [33] B. Zadrozny , Learning and ev aluating classifiers under sample selection bias, in: Proceedings of the 21st Interna- tional Conference on Machine Learning, A CM, New Y ork, NY , USA, 2004, pp. 114–122. 18 [34] S. Ben-David, J. Blitzer, K. Crammer , A. Kulesza, F . Pereira, J. W . V aughan, A theory of learning from di ff erent domains, Machine Learning 79 (1) (2010) 151–175. doi:{10.1007/s10994- 009- 5152- 4} . [35] S. Ben-David, J. Blitzer, K. Crammer , F . Pereira, Analysis of representations for domain adaptation, in: Proceedings of the 19th International Conference on Neural Information Processing Systems, NIPS’06, MIT Press, Cambridge, MA, USA, 2006, pp. 137–144. [36] I. J. Goodfellow , J. Pouget-Abadie, M. Mirza, B. Xu, D. W arde-Farle y , S. Ozair , A. C. Courville, Y . Bengio, Generativ e adversarial nets, in: Adv ances in Neural Information Processing Systems 27: Annual Conference on Neural Information Processing Systems 2014, December 8-13 2014, Montreal, Quebec, Canada, 2014, pp. 2672– 2680. URL http://papers.nips.cc/paper/5423- generative- adversarial- nets [37] F . Zhuang, X. Cheng, P . Luo, S. J. Pan, Q. He, Supervised representation learning: Transfer learning with deep autoencoders, in: Proceedings of the 24th International Conference on Artificial Intelligence, IJCAI’15, AAAI Press, 2015, pp. 4119–4125. [38] J. Friedman, T . Hastie, R. Tibshirani, Regularization paths for generalized linear models via coordinate descent, Journal of Statistical Software, Articles 33 (1) (2010) 1–22. [39] Y . Ganin, V . S. Lempitsky , Unsupervised domain adaptation by backpropagation., in: F . R. Bach, D. M. Blei (Eds.), ICML, V ol. 37 of JMLR W orkshop and Conference Proceedings, JMLR.org, 2015, pp. 1180–1189. [40] E. Tzeng, J. Ho ff man, T . Darrell, K. Saenko, Simultaneous deep transfer across domains and tasks, CoRR abs / 1510.02192. . URL [41] E. Tzeng, J. Ho ff man, K. Saenko, T . Darrell, Adversarial discriminativ e domain adaptation, in: Proceedings of the 2017 IEEE Conference on Computer V ision and Pattern Recognition, CVPR’17, 2017, pp. 2962–2971. [42] A. Rozantsev , M. Salzmann, P . Fua, Beyond sharing weights for deep domain adaptation, CoRR abs / 1603.06432. arXiv:1603.06432 . URL [43] A. Prezgonzlez, M. V ergara, J. L. Sanchobru, L. J. P . V an, Der Maaten, G. E. Hinton, D. Shanmugapriya, G. Pad- mav athi, J. Kubo, P . E. E. Gantz, I. Science, V isualizing data using t-sne, Journal of Machine Learning Research 9 (2605) (2008) 2579–2605. 19
Original Paper
Loading high-quality paper...
Comments & Academic Discussion
Loading comments...
Leave a Comment