Single-Channel Blind Source Separation for Singing Voice Detection: A Comparative Study
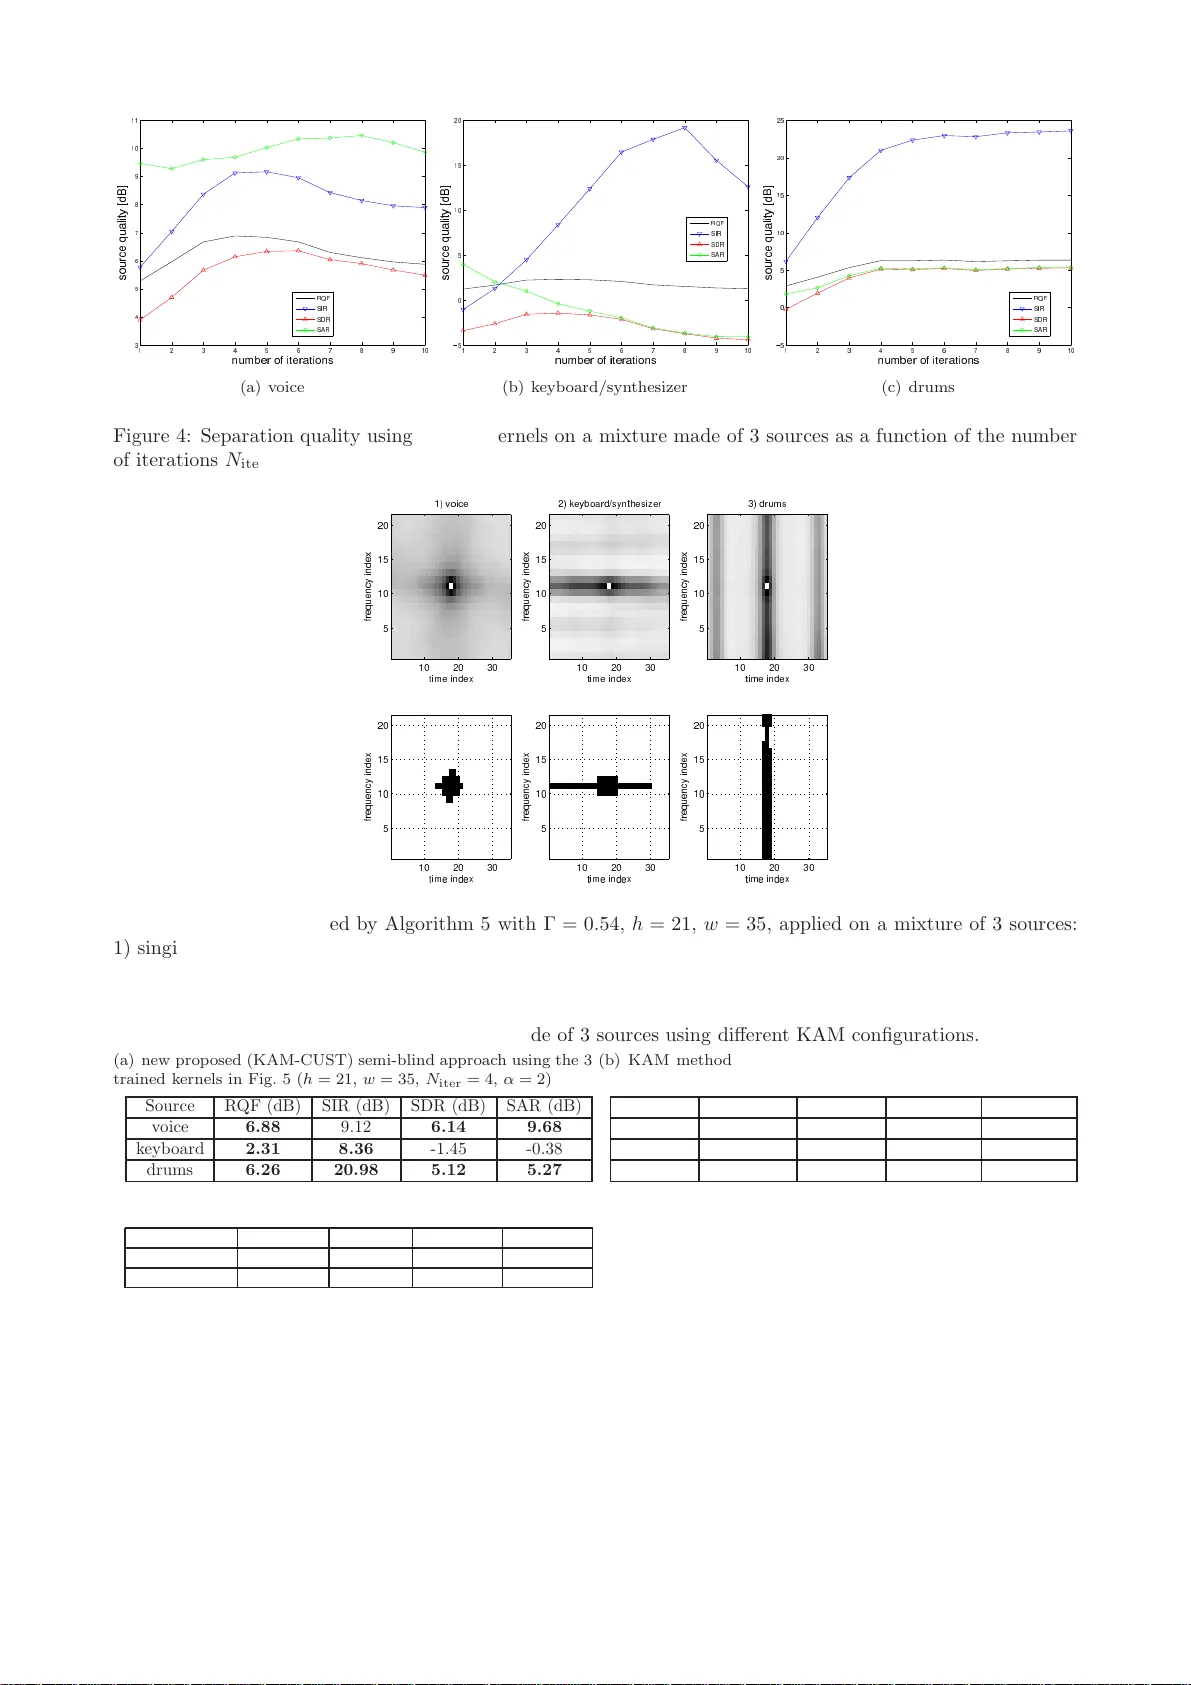
We propose a novel unsupervised singing voice detection method which use single-channel Blind Audio Source Separation (BASS) algorithm as a preliminary step. To reach this goal, we investigate three promising BASS approaches which operate through a m…
Authors: Dominique Fourer, Geoffroy Peeters
Single-Channel Blind Source Separation for S inging V oice Detection: A Comparativ e Study Dominique F ourer and Geoffroy P eeters Ma y 4, 2 018 Abstract W e prop ose a no vel unsup ervised singing voice detection meth o d whic h u se single-channel Blind Au dio Source Separation (BASS) algorithm as a preliminary step. T o reac h this goal, we inv estigate th ree promising BASS approaches which operate th rough a morph ological filtering of the analyzed mixture sp ectrogram. The con tribu tions of this pap er are manyfold. First, the inves tigated BAS S metho ds are rew orded with the same formalism and we in vestig ate their resp ective hyperparameters by numerical simulatio ns. Second, we prop ose an extension of t he KAM metho d for whic h we prop ose a n o vel training algorithm used to compute a source-sp ecific kernel from a given isolated source signal. S econd, th e BASS method s are compared together in terms of source separation accuracy and in terms of singing voice detection accuracy when they are used in our new singing voi ce detection framework. Finally , we d o an exhaustive singing voice detection ev aluation for which we compare b oth sup ervised and u nsup ervised singing voice detection meth od s. Ou r comparison explores different combination of the prop osed BASS metho ds with new features such as the new prop osed K AM features and th e scattering transform through a machine learning framewo rk and also considers conv olutional neural netw orks metho ds. 1 In tro duction Audio s o urce separ ation aims a t recovering the is olated sig nals of ea ch sour ce ( i.e. each instrumental pa rt) which comp oses a n observed mixture [1, 2]. Although h umans can eas ily recog nize the different s o und entities which are active at each time instant, this task remains challenging when it has to b e auto matically completed by an unsup er vised algo rithm. Mathematically sp eak ing, Blind Audio Source Separation (BASS) is an “ill-p os ed problem” in the se nse of Hadama rd [3 ], howev er it r e ma ins intensively studied since ma ny decades [1, 4 – 7]. In fact, BASS is full of interest b ecaus e it can find many applications such a s music remix ing (k a raoke, re- spatialization, source manipulatio n), and signal enhancement (denoising). Thus, BASS ca n directly b e used as a part o f a sig nal detection metho d ( i.e. singing voice), in relation with the so urce separa tio n mo del. This study , addresses the single- channel blind case, whe n several s ources s i ( i ∈ [1 , I ], with I ≥ 2 ) ar e present in a unique insta nt aneous mixtur e x ex pr essed a s: x ( t ) = I X i =1 s i ( t ) . (1) Despite the simplicity o f the mixture mo del of E q. (1 ), this configuration is more challenging to so lve than multi- channel mixtures. In fact, multi-c hannel metho ds such as [2, 8] require at least 2 distinct o bserved mixtures with a sufficie nt ortho gonality in the time-freque nc y plane b etw een the sources , to provide s a tisfying separ ation results. As w e addres s the under determined case (where the num ber of sources is greater tha n the num ber of observ a tions), Indep endent Comp one nt Analysis (ICA) metho ds can neither b e dir ectly use d [1]. Mor eov er, metho ds inspired by Computational Auditory Scene Analysis (CASA) [9], such as [5, 1 0, 11], a re often not robust enough for pro cessing rea l-world music mixtures a nd sho uld b e address ed thro ugh a n Informed Source Separation (ISS) framework using s ide-information in a co der-dec o der sc heme as pr op osed in [12]. F or all these rea sons, w e focus o n another class of ro bust BASS metho ds based on time-frequency repr esen- tation morpholo gical filtering. These metho ds as sume that the foreg round voice and the instrumental music background hav e significantly different time-frequency reg ularities which ca n b e exploited to assig n each time- frequency p oint to a so urce. T o illustrate this idea , vertical lines can b e obs erved in a drum set sp ectrogr am due the sp ectral regularities at each instant, contrarily to an har monic s o urce which has ho rizontal lines due to the regular ities ov e r time of each active frequency ( i.e. the par tials). A recent compar a tive study [13] lea ds us to thr e e very promising a pproaches w hich can b e summariz e d as fo llows. 1) T otal v aria tion appro ach prop osed by Jeong and Lee [14], aims at minimizing a co nv ex auxiliar y function, related to the temp ora l co nt in uit y (for harmonic sources), the spe c tral contin uit y (for p ercussive sounds) and the spa rsity for the leading sing ing voice. The solutions provides estimates of the sp e ctrogra m of each source. 1 2) Robust P rincipal Comp onent Analysis (RPCA) [15] is used for voice/m usic separ ation in [16]. This techn ique decomp oses the mixture s pec trogra m into tw o matrices : a low ra nk matrix as so ciated to the sp ec- trogra m of the re petitive m usical background (the accompa niment), a nd a sparse matrix asso cia ted to the lea d instrument whic h plays the melo dy . 3) Kernel Additiv e Mo deling (K AM) a s for malized in [1 7], unifies several BASS approaches int o the same framework: REPET [18] and Harmonic Percussive Source Separatio n (HPSS) thr o ugh media n filtering [1 9]. Both metho ds use the source-sp ecific regularities in their time-frequency representations to compute a source separatio n mask . Hence, each so urce is characterized by a kernel which mo dels the vicinit y of each time- frequency p oint in a sp ectro gram. This allows to estimate each source using a median filter based on its s pe c ific kernel. This idea w as extended throug h other s ource-sp ecific kernels in [17, 20–22] and in the pre s ent pap er. Thu s, the purp ose of this work is first to unify these BASS metho ds into the same framework to seg regate a mo na ural mixture into 3 comp onents corresp o nding to the p ercussive part, the harmonic background and the sing ing voice. Second, we int ro duce a ne w uns up er vised sing ing voice detectio n metho d which can use any BASS metho d as a prepro cessing step. Finally , the BASS metho ds a r e co mpared together in ter ms of separatio n quality and in terms o f singing voice detection accuracy . Our ev aluation als o considers a compariso n with s upe r vised state-of-the-ar t singing voice detectio n methods such as [23] which uses deep Convolutional Neural Netw orks (CNN). This pap er is o r ganized as follows. In Sectio n 2, we shortly desc r ib e the prop osed B ASS metho ds with an extension of the K AM metho d for sour ce-sp ecific kernel training . In Sectio n 3, we in tro duce our framework for singing voice detection based on BASS. In Section 4, compa rative results fo r sour ce separ ation and sing ing voice detection ar e presented. Finally , co nclusion and future works are discussed in Section 5. 2 Source separation thr ou gh sp ectrogram morphological filtering 2.1 T ypical Algorithm and Oracle Metho d W e inv estigate thre e promising BASS metho ds based on morphologica l filtering of the mixture’s sp ectrogr am (defined a s the square d mo dulus of its Short-Time F our ier T ra nsform (STFT) [24]). Each metho d aims at estimating the re a l-v alued non-negative matrices of size F × T , whic h cor resp ond to the source separation masks M v , M h and M p , resp ectively as so ciated to the voice, the har monic accompaniment and the p ercussive part. Thus, a typical a lgorithm using a ny BASS metho d, can b e formulated by Algorithm 1. Algorithm 1: Typical BASS alg orithm based on mor pho logical filtering. STFT() and invSTFT() compute resp ectively the STFT and its inv erse from a discrete-time signal. Data: x : o bserved mixture, α : user par ameter ( cf. Fig. 1) Result: ˆ s i : estimated s ource s ig nals, ˆ S i : STFTs o f the estimated sources X ← STFT( x ) ( M v , M h , M p ) ← BASSMetho d | X | 2 for i ∈ { v , h, p } do ˆ S i ← | M i | α P j ∈{ v ,h,p } | M j | α X ˆ s i ← invSTFT ( ˆ S i ) In this algor ithm, | M i | α P j ∈{ v ,h,p } | M j | α approximates the para meter ized Wiener filter [27] of the sour ce i , for which an optimal v alue of | M i | α in the minimal Mea n Squared Error (MSE) se nse, cor r esp onds to the sour ce’s sp ectral density [28]. In pr actice, the effect of par ameter α on the sepa ration qua lity is illustr a ted in Fig. 1 which shows the results provided by Algorithm 1 when applied on a mixture made of 3 a udio sources (voice, keyboard/ synthesizer and drums). This ex p er iment uses a n ora cle BASS metho d ( i.e. original so urces are assumed known) which sets the source mask as the mo dulus of the STFT of each so urce such as M i = | S i | . The highest median of the MSE-base d results ( cf. Fig. 1 (a)-(b)) is r eached with α ≈ 2. Interestingly , b est p e r ceptual results are reached with α ≈ 1 ( cf. Fig. 1 (c)-(d)). A detailed description of Signal-to- Int erference Ratio (SIR), Signal-to-Artifac t Ratio (SAR) and Signal- to -Distortion Ra tio (SDR) meas ur es can be found in [25, 26]. The Reconstruction Q uality F actor (RQF) ( cf. Fig . 1 (a)) is defined as [29]: RQF( s, ˆ s ) = 10 lo g 10 P n | s [ n ] | 2 P n | s [ n ] − ˆ s [ n ] | 2 , where s and ˆ s stand resp ectively for the original so urce a nd its e s timation. 2.2 T ot al V ariation Approach Blind so ur ce s eparation can b e addressed a s a n optimization pro blem solved using a total v a r iation regular - ization. This a pproach has successfully been use d in ima ge pro cessing for noise remov al [3 0]. It co nsists in 2 ✵ ✁ ✂ ✶ ✄ ☎ ✆ ✷ ✝ ✞ ✟ ✸ ✠ ✡ ☛ ✹ ☞ ✌ ✍ ✺ ✎ ✏ ✑ ✒ ✓ ✔ ✕ ✖ ✗ ✘ ✙ ✚ ✛ ✜ ✢ ✣ ❛ ✤ ✥ ✦ ✧ ★ ✩ ✪ ✫ ✬ ✭ ✮ ✯ ✰ ✱ ✲ ✳ ✴ ✻ ✼ ✽ ✾ ✿ ❀ ❁ ❂ ❜❃❄❅ ❆❇❈❉❊ ❋ ●❍■❏❑ ▲ ▼◆ ❖P◗ ❘❙❚ ❯❱❲ ❳❨❩ ❬❭❪ (a) ob jectiv e results ✵ ✁ ✂ ✶ ✄ ☎ ✆ ✷ ✝ ✞ ✟ ✸ ✠ ✡ ☛ ✹ ☞ ✌ ✍ ✺ ✎ ✏ ✑ ✒ ✓ ✔ ✕ ✖ ✗ ✘ ✙ ✚ ❛ ✛ ✜ ✢ ✣ ✤ ✥ ✦ ✧ ★ ✩ ✪ ✫ ✬ ✭ ✮ ✯ ✰ ✱ ✲ ✳ ✴ ✻ ✼ ✽ ✾ ❜✿❀❁ ❂❃❄❅❆ ❇ ❈❉❊❋● ❍ ■❏ ❑▲▼ ◆❖P ❙◗❘ ❚❯❱ ❲❳❨ (b) ob jectiv e results ✵ ✁ ✂ ✶ ✄ ☎ ✆ ✷ ✝ ✞ ✟ ✸ ✠ ✡ ☛ ✹ ☞ ✌ ✍ ✺ ✎ ✏ ✑ ✒ ✓ ✔ ✕ ✖ ✗ ✘ ✙ ✚ ✛ ✜ ✢ ✣ ✤ ✥ ✦ ✧ ★ ✩ ✪ ✫ ✬ ✭ ❛ ✮ ✯ ✰ ✱ ✲ ✳ ✴ ✻ ✼ ✽ ✾ ✿ ❀ ❁ ❂ ❃ ❄ ❅ ❆ ❇ ❈ ❉ ❊ ❋ ● ❜❍■❏ ❑▲▼◆❖ P ◗❘❙❚❯ ❱ ❲❳ ❨❩❬ q❭❪❫ ❴❵❝ ❞❡❢❣❤✐ ❥ ❦❧♠ ♥♦♣ rst✉✈✇① (c) p erceptual results ✵ ✁ ✂ ✶ ✄ ☎ ✆ ✷ ✝ ✞ ✟ ✸ ✠ ✡ ☛ ✹ ☞ ✌ ✍ ✺ ✎ ✏ ✑ ✒ ✓ ✔ ✕ ✖ ✗ ✘ ✙ ✻ ✚ ✼ ✛ ✽ ✜ ❛ ✢ ✣ ✤ ✥ ✦ ✧ ★ ✩ ✪ ✫ ✬ ✭ ✮ ✯ ✰ ✱ ✲ ✳ ✴ ✾ ✿ ❀ ❁ ❂ ❃ ❜❄❅❆ ❇❈❉❊❋ ● ❍■❏❑▲ ▼ ◆❖ P◗❘ ❙❚❯ ❱❲❳ ❨❩❬ ❭❪❫ (d) p erceptual results Figure 1: Effect o f par ameter α in Algo rithm 1 on the source sepa ration quality of a musical mixture made of 3 sources. Measures are e x pressed in terms of BSS Ev al v2 [25] (a ), BSS Ev a l v 3 [26] (b)-(d) which also assess the p erce ptua l qua lit y (high v alues are b etter). minimizing a conv ex a uxiliary function which depe nds on r egulariza tion par ameters λ 1 , λ 2 to co ntrol the rela- tive imp ortance of the smo othness of the ex p ected mask s M h and M p resp ectively ov er time and frequencies . This choice is justified by the harmo nic or sp ectral stability o f M h and M p , and the spars it y of M v . Being a discrete-time signal x [ n ] and its discre te STFT, X [ n, m ], where n = 1 ...T a nd m = 1 ...F , are the time and frequency indices such as t = nT s and ω = 2 π m F T s , T s being the sampling p erio d. The Jeong- L e e-14 metho d [14] minimizes the following auxiliar y function: J ( M v , M h , M p ) = 1 2 X n,m ( M h [ n − 1 , m ] − M h [ n, m ]) 2 + λ 1 2 X n,m ( M p [ n, m − 1] − M p [ n, m ]) 2 + λ 2 X n,m | M v [ n, m ] | (2) sub ject to: M v + M h + M p = | X | 2 γ with: M v [ n, m ] , M h [ n, m ] , M p [ n, m ] ≥ 0 . Hence, solving ∂ J ( M v ,M h ,M p ) ∂ M h = 0 and ∂ J ( M v ,M h ,M p ) ∂ M p = 0 , allows to derive up date r ules which lead to an iterative metho d formulated by Algor ithm 2 [14]. According to the authors, the b est sepa ration r e sults are obtained with 16 k Hz-sampled signal mixtures, using 64 ms-lo ng 3 4 -ov erlapp ed analysis frames, in combination with a 120 Hz high-pass filter applied o n the mixture, and using metho d par ameters: λ 1 = 0 . 25, λ 2 = 10 − 1 λ 1 , γ = 1 4 ( i.e. α = 2) and N iter = 200. 2.3 Robust Principal Comp onen t Analysis In a musical mixture, the background acc o mpaniment is often re petitive while the ma in melo dy play ed by the singing voice c o ntains har mo nic and frequency mo dulated co mpo nents with a non-redundant str uc tur e. This prop erty allows a decomp o s ition of the mixture sp ectro gram W = | X | 2 int o tw o distinct matrices where the background a ccompaniment sp ectro gram is asso ciated to a low ra nk matrix, and the foregr ound s inging voice is asso ciated to a spa rse matr ix ( i.e. where most of the elements a re zeros or close to zero). Thus, a solution inspired from the image pro cessing metho ds is provided by RPCA [15] which deco mpo ses a non-neg ative matr ix W in to a sum o f t wo ma trices M hp and M v , through an optimiza tion pro cess. It can b e formulated as the minimization o f the following auxiliary function expr essed as: J ( M hp , M v ) = || M hp || ∗ + λ || M v || 1 (3) sub ject to: W = M hp + M v 3 Algorithm 2: Jeo ng-Lee-1 4’s BASS algor ithm. Data: x : o bserved mixture, λ 1 , λ 2 , γ : user para meters, N iter : num b er o f iterations Result: ˆ s i : estimated s ource s ig nals, ˆ S i : STFTs o f the estimated sources X ← STFT( x ) W ← | X | 2 γ M h ← 0 , M p ← 0 for it ← 1 to N iter do M h [ n,m ] ← min M h [ n +1 ,m ]+ M h [ n − 1 ,m ] 2 + λ 1 2 , W [ n, m ] − M p [ n,m ] ) M p [ n,m ] ← min M p [ n,m +1]+ M p [ n,m − 1] 2 + λ 1 2 λ 2 , W [ n, m ] − M h [ n,m ] ) M v ← W − ( M h + M p ) for i ∈ { v , h, p } do ˆ S i ← | M i | 1 2 γ P i | M i | 1 2 γ X ˆ s i ← invSTFT ( ˆ S i ) with || M hp || ∗ = P k σ k ( M hp ) the nuclear norm of ma trix M hp , σ k being its k -th singular v alue, and || M v || 1 = P n,m | M v [ n, m ] | being the l 1 -norm of the matrix M v . Here, λ denotes a damping parameter which should be optimally chosen as λ = 1 √ max( T ,F ) [15, 16]. Eq. (3) is then solved by the a ugmented Lagrang ian metho d whic h leads to the following new auxilia ry function (adding new v a riable Y ): J ( M hp , M v , Y ) = || M hp || ∗ + λ || M v || 1 + h Y , W − M hp − M v i + µ 2 || W − M hp − M v || 2 F (4) where h a, b i = a T b , and µ is a Lag rangian multiplier. Thus, Eq. (4) is efficiently minimized throug h the Principa l Comp onent Purs uit algor ithm [31] formulated by Algor ithm 3. O ur empirical exp er iments on rea l-word audio signals show that µ = 1 0 λ and N iter = 1000 provide satisfying r esults. Algorithm 3: Pr incipal Comp onent Pursuit by alterna ting directions algor ithm [3 1]. Data: W : sp ectrog ram of the mixture, λ, µ : damping parameter s, N iter : num b er of iterations Result: L = M hp , S = M v : separ ation masks for the voice (v) and the m usic acco mpa nimen t (hp) S ← 0, Y ← 0 for it ← 1 to N iter do L ← argmin L J ( L, S, Y ) S ← arg min S J ( L, S, Y ) Y ← Y + µ ( W − L − S ) F or the sake of computation efficiency , it can b e shown that the up date r ules in Algo rithm 3 can b e co mputed as [15]: argmin L J ( L, S, Y ) = S λµ − 1 ( W − L + µ − 1 Y ) (5) with S τ ( x ) = sig n( x ) max( | x | − τ , 0) argmin S J ( L, S, Y ) = D µ − 1 ( W − S + µ − 1 Y ) (6) with D τ ( X ) = U S τ (Σ) V ∗ where X = U Σ V ∗ is the s ingular v alue decomp os ition of matrix X and V ∗ denotes the conjugate tra nsp ose of matr ix V ( i.e. V is the matrix where ea ch column is a right-singular vector). Finally , each source signa l is recov ered using the estimated separation masks M v (equal to the sparse matr ix S ) and M hp (equal to the low- rank matrix L ), through the par ameterized Wiener filter applied on the STFT o f the mixtur e as in Alg orithm 1. 2.4 Kernel Additive Mo deling The KAM approach [17, 21] is inspired from the lo cally w eighted r egressio n theory [32]. The ma in idea as sumes that the sp ectro gram of a so ur ce is lo cally regula r. In other words, it means that the vicinity of each time- frequency p oint ( t, ω ) in a sourc e’s sp ectro g ram can b e predicted. Thus, the K AM framework allows to mo de l 4 source-s p ecific assumptions such as the har monicity of a s ource (characterize d by horizontal lines in the sp e c tro- gram), p ercussive sounds (characterize d by vertical lines in the sp ectr ogra m) or rep etitive sounds (c haracteriz e d by r ecurrent s hap es s pa ced by a time p erio d in the sp ectro gram). A KAM-bas ed source separation metho d can be implemen ted a ccording to Algorithm 4 using the desired source - sp ecific kernels K b i corres p o nding to binary matrices o f size h × w as illustra ted in Fig. 2. Algorithm 4: KAM-ba sed sour ce separatio n algorithm. Data: X : mixture STFT, K b i : kernel of each sour ce i ≤ I , α : user para meter , N iter : num b er of itera tions Result: ˆ s i : estimated s ource s ig nals, ˆ S i : STFTs o f the estimated sources ˆ S i ← X I , ∀ i ∈ [1 , I ] for it ← 1 to N iter do for n ← 1 to T and m ← 1 to F do for i ← 1 to I do M i ← median ˆ S i [ n + c ′ − w − 1 2 , m + l ′ − h − 1 2 ] , ( c ′ , l ′ ) : K b i ( c ′ , l ′ ) = 1 ˆ S i [ n, m ] ← | M i | α P I j =1 | M j | α X [ n , m ], ∀ i ∈ [1 , I ] ˆ s i ← invSTFT ˆ S i , ∀ i ∈ [1 , I ] 2.4.1 Ho w to c ho ose a Kernel for source separation? Figure 2: Illustration of several p os sible kernels [17], (a) for p erc us sive sour ces, (b) for har monic sources, (c) for rep etitive ele ments a nd (d) for smo othly v ar ying sources (e.g . voca l). As a kernel aims at mo deling the vicinity a t ea ch p oint of a time-freque nc y repres entation, several typical kernels can b e extr a cted from the literature as presented in Fig . 2 . HPSS metho ds using media n filtering [19, 3 3] c a n use: (a)+(b) . Algor ithms suc h as the RE PET algorithm [18, 34], which can separate vocal from accompaniment uses: (c)+(d) . These metho ds use the rep etition rate denoted T in Fig . 2, corr esp onding to the music temp o. F or a m usical piece T can b e constant such as prop o s ed in [1 8] or time-v arying (adaptive) a s in [33]. Another question is how to c ho ose the s ize of a kernel in o rder to optimize the sepa r ation quality? An empirical ans wer provided b y grid sear ch is illustrated in Fig. 3 w hich shows the be st choice for h a nd w , to maximize the separa tion quality mea sures (RQF, SIR, SDR, SAR). F or this exp eriment the STFT of a signal sampled at F s = 22 . 05 kHz is co mputed us ing a Hann w indow o f leng th N = 2048 samples ( ≈ 92 ms) and an ov erlap r atio b etw een adjacent frames equal to 3 4 . The separation is obtaine d using tw o distinct kernels ( cf. Fig. 2 (a)+(b) ), to provide 2 so urces from a mixture made of a singing voice s ignal and drums. In this exp eriment, the b est SIR equal to 18.2 3 dB is obtained with h = 21 and w = 35. T his is an excellent separation quality in comparison with the orac le BASS metho d used in Fig. 1 . R QF, SDR and SAR r elated to signa l quality , are a lso sa tisfying but not optimal. 2.4.2 T o wards a training metho d for sup ervised KAM- based source separation T o the bes t of our k nowledges, no dedicated metho d exists to auto matically define the b est source-s pec ific kernel to use through a KAM-ba s ed BASS metho d. Hence, a classica l appr oach consists of an empirical choice of a 5 ❜ ✁✂ ✄ ☎ ✆ ✝ ✞ ✟ ✠ ✡ ☛ ☞ ✌ ✍ ✎ ✏ ✑ ✒ ✓ ✔ ✕ ✖ ✗ ✘ ✙ ❤ ✇ ✶ ✚ ✷ ✛ ✸ ✜ ✹ ✢ ✺ ✣ ✤ ✥ ✦ ✧ ★ ✩ ✪ ✫ ✬ ✭ ✮ ✯ ✰✱ ✲ ✳ ✴ ✵ ✻ ✼ ✽ ✾ ✿ ❀ ❁ ❂ ❃ ❄ ❅ ❆ ❇ ❈ ❉ ❊ ❋ ● ❍ ■ ❏ ❑ ▲ ▼ ◆ ❖ P ◗ ❘ ❙ ❚ ❯ ❱ ❲ ❳ ❨ ❩ ❬ ❭ ❪ ❫ ❴ ❵ ❛ ❝❞ ❡ ❢ ❣ ✐ ❥ ❦ ❧ ♠ ♥ ♦ ♣ q r s t ✉ ✈ ① ② ③ ④ ⑤ ⑥ ⑦ ⑧ ⑨ ⑩ ❶ ❷ ❸ ❹ ❺ ❻ ❼ ❽ ❾ ❿ ➀ ➁ ➂ ➃ ➄ ➅ ➆ ➇ ➈ ➉ ➊➋ ➌ ➍ ➎ ➏ ➐ ➑ ➒ ➓ ➔ → ➣ ↔ ↕ ➙ ➛ ➜ ➝ ➞ ➟ ➠ ➡ ➢ ➤ ➥ ➦ ➧ ➨ ➩ ➫ ➭ ➯ ➲ ➳ ➵ ➸ ➺ ➻ ➼ ➽ ➾ ➚ ➪ ➶ ➹ ➘ Figure 3: Compar ison of the separatio n quality , measured in terms of RQF, SIR, SDR, SAR [25], as a func- tion of h and w , the dimensions of the se pa ration kernels. W e co nsidered a musical piece made of 2 so urces (voice/drums). A darker red co lor corr esp onds to a b etter separatio n qua lit y . predefined typical kernel and of its size . T o this end, we pro po se a new metho d depicted by Algorithm 5 , which provides a s ource-sp ecific kernel K b i ∈ { 0 , 1 } h × w asso ciated to the s o urce i . The main idea co nsists in mo deling the vicinit y of ea ch time- fr equency point thro ugh a n averaged neig hborho o d ma p obta ined after visiting each co ordinate of a source sp ectr ogra m. The resulting kernel denoted K i ∈ R h × w is then binarize d in o rder to b e directly used by the KAM metho d, through a user-defined threshold Γ such as: K b i [ c, l ] = ( 1 if K i [ c, l ] > Γ 0 otherwise . (7) Our new metho d ba s ed o n custo mized kernels (KAM-CUST) is applied o n musical signals in Fig. 5. The results clearly illus trate the different trained sour ce-sp ecific kernels betw een singing voice, keyboar d/synthesizer and drums as in Fig. 2. Algorithm 5: KAM training algor ithm 1 . Data: S i : a s ource STFT Result: K i ∈ R h × w , h and w b eing o dd integers. K j [ c, l ] ← 0, ∀ c ∈ [1 , w ], ∀ l ∈ [1 , h ], and ∀ j ∈ [1 , T F ] p j ← 0 , ∀ j ∈ [1 , T F ] j ← 1 for n ← 1 to T and m ← 1 to F do K j ← S j [ n − c − 1 2 : n + c − 1 2 , m − h − 1 2 : m + h − 1 2 ] K j ← K j || K j || p j ← | S i [ n, m ] | 2 j ← j + 1 for c ← 1 to w and l ← 1 to h do K i [ c, l ] ← P T F j =1 K j [ c,l ] p j P T F j =1 p j T o show the efficie nc y of this training metho d, we apply Algorithm 5 on each iso la ted comp onent of the same mixture as b efore made of 3 sources (voice, keyboa rd/synthesizer and drums) sampled at F s = 22 . 0 5 kHz. The resulting tra ined kernels display ed in Fig. 5 a re then used in combination with Algor ithm 4 for K AM-based BASS. In this exp eriment, we co mpare the separa tion r esults obtained by our pr op osal (KAM-CUST) with h = 21, w = 35 , N iter = 4, α = 2 ( cf. T able 1 (a)), with the results provided by the KAM-REPET alg orithm as implemented b y Liutkus [20, 34] ( cf. T able 1 (c)) and when KAM-REP ET is combined w ith the HPSS metho d [19] in order to obtain 3 sour ces ( cf. T able 1 (b)). The res ults show that the KAM metho d combined with trained kernels can significantly outp erforms others state-of-the-ar t metho ds, par ticula rity in terms of RQF, SIR. Our metho d als o obtains acceptable SDR and 1 A [ a : b, c : d ] denotes the submatrix of A such as ( A [ i, j ]) i ∈ [ a,b ] ,j ∈ [ c,d ] 6 ✶ ✷ ✸ ✹ ✺ ✻ ✼ ✽ ✾ ✁ ✂ ✄ ☎ ✆ ✝ ✞ ✟ ✠ ✡ ☛ ☞ ♥✌✍✎✏✑ ✒✓ ✔✕✖✗ ✘✙✚✛✜✢ s ✣ ✤ ✥ ✦ ✧ ★ ✩ ✪ ✫ ✬ ✭ ✮ ✯ ✰ ✱ ✲ ❘ ✳ ✴ ❙ ✵ ✿ ❀ ❁ ❂ ❃ ❄ ❅ (a) voice ✶ ✷ ✸ ✹ ✺ ✻ ✼ ✽ ✾ ✁ ✲ ✂ ✵ ✄ ☎ ✆ ✝ ✞ ✟ ✠ ♥✡☛☞✌✍ ✎✏ ✑✒✓✔ ✕✖✗✘✙✚ s ✛ ✜ ✢ ✣ ✤ ✥ ✦ ✧ ★ ✩ ✪ ✫ ✬ ✭ ✮ ✯ ❘ ✰ ✱ ❙ ✳ ✴ ✿ ❀ ❁ ❂ ❃ ❄ (b) key board/synthesizer ✶ ✷ ✸ ✹ ✺ ✻ ✼ ✽ ✾ ✁ ✲ ✂ ✵ ✄ ☎ ✆ ✝ ✞ ✟ ✠ ✡ ☛ ♥☞✌✍✎✏ ✑✒ ✓✔✕✖ ✗✘✙✚✛✜ s ✢ ✣ ✤ ✥ ✦ ✧ ★ ✩ ✪ ✫ ✬ ✭ ✮ ✯ ✰ ✱ ❘ ✳ ✴ ❙ ✿ ❀ ❁ ❂ ❃ ❄ ❅ ❆ (c) drums Figure 4: Separatio n quality using tra ined kernels on a mixture made of 3 sources as a function of the num ber of iter ations N iter . t ✁ ✂ ✄ ☎ ✆ ✝ ✞ ❢ ✟ ✠ ✡ ☛ ☞ ✌ ✍ ✎ ✏ ✑ ✒ ✓ ✔ ✶ ✕ ✖✗ ✘ ✙✚ ✛ ✜ ✷ ✢ ✸ ✣ ✺ ✤ ✥ ✦ ✧ ★ ✩ ✪ ✫ ✬ ✭ ✮ ✯ ✰ ✱ ✲ ✳ ✴ ✵ ✹ ✻ ✼ ✽ ✾ ✿ ❀ ❁ ❂ ❃ ❄ ❅ ❆ ❇ ❈ ❉ ❊ ❋ ● ❍ ■ ❏ ❑ ▲ ▼ ◆ ❖ P ◗ ❘ ❙ ❚ ❯ ❱ ❲ ❳ ❨ ❩ ❬ ❭ ❪ ❫ ❴ ❵ ❛ ❜ ❝ ❞ ❡ ❣❤ ✐❥ ❦ ❧ ♠ ♥ ♦ ♣qr s ✉ ✈ ✇① ②③ ④ ⑤ ⑥ ⑦ ⑧ ⑨ ⑩ ❶ ❷ ❸ ❹ ❺ ❻ ❼ ❽ ❾ ❿ ➀ ➁ ➂ ➃ ➄ ➅ ➆ ➇ ➈ ➉ ➊ ➋ ➌ ➍ ➎ ➏ ➐ ➑ ➒ ➓ ➔ → ➣ ↔ ↕ ➙ ➛ ➜ ➝ ➞ ➟ ➠ ➡ ➢ ➤ ➥ ➦ ➧ ➨ ➩ ➫ ➭ ➯ ➲ ➳ ➵ ➸ ➺ ➻ ➼ ➽ ➾ ➚ ➪ ➶ ➹ ➘ ➴ ➷ ➬ ➮ ➱ ✃ ❐ ❒ ❮ ❰ Ï Ð Ñ Ò Ó Ô Õ Ö × Ø Ù Ú Û Ü Ý Þ ß à á â ã ä å æ ç è é ê ë ì í î ï ð ñ ò ó ô õ ö ÷ ø ù ú û Figure 5: Kernels provided by Algorithm 5 with Γ = 0 . 5 4, h = 21 , w = 35, applied on a mixtur e of 3 s ources: 1) singing voice, 2) keyboa rd/synthesizer and 3) drums. The first row cor resp onds to K i and the second one to K b i . T able 1 : Separation of a mixture ma de of 3 so urces using different K AM co nfigurations. (a) new pr oposed (KAM-CUST) semi -blind approach using the 3 trained kernels in Fig. 5 ( h = 21, w = 35, N iter = 4, α = 2) Source RQF (dB) SIR (dB) SDR (dB) SAR (dB) voice 6.88 9.12 6.14 9. 68 keyboard 2.31 8.36 - 1.45 -0.38 drums 6.26 20.98 5. 12 5.2 7 (b) KAM metho d u sing REPET kernels [ 20, 34] combined wi th HPSS [19]. Source RQF (dB) SIR (dB) SDR (dB) SAR (dB) voice 3.16 10.33 0.30 -1.14 keyboard 0.89 4 .6 7 -1.4 1.10 drums -3.20 3.01 -3.36 -0.47 (c) KAM method using REPET k ernels [20, 34], without HPSS Source RQF (dB) SIR (dB) SDR (dB) SAR (dB) voice. 4.76 8.0 6 3.33 5.74 keyb.+drums 1.09 4.0 4 -2.94 -0.52 SAR (ab ove 5 dB except for the keybo ard recovered signal). On the other side, the b est SIR result (characterized by a b etter s o urce isolatio n) for the extracted singing voice signal, is provided by the c o mbination of the RE PET with the HPSS metho d. How ever, this approa ch obtains a p o o r SDR a nd SAR results and a low er RQF than using our pro p osal. Hence, low SDR and low SAR co rresp o nd to a p o or p erceptual audio signal qua lity where the or iginal signal is altered by undesired a rtifacts ( i.e. undesired s o und effects and additive nois e). The impact o f the num ber of iteratio ns N iter using KAM-CUST is in v estigated in Fig. 4 which s hows that the b est RQF for the extracted singing voice can b e reached for N iter = 4. A higher v alue o f N iter increases the computation time and can improv e the SIR of the acco mpaniment (which cor r esp onds to a b etter separ ation), how ever it can also a dd mor e distortio n and artifacts a s s hown by the SDR a nd SAR curves which decreas e 7 when N iter > 4 for the re s ulting sour c e s. 3 Singing v oice detection In this section, we prop o s e several approaches to detect at each time instan t if a singing voice is a ctive into a po lyphonic mixture signal. T he pr op osed fra mework illustr a ted by Fig . 6 uses sour ce sepa ration as a preliminary step befor e a pplying a singing voice detection. W e c hoo se to in vestigate b oth the unsuper vised a pproach and the sup ervised a pproach which uses tra ine d voice mo dels to help the recognitio n of signal se gments co nt aining voice. Figure 6: Pr op osed fra mework for music source s eparation and singing v oice detection from a p olyphonic mixture x . HPSS [19] is only used separ ately when this capa bility is not included with the BASS metho d ( i.e. KAM-REPET a nd RPCA). T r ained voice mode ls a re only used by the sup er v ised appro aches. 3.1 Unsuper vised Singing V oice Detection In the unsuper vised appr o ach, we do not train s pe cific mo del fo r singing voice detection. W e only compute a V o ice-to-Music Ratio (VTMR) on the estimated s ignals provided by the BASS metho ds 2 . The VTMR is a s aliency function which is computed on no n- silent frames. Th us, t w o user- defined thresho lds are used resp ectively for sile nce detection Γ s and for v oice detection Γ v . The v oice detection pro cess can th us be describ ed as follows for an input signal mixture x . 1. Computation o f ˆ s v and ˆ s hp = ˆ s h + ˆ s p , resp ect to x = ˆ s v + ˆ s hp , using one of the previo usly prop osed BASS metho d in Section 2. 2. Application of a band-pas s filter o n ˆ s v to a llow frequencies in ra nge [12 0 , 3000] Hz (a dapted to a sing ing voice bandwidth). 3. Computation of the VTMR on each s ig nal fra me of length N v by step ∆ n , centered on s ample n , as: E [ n ] = n + N v 2 X k = n − N v 2 | x [ k ] | 2 VTMR[ n ] = n + N v 2 X k = n − N v 2 | ˆ s v [ k ] | 2 E [ n ] , if E [ n ] > Γ s 0 otherwise (8) 4. The decisio n to consider if the fr a me center at time index n co nt ains a s ing ing v oice is tak en when VTMR[ n ] > Γ v , with Γ v ∈ [0 , 1]. O therwise, an instrumental or a silent frame is consider ed. Hence, in our metho d we ass ume that despite errors for estimating the voice s ignal ˆ s v , its corres p o nding ene r gy computed on a frame provides sufficiently rele v ant information to detect the prese nc e of a singing voice in the analyzed mixture. According to this assumption, the selected thresho ld Γ v related to VTMR should b e chosen close to 0.5 . A lower v alue is how ev er les s r estrictive but can provide mo re false p ositive results. Abo ut the silent detection thres hold Γ s , a low v alue ab ov e zero should b e chosen to increa s e ro bustness to estimation error s a nd to av oid a div ision b y zero in Eq. (8). Hop efully , this pa rameter has shown a w eak imp ortance on the voice detection results when it is chosen sufficiently small ( e.g. Γ s = 10 − 4 ). An illustratio n of the prop ose d framework using the KAM-RE PET BASS metho d is pr e s ented in Fig . 7 which displays the VTMR (plotted in bla ck) co mputed for the musical ex c erpt MusicDelta Punk taken fro m the MedleyDB datas et [35]. The annotation (als o called ref.) is plotted in green a nd the frames which a re detected as co nt aining singing voice corres p o nd to r ed cross e s . In this shor t excerpt ( cf. Fig . 7), results are excellent since the average recall is 0.83 , the a verage precisio n is 0.6 3 a nd the F-measur e is equal to 0.7 2. F ur ther explana tio ns ab out these ev a luation metrics are provided in Section 4.3. 2 Note that in the case of KAM -CUST, the s eparation mo del is trained. 8 0 1 2 3 4 5 6 7 8 9 10 0 0.2 0.4 0.6 0.8 1 1.2 time [s] voice−to−music ratio (VTMR) Rec v =0.67, Rec ins =1.00, av Rec =0.83 ; Prec v =1.00, Prec ins =0.28, av Prec =0.64 ; F meas =0.72 ref. estim. detect. Figure 7: Unsupervised voice detection using KAM-REPE T for BASS, applied on the annotated tra ck Mu- sicDelta Pu n k taken fro m MedleyDB (Γ v = 0 . 5). 3.2 HPSS and F 0 Filtering In the prop o s ed framework ( cf. Fig. 6), any voice/music separa tio n metho d ca n be co mbined with a HPSS metho d to estimate the p ercus sive part ˆ s p when it is not directly mo deled by the BASS method ( i.e. K AM- REPET and RP CA). F o r this purp ose, we simply us e KAM with source- sp ecific kernels (a)+(b) presented in Fig. 3. This method is also eq uiv alen t to the median filtering approach prop os ed in [19]. In order to enhance the harmonicity of the voice par t, we ca n a pply F 0 filtering on the estimated singing voice sig na l ˆ s v . This metho d previously prop osed in [3 6] for RPCA, consists in estimating at each instant the fundamental frequency F 0 and to apply a binary mas k o n a time-frequency representation to isolate the harmo nic co mpo nent s (par tials) of the predominant F 0 of ˆ s v , from the background music. In o ur implementation, the YIN alg orithm [37] was used for single F 0 estimation b efore the filtering pro cess which consider s at each instant, the s p ectr ogra m lo cal maxima of the vicinity of each integer m ultiple of F 0 , as the singing voice partials. Hence, the residual part (not recognized as the partials) is remov ed fro m ˆ s v and a dded to ˆ s h (the harmonic instrumental acco mpaniment) . In our exp eriment, F 0 Filtering was only co mbin ed with RPCA to provide a slight improv emen t of the original metho d. 3.3 Sup ervised Singing V oice Detection 3.3.1 Metho d descripti on This technique uses a machine lear ning fr amework which remains intensiv ely studied in the literatur e [23, 38, 3 9]. It consists in using annotated da tasets to train a cla ssification method to a utomatically predict if a signa l fragment of a p o lyphonic music contains singing voice. Here, we prop os e to inv estigate tw o approaches: • the “cla s sical” supe r vised appr oach whic h applies singing voice detectio n without sourc e separa tion ( i.e. directly on the mixture x ), • the sup ervis e d BASS appr oach which applies singing voice detection on the iso lated signal as so ciated to voice provided by a B ASS metho d ( i.e. ˆ s v ). F or the classifica tion, ea ch signal is represented by a set of features. In this study , we inv estigate sepa rately the following descr ipto rs: Mel F reque nc y Cepstral Coe fficient s (MFCC) of s ources s ignals as prop osed in [38], trained KAM kernels K i provided b y Algorithm 5, Timbre T o olBox (TTB) [4 0] features and co efficie nt s of the Scattering T ransfor m (SCT ) [41]. In order to reduce overfitting, we use the Inertia Ratio Maximizatio n using F eatures Space Pro jection (IRMFSP) algor ithm [42] as a features selection metho d. During the tra ining step, an annotated da taset is used to mo del the singing voice segments and the instru- men tal music segments. Hence, we obtain 3 distinct mo dels: • when is olated v oice a nd m usic signals ar e av ailable ( i.e. MIR1K and MedleyDB), they are used to obtain resp ectively the mo dels µ v and µ m . • when a singing voice is active ov er a music background, ( i.e. for a ll datase ts ) a mo del µ vm is obtained. During the re cognition (testing) step, a trained cla ssification metho d is then a pplied on signal frag ment s to detect singing voice activity . 9 3.3.2 F eatures selection for voice detection In order to ass ess the efficiency o f the prop osed features for the sup ervis ed metho d, we co mputed for the Jamendo dataset [38], a 3-fold cross v alidation (with randomly defined folds ) using the Suppo r t V ector Ma chines (SVM) metho d with a r adial basis kernel, c o mbined with the IRMFSP metho d [42] to obtain the top-100 be st features to discriminate b etw een vo cal and musical sig nal frames. In this e xp eriment, each music except is repres e nt ed by concatenated features vectors computed on each 371 ms -long frames (without overlap b etw een a dja cent frames). W e co nfigure each metho d s uch a s K AM provides 3 61 v a lues (using w = h = 19), MF CCs provide 273 v alues (13 MFCCS on 21 frames), TTB pr ovides 164 co efficie nts and SCT provides 866 co efficients. T he results measured in terms of F-measur e ar e display ed in T able 2 and shows that SCT is the mo st impor tant featur e which o utper forms the other ones. Despite KAM shows its ca pabilities for s ource separ ation, it how ever provides the po orest res ults but clo s e to MFCC s re s ults, for singing voice detectio n. The b est results ar e obtained thanks to SCT which should be used in co m bination with the TTB . T able 2: Inv estigation of the most efficient features for singing voice detection on the Ja mendo dataset. KAM MF CC TTB SCT F meas x .75 x .80 x .82 x .89 x x .82 x x .83 x x .88 x x .85 x x .89 x x .89 x x x .84 x x x .88 x x x .88 x x x .89 x x x x .89 4 Numerical results −10 −5 0 5 10 15 20 voice music RQF [dB] KAM−CUST KAM−REPET RPCA Jeong−Lee−14 (a) RQF −10 −5 0 5 10 15 20 voice music SIR [dB] KAM−CUST KAM−REPET RPCA Jeong−Lee−14 (b) SIR 0 10 20 30 40 50 60 70 80 90 voice music OPS [dB] KAM−CUST KAM−REPET RPCA Jeong−Lee−14 (c) Overall-Percep tual Score (p ercent s) Figure 8: O b jectiv e and p erceptual B ASS quality results co mparison on the test- fo ld of the MIR1K dataset. 4.1 Datasets In o ur exp er iment s, we use several common da ta sets allowing ev aluation for source separa tion (MedleyDB, MIR1K) and s ing ing voice detection from a p olypho nic mixture. Abo ut singing voice detection, each da taset is split in se veral folds corr esp onding to training a nd test fo lds which ar e b oth used by the e v aluated sup ervised metho ds. T he unsup ervised metho ds o nly use the tes t fold. Hence, we used 3 datas ets. • Jamendo [38] contains cre ative commons music tra ck with singing voice annotations. The whole data set contains 93 tra cks wher e 61 corr e s p o nd to the tra ining set and 16 tra cks ar e use d resp ectively for the test 10 −10 −5 0 5 10 15 20 voice harm. music percu. music RQF [dB] KAM−CUST KAM−REPET RPCA JEONG−LEE14 (a) RQF −10 −5 0 5 10 15 20 voice harm. music percu. music SIR [dB] KAM−CUST KAM−REPET RPCA JEONG−LEE14 (b) SIR 0 10 20 30 40 50 voice harm. music percu. music OPS [dB] KAM−CUST KAM−REPET RPCA JEONG−LEE14 (c) Overall-Percep tual Score (p ercent s) Figure 9: Ob jective and p erce ptua l BASS quality r esults c o mparison on the test-fold of the MedleyDB dataset. and the v alidation. Since the s e pa rated tra cks of e ach source a re not av ailable, this dataset is only used for singing voice detection. • MedleyDB [35] co ntains 12 2 music pieces of different styles, av a ila ble with the separ ate multi-trac k instru- men ts (60 with and 62 without singing voice). This , allows to build a flat ins tantaneous sing le-channel mixture mix to fit the signal mo de l pro po sed by Eq. (1). W e have made a split on this datas et which preserve the ratio of voiced-un v oiced musical tr acks while ensuring that each artist is only present once on each fold. Finally , the training dataset contains 62 tracks, the test set 36 tracks a nd the v alidation 24 tracks. F or the sourc e separation and the singing voice detection tasks, we o nly fo cus on 50 music tracks containing singing voice. • MIR1K [4 3] co ntains 1000 m usical ex c e rpts r ecorded during k a raoke sessions with 1 9 different no n- professiona l singers. F or e ach tr ack the voice and the accompaniment is av a ilable. W e prop ose to split this data set to o btain 828 excerpts for the training a nd 17 2 excerpts fo r the test set (containing only the singers ‘HeyCat’ and ‘Am y’). 4.2 Blind Source Separation Now, we compare the source sepa ration p erfo r mance resp ectively o btained o n MIR1K (voice/music) and on MedleyDB (voice/m usic/drums) datasets using the inv estigated metho ds: KAM-REPET, KAM-CUST, RPCA and Jeong-L e e metho ds. F or each m usical tr ack, the isolated source signa ls a r e use d to c onstruct mixtures through Eq . (1) on which the BASS metho ds are applied. Isola ted s ig nal are also used as re ferences to compute the so urce s eparation quality meas ures. Each analy zed excerpt is sa mpled at F s = 22 . 05 k Hz and ea ch method is co nfigured to provide the b est results according to Section 2: • KAM-REPET is a v a riant of the or ig inal REPET a lg orithm prop ose d by A. Liutkus in [20] which uses a lo cal time-v ar ying temp o estimator to separa te the leading melo dy from the r ep etitive musical ba ckground. T o obtain 3 s ources (on MedleyDB), this metho d is combined with the HPSS metho d [19] with h = w = 19 (as prepr o cessing) to separa te the p ercus s ive part. • KAM-CUST is the new pr o p osed metho d ( cf. Section 2.4) based o n the KAM fr a mework using a sup ervised kernel training step. In our exp er iment , we dir ectly train the kernels o n the isolated reference sig na ls used to crea te the mix tur es. T rained kernels are c onfigured such as h = w = 19. • RPCA corres po nds to o ur implementation of this method with λ = 2 √ max( F ,T ) , µ = 10 λ and N iter = 1000. As for the KAM-RE PET method, this approa ch c a n b e combined with the HPSS [19] and F 0 -filtering to provide 2 or 3 sour c es when it is require d. • Jeong-Lee- 14 cor resp onds to our implementation of Algorithm 2 with α = 1 / 4, φ = 1 / 40, N iter = 200 , γ = 1 / 4. The results display ed in Fig. 8 (MIR1K) and in Fig. 9 (Medley DB) us e the b oxplot r epresentation [44] a nd measure the B ASS quality in terms o f RQF, SIR a nd Overall Perceptual Score (OP S) provided by BssEv a l 2 [25, 4 5]. J eong-Lee- 14 and K AM-REPET obtain the bes t SIR r e s ults o n MIR1K for sepa rating the voice without drums separation ( cf. Fig. 8). Interestingly , Jeong-Lee- 14 ca n significa ntly outp erforms other metho ds for voice separatio n on MIR1K, but it can also obtain the w orst results on MedleyDB. F rom another s ide, RPCA and KAM-REPET obtain the b est SIR results for sepa rating the voice in co mb ination with drums separa tio n ( cf. Fig. 9 ) on MedleyDB. Unfor tuna tely , KAM-CUST fa ils to separa te the voice pr op erly . How ever it ca n obta in 11 the b est results fo r acco mpaniment separatio n. This can b e explained by the v ariability of a singing voice sp ectrogr a m whic h is not sufficiently mo deled b y our training Algo rithm. At the contrary , b etter r esults ar e provided for the acco mpaniment which has a more stable time-freq uency structure . This can also b e explained by MedleyDB for which several r eferences signal ar e not well isolated. This pro duces er rors in the trained kernels which ar e used by K AM-CUST. 4.3 Singing v oice detect ion Each ev aluated metho d is configured to detect the presence of a singing voice a ctivity on ea ch signa l fra me of length 3 7 1.5 ms (8192 samples at F s =22.05 k Hz) by steps of 30 ms. In or der to co mpare the per formance of the differen t prop os ed singing voice detection metho ds, we use the recall (Rec), precis io n (Prec) and F-measur e ( F meas ) metrics which a re commonly used to assess Music Informa tion Retriev al (MIR) systems [46]. Rec (re sp. Prec) is defined for each clas s ( i.e. voice ( v ) and music ( hp )) a nd is averaged amo ng class es to obtain the av Rec (resp. av Prec ). The F-measure is th us o btained by co mputing the har monic av erage b etw een av Rec and av Prec such as: F meas = 2 av Rec · av Prec av Rec + av Prec . (9) 4.3.1 Unsup ervised si nging v oi ce detection In this e x pe r iment we r esp ectively apply the 4 inv estigated BASS metho ds de s crib ed in Section 2 and 4.2 to estimate the voice source and the musical parts b efore a pplying the unsup ervised approach describ ed in Section 3.1. Our results obtained on the MedleyDB and the MIR1K datasets are pr esented in T ables 3 (a) and (b). The r esults are compar ed to those pr ovided by the or acle whic h corr esp onds to the Algo rithm 1 which apply a Wiener filter with α = 2 and where the is olated reference signals ar e a s sumed known. In ter estingly , the b e s t results ar e reached using the KAM-RE PET metho d without HPSS on MedleyDB and with Jeo ng-Lee-1 4 o n MIR1K with a F-measure a bove 0.60 . 4.3.2 BASS + sup e rvised singing v oice detection In this exp eriment, we co mbine a BASS method with the b est SVM-based pro p o sed sup ervised singing voice detection metho d as inv estig ated in T able. 2 ( i.e. using TTB + SCT). Accor ding to T ables 4 (a) a nd (b), combining BASS with s uper vised sing ing voice detection can slightly improve the precisio n o f detection in compariso n with the unsupe rvised appr oach (in particular K AM-REPET and K AM-CUST). How ever, this approach shows a limited interest o f BASS for s up er vised s inging voice detection, in co mparison with other approaches. In fact, this approa ch do es not allow to overcome the best sco re r eached thro ugh the unsupe rvised metho d, in pa rticular the maximal recall reached for MedleyDB which rema ins eq ua l to 0.59. A solution not inv estig a ted her e could b e to train mo dels sp ecific to the results provided by a BASS, but without the insurance to o btain b etter results tha n without using BASS. 4.3.3 Sup ervised si nging v oi ce detection: com parison with CNN Finally , we c ompare all the prop osed appro aches (unsup ervised a nd sup ervised) in terms of s inging voice de- tection accuracy with an implemen tation of a recent state-o f-the-art metho d [2 3] based on CNN. The results obtained on a sing le da taset and after merging tw o datasets, ar e resp ectively dis played in T ables . 5 (a) a nd (b). F or the sa ke of clarity , we only co mpa re the av erage recall results which is the most imp ortant metric. T able 5 (b) considers tw o exp erimental cases. The Self-DB c ase consider s tw o datasets as a single dataset by merging their res pe ctive tr aining parts ( e.g. MIR1K-tr ain + J AMENDO-train) and by merging their test parts ( e.g. MIR1K-test + JAMENDO-test). The cross -DB cas e uses tw o merg ed datasets for the training step ( e.g. MIR1K- train + JAMENDO- tr ain) a nd use s the thir d dataset for testing the singing voice detection ( i.e. MedleyDB-test). Results show that the CNN-based metho d outp erfo rms the prop osed unsup ervis ed and the sup e rvised metho ds when it is applied on single da tasets ( cf. (a) and s e ld- DB (b)). How ev er, the unsuper vised approach can be at CNN in cros s-DB (b) case. This is visible for the MIR1K where the bes t unsup er vised metho ds (RPCA and J eong-Lee- 14) obtain a recall equal to 0 .68 when the CNN-based metho d is trained on Jamendo+Medley DB only 0.65 . This result s hows that an uns up er vised appro ach can also b e o f int erest to av o id ov erfitting or when no tr aining dataset is av a ila ble. Moreov er, our pro po sed sup ervised metho ds can obtain comparable r e sults to CNN in the cr oss-DB case except for sing ing voice detection applied on MIR1K. 3 BSS Ev al and PEASS: http://bass- db.gforge .inria.fr/bss_eval/ 12 T able 3 : Unsup ervised voice detection results us ing B ASS (b old v alues denotes b est results exc e pt for Ora cle). (a) with and without drums sepa ration on the MedleyDB dataset av. Rec. av. P rec. F-mea s Oracle 0.71 0.66 0.68 KAM-REPET 0.59 0.68 0.63 KAM-REPET + HPSS 0.54 0.69 0.60 KAM-CUST 0.50 0.62 0.55 RPCA 0.52 0.76 0.61 RPCA + HPSS 0.53 0.75 0.62 Jeong-Lee- 1 4 0.50 0.65 0.56 (b) without drums separation applied on the MIR1K dataset av. Rec. av. Pre c . F-meas Oracle 0.82 0.72 0.76 KAM-REPET 0.6 5 0 .75 0.69 KAM-CUST 0.57 0.55 0.55 RPCA 0.68 0 .61 0.64 Jeong-Lee - 14 0.68 0.78 0. 72 T able 4 : BASS co mbined with supe r vised singing voice detection results (b old v alues denotes b est results except for Oracle). (a) with drums separation applied on the MedleyDB dataset av. Rec. av. P rec. F-mea s Oracle 0.71 0.68 0.69 KAM-REPET + HPSS 0.52 0.76 0.61 KAM-CUST 0.59 0.64 0.61 RPCA + HPSS 0.55 0.69 0.61 Jeong-Lee- 1 4 0.49 0.64 0.55 (b) without drums separation applied on the MIR1K dataset av. Rec. av. Pre c . F-meas Oracle 0.67 0.61 0.63 KAM-REPET 0.60 0 .7 0 0.64 KAM-CUST 0.52 0.62 0.56 RPCA 0.55 0 .74 0.63 Jeong-Lee - 14 0.51 0.72 0.59 T able 5: Compa rison o f the prop osed methods with [23] measured in terms of av e rage recall for s inging voice detection. (a) ev aluation on each dataset Dataset Best unsup ervised SVM (MFCC+SCT) CNN Jamendo 0.58 0.81 0.86 MIR1K 0.68 0.77 0.9 MedleyDB 0.59 0.79 0.86 (b) ev aluation on merged datasets T raining datasets SVM (MFCC+SCT) CNN self-DB cross-DB self-DB cross-DB Jamendo + MIR1K 0.8 1 0.73 0.89 0.75 Jamendo + MedleyDB 0.80 0.59 0.86 0.65 MedleyDB + MIR1K 0.80 0.76 0.84 0.77 5 Conclusion W e have pr esented recent developmen ts for blind sing le-channel audio source separa tion metho ds, which use morpholog ical filtering of the mixture sp ectrogr am. These metho ds were compared tog e ther for sourc e separatio n and using our new fr amework for sing ing voice detection which uses BASS as a prepro ces sing step. W e have also prop osed a new contribution to extend the KAM framework to automatically design kernels whic h fits any given audio s ource. O ur results show that our prop ose d K AM- C UST metho d is promising and ca n obtain better 13 results than K AM-REPET for blind source sepa ration. Howev er , our training alg orithm is sensitive and sho uld be further inv estigated to pr ovide dis criminative source- sp ecific kernels. Mo reov er, we have shown that the unsupe r vised approach remains of int erest fo r singing voice detection in compariso n with more efficien t metho d such as [23] based on CNN. In fact, the weakness of sup ervis e d appro aches ca n be c ome visible when larg e databases ar e pro cessed or when a few a nnotated examples a re av a ilable. Hence, this study paves the wa y of a future investigation of the K AM framework in order to efficiently design s ource-sp ecific kernels w hich can b e used bo th for source se paration or fo r singing voice detection. F utur e works will co nsider new pra ctical applications of the prop o sed metho ds while improving the r obustness o f the new pro p o sed KAM training a lg orithm. Ac k n o wledgemen t This resea rch ha s r eceived funding fr om the Europ ean Union’s Horiz o n 2 020 resear ch and innov a tion pr ogra m under g rant agree ment n o 68812 2. Thanks go to Alice Co he nha dria for her implementation of metho d [2 3] used in our compar ative study . References [1] P . Como n and C. Jutten, Handb o ok of Blind Sour c e Sep ar ation: Indep endent c omp onent analysis and applic ations . Academic pre s s, 201 0. [2] P . Bo fill a nd M.Zibulevski, “ Underdetermined blind so urce separa tion,” Signal Pr o c essing , vol. 81, no. 11, pp. 23 53–2 362, 200 1. [3] J. Idier, Bayesian appr o ach t o inverse pr oblems . J ohn Wiley & Sons , 2013 . [4] E. Vincent, H. Sawada, P . Bofill, S. Ma k ino, a nd J. P . Ros ca, “ First stereo audio source separation e v al- uation campaign: data, algor ithms and results,” in Int ernational Confer enc e on Indep endent Comp onent Analy sis and Signal Sep ar ation . Springer, 200 7, pp. 55 2 –559 . [5] F. R. St¨ o ter, A. L iutkus , R. Badea u, B. Edler , and P . Magron, “Co mmon fate mo del for uniso n so urce separatio n,” in Pr o c. IEEE Int ernational Confer enc e on Ac oust ., Sp e e ch and Signal Pr o c ess. (ICASSP) , Mar. 2 0 16, pp. 126– 1 30. [6] T. Ba r ker and T. Virtanen, “ B lind separa tion of audio mix tur es through nonnegative tensor factorizatio n of mo dulation sp ectrogr ams,” IEEE/AC M T r ans. on Audio, Sp e e ch, and L anguage Pr o c essing , v ol. 24, no. 12, pp. 2 377– 2 389, Dec. 2016 . [7] E. Crea g er, N. D. Stein, R. Ba deau, and P . Depalle, “Nonneg ative tensor factor ization with frequency mo d- ulation cues for blind audio so urce sepa ration,” in Pr o c. of the I n ternational So ciety for Music Information R etrieval Confer enc e (ISMIR) , New Y ork , NY, United States, Aug. 2 016. [8] A. J ourjine, S. Rick ar d, and O. Yilmaz, “Blind separatio n o f disjoint o rthogona l sig nals: demixing n sources fro m 2 mixtures ,” in Pr o c. IEEE Int ern ational Confer enc e on A c oust., Sp e e ch and Signal Pr o c ess. (ICASSP) , Istanbul, T urquie, Jun. 200 0, pp. 2 985– 2 988. [9] A. S. Bregma n, Auditory sc en e analysis . MIT Press : Cambridge, MA, 199 0 . [10] E. Crea ger, “ Musical source sepa ration by coherent frequency modula tion cues,” Master ’s thesis , Depar t- men t of Music Res earch, Sch ulic h School o f Music, McGill Universit y , Dec. 20 15. [11] D. F ourer , F. Auger, and G. Peeters, “Estimation loc a le des modulatio ns AM/FM: applications ` a la mo d´ elisation s inuso ¨ ıdale audio et ` a la s´ epara tion de sources av eug le,” in Pr o c. GRETSI’17 , F rance, Aug. 2017. [12] D. F ourer and S. Mar chand, “Infor med sp ectra l a nalysis: audio signal para meters estimatio n using side information,” EURASIP Journ al on A dvanc es in S ignal Pr o c essing , vol. 2 0 13, no. 1, p. 17 8 , Dec. 20 13. [13] B. Lehner and G. Widmer, “Monaura l blind source se pa ration in the context of voca l detection,” in Pr o c. of the International So ciety for Music Information Re trieval Confer enc e (ISMIR) , 2015 , pp. 30 9–315 . [14] I.-Y. J eong a nd K. Lee, “V o ca l separa tion from monaur al music using temp or al/sp ectra l contin uity and sparsity co nstraints,” IEEE Signal Pr o c ess. L ett . , vol. 21, no. 10, pp. 119 7–12 00, 2014 . [15] E. J. Cand` es, X. L i, Y. Ma , a nd J. W right, “Robust principal comp o nent analysis?” Journal of t he ACM (JACM) , vol. 5 8, no. 3, p. 11, 2 011. 14 [16] P .-S. Huang, S. D. Chen, P . Sma ragdis, and M. Hasegawa-Johnson, “ Sing ing-voice separa tion from monau- ral recor dings using robust principal comp onent analysis,” in Pr o c. IEEE Intern ational Confer enc e on A c oust., Sp e e ch and Signal Pr o c ess. (ICASSP) , 201 2, pp. 5 7 –60. [17] A. Liutkus , D. Fitzger a ld, Z. Rafii, B. Pardo, a nd L. Daudet, “ Kernel additive mo dels for source s e pa ration,” IEEE T r ans. Signal Pr o c ess. , vol. 6 2 , no. 16, pp. 429 8 –431 0, Aug. 20 14. [18] Z. Rafii and B. Pardo, “Rep eating pa ttern extraction technique (REPET): A simple metho d for music/voice separatio n,” IEEE/AC M T r ans. on Audio, Sp e e ch, and L anguage Pr o c essing , vol. 21, no. 1, pp. 73– 84, 201 3. [19] D. Fitzgerald, “Har mo nic/p ercussive sepa ration using median filtering,” in Pr o c. Digital A udio Effe cts Confer enc e (DAFx-10) . Dublin Institute o f T e chnology , 2010. [20] A. Liutkus, D. Fitzgerald, a nd Z. Rafii, “ Scalable a udio separ ation with ligh t kernel a dditiv e mo delling ,” in Pr o c. IEEE International Confer enc e on A c oust., Sp e e ch and Signal Pr o c ess. (ICAS SP) , Br isbane, Aus- tralia, Apr . 2015 , pp. 76 –80. [21] H.-G. Kim and J . Y. Kim, “Music/ voice separation based on kernel back-fitting us ing weighted β - order MMSE e s timation,” ETRI Journal , vol. 38, no . 3, pp. 510 –517 , Jun. 2016. [22] H. Cho, J. Lee, and H.-G. Kim, “Singing voice separa tion from monaural music based on kernel back-fitting using beta -order sp ectr al amplitude estimatio ,” in Pr o c. of the International So ciety for Music Information R etrieval Confer enc e (ISMIR) , 20 1 5, pp. 6 39–6 4 4. [23] J. Schl¨ uter, “ L e arning to pinp oint s ing ing voice fro m weakly la b ele d exa mples,” in Pr o c. of the In ternational So ciety for Music In formation R etrieval Confer enc e (ISMIR) , 201 6 , pp. 44 –50. [24] P . Fla ndrin, Time-Fr e qu en cy/Time-Sc ale analysis . Acad. Pr ess, 1998 . [25] E. Vincent, R. Gribo nv al, and C. F ´ evotte, “Performance measurement in blind audio sourc e sepa ration,” IEEE/A CM T r ans . on Audio, Sp e e ch, and L anguage Pr o c essing , vol. 14, no. 4, pp. 1 462–1 469, Jul. 200 6 . [26] V. Emiya, E. Vincent, N. Harlander , a nd V. Hohmann, “Sub jective and ob jective q uality assessment o f audio source separ ation,” IEEE/A CM T r ans. on Audio, Sp e e ch, and L angu age Pr o c essing , vol. 19, no. 7, pp. 20 46–2 057, 201 1. [27] M. F o ntaine, A. Liutkus, L. Girin, and R. Ba deau, “Ex plaining the par ameterized wiener filter with alpha - stable pro ce s ses,” in Pr o c. IEEE Workshop on Applic ations of Signal Pr o c essing t o Audio and A c oustics (W A SP AA ) , Oct. 2 017. [28] M. Na jim, Mo deling, est imation and optimal filtr ation in signal pr o c essing . John Wiley & So ns, 2 010, vol. 2 5. [29] D. F ourer, F. Auger , and P . Flandrin, “ Recursive versions of the Leven ber g-Mar quardt r e a ssigned sp ectro- gram and of the synchrosqueezed STFT,” in Pr o c. IEEE International Confer enc e on A c oust., Sp e e ch and Signal Pr o c ess. (ICASSP) , Mar . 2016 , pp. 48 80–48 84. [30] L. I. Rudin, S. Osher , and E. F a temi, “Nonlinea r to tal v ar iation based noise remov al a lg orithms,” Physic a D: Nonline ar Phenomena , vol. 60 , no. 1- 4, pp. 259– 268, 1 992. [31] Z. Lin, M. Chen, L. W u, and Y. Ma, “The aug mented lagra ng e m ultiplier metho d fo r exact recovery o f a corrupted low-rank matrices,” in Mathematic al Pr o gr amming , 2 009. [32] W. S. Cleveland and S. J . Devlin, “Lo cally weigh ted regr ession: an approa ch to re gressio n a nalysis by lo cal fitting,” J ournal of t he Americ an statist ic al asso ciation , vol. 83, no. 403, pp. 59 6–61 0, 198 8. [33] D. FitzGerald, A. Liukus, Z. Rafii, B. Pardo, a nd L. Daudet, “Har monic/p ercussive separ ation using kernel additive mo delling,” in 25th IET Irish Signals Systems Confer enc e 2014 and 2014 China-Ir eland International Confer enc e on Information and Communic ations T e chnolo gies (ISS C 2014/CIICT 2014) , Jun. 2 014, pp. 35–4 0. [34] A. Liutkus, Z. Rafii, R. Bade a u, B. Pardo, and G. Richard, “Adaptive filtering for music/v oice sepa ration exploiting the rep ea ting musical structure,” in Pr o c. IEEE Int ernational Confer enc e on A c oust., Sp e e ch and Signal Pr o c ess. (ICASSP) , Kyoto, Japan, 201 2, pp. 5 3 –56. [35] R. Bittner, J. Salamon, M. Tierney , M. Mauch, C. Canna m, and J . P . B ello, “MedleyDB: A m ultitrack dataset for a nnotation-intensiv e MIR res e arch,” in Pr o c. of t he International So ciety for Music Information R etrieval Confer enc e (ISMIR) , T a ipe i, T aiwan, Oct. 2014 . 15 [36] Y. Ik emiya, K. Itoy ama, and K . Y o shii, “Sing ing voice separatio n and voc a l f0 e s timation ba s ed on m utual combination o f robust principal compo nent analysis and subhar monic summation,” IEEE/A CM T r ans . on Audio , Sp e e ch, and L anguage Pr o c essing , vol. 24, no. 11, pp. 2 084– 2095, Nov. 2016 . [37] A. De Cheveign´ e a nd H. Kaw ahara, “Yin, a fundamen tal frequency estimator for s pe e ch and music,” The Journal of the A c oustic al So ciety of Ameri c a , vol. 1 11, no. 4, pp. 191 7–19 30, 2002 . [38] M. Ramona, G. Richard, and B. David, “V o cal detection in music with supp ort vector machines,” in Pr o c. IEEE International Confer enc e on A c oust., Sp e e ch and Signal Pr o c ess. (ICASSP) , Mar . 20 08, pp. 1885– 1888 . [39] L. Regnier and G. Peeters, “Singing voice detectio n in music tracks using direc t v oice vibrato detection,” in Pr o c. IEEE In t ernational Confer en c e on A c oust., Sp e e ch and Signal Pr o c ess. (ICASSP) , 2009 , pp. 168 5– 1688. [40] G. Peeters, B . Gior dano, P . Susini, N. Misdariis , and S. McAdams, “The tim bre to o lb ox: Audio des criptors of musical signals ,” Journal of A c oustic So ciety of Americ a (JASA) , vol. 5, no. 13 0, pp. 2902 –2916 , Nov. 2011. [41] J. And ´ en and S. Mallat, “ Multiscale sca ttering for a udio clas sification.” in Pr o c. of the International So ciety for Music Information Re trieval Confer enc e (ISMIR) , 2011 , pp. 65 7 –662 . [42] G. Peeters, “Automatic classifica tion o f lar ge m usical instrument da tabases using hier archical clas s ifiers with inertia ratio maximization,” in 115th AES Convention , NY, USA, Oct. 2 003. [43] C.-L. Hsu and J.-S. R. Jang, “On the improvemen t of singing voice separation for monaur al recording s using the MIR-1K dataset,” IEEE/AC M T r ans. on Audio, Sp e e ch, and L anguage Pr o c essing , vol. 18 , no . 2, pp. 31 0–31 9, 201 0. [44] Y. Benjamini, “O pe ning the b ox of a b oxplot,” The Americ an Statistician , vol. 42, no. 4, pp. 257– 262, 1988. [45] V. Emiya, E. Vincent, N. Harlander , a nd V. Hohmann, “Sub jective and ob jective q uality assessment o f audio source separ ation,” IEEE/A CM T r ans. on Audio, Sp e e ch, and L angu age Pr o c essing , vol. 19, no. 7, pp. 20 46–2 057, 201 1. [46] M. Bay , A. F. Ehmann, and J. S. Downie, “ E v aluation of multip le-f0 estimatio n a nd tra cking systems.” in Pr o c. of the International So ciety for Mu s ic Information R etrieval Confer en c e ( ISMIR) , 2009, pp. 31 5–32 0. 16
Original Paper
Loading high-quality paper...
Comments & Academic Discussion
Loading comments...
Leave a Comment