Does k Matter? k-NN Hubness Analysis for Kernel Additive Modelling Vocal Separation
Kernel Additive Modelling (KAM) is a framework for source separation aiming to explicitly model inherent properties of sound sources to help with their identification and separation. KAM separates a given source by applying robust statistics on the s…
Authors: Delia Fano Yela, Dan Stowell, Mark S
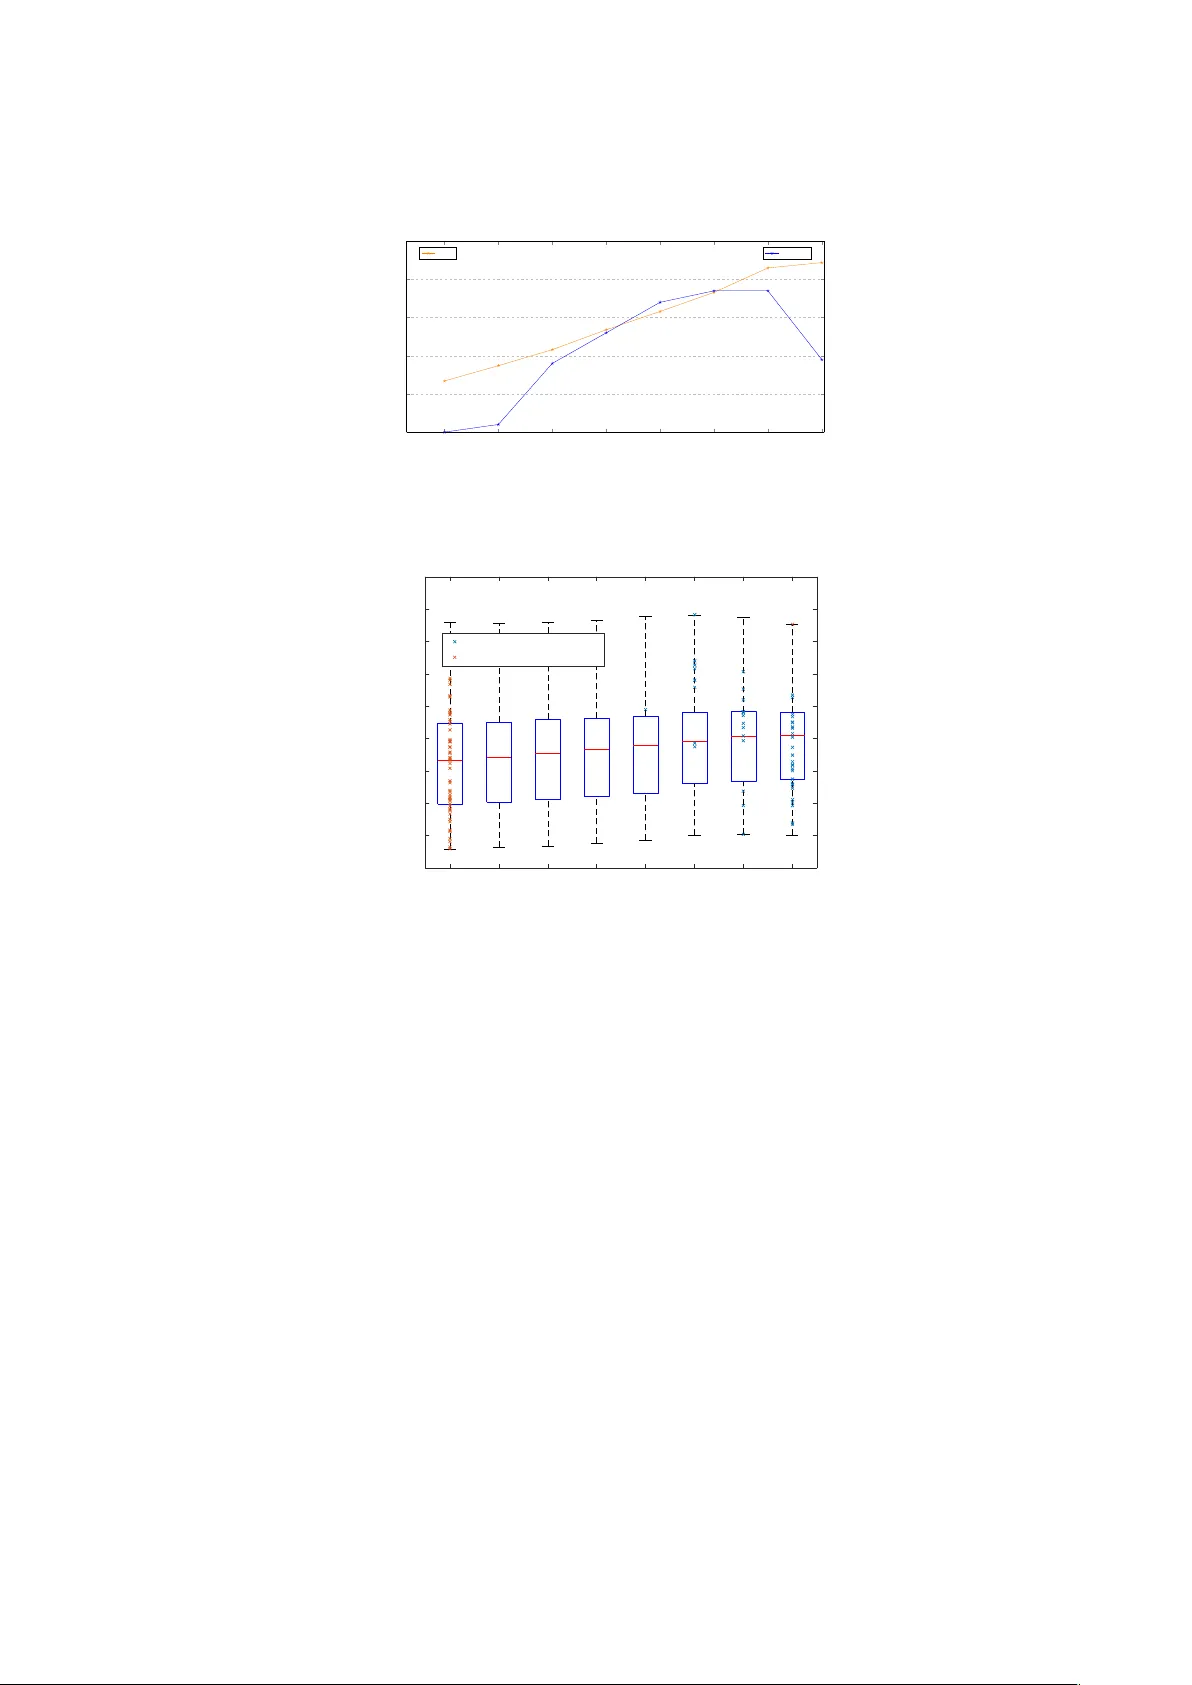
Do es k Matter? k-NN Hubness Analysis for Kernel Additiv e Mo delling V o cal Separation Delia F ano Y ela ? , Dan Sto well, and Mark Sandler Queen Mary Univ ersity of London Mile End Road, London E1 4NS, UK d.fanoyela@qmul.ac.uk Abstract. Kernel A dditive Mo del ling (KAM) is a fr amework for sour c e sep ar ation aiming to explicitly mo del inher ent pr op erties of sound sour c es to help with their identific ation and separ ation. KAM sep ar ates a given sour c e by applying r obust statistics on the sele ction of time-fr e quency bins obtaine d through a sour c e-sp e cific kernel, typic al ly the k -NN func- tion. Even though the p ar ameter k app e ars to b e key for a suc c essful sep ar ation, little discussion on its influenc e or optimisation c an be found in the liter atur e. Her e we pr op ose a novel metho d, base d on gr aph the ory statistics, to automatically optimise k in a vo c al sep ar ation task. We in- tr o duc e the k -NN hubness as an indic ator to find a tailor e d k at a low c omputational c ost. Subse quently, we evaluate our metho d in comp arison to the c ommon appr o ach to choose k . We further discuss the influenc e and importanc e of this p ar ameter with il luminating r esults. Keyw ords: Source Separation, Kernel Additive Modelling, Graph The- ory , Music Pro cessing, V ocal Separation 1 In tro duction Source separation is a discipline aiming to isolate different sources from a given observ able mixture. Amongst the metho ds for m usic source separation in a blind underdetermined scenario (less observ able mixtures than sound sources), the ma jor goal b ecomes to find inheren t c haracteristics of the sources of interest to help with their iden tification and separation. In the last decade, a num ber of computationally inexp ensive metho ds ex- plicitly modelling the target source’s prop erties ha ve gotten some attention [1,2,3,4,5,6,7]. These methods can b e understo od as instances of the wider k ernel additiv e mo delling (KAM) framework [8]. The basic idea b ehind KAM relies on the rep etitiv e nature of m usic by estimating the target source at a particular p oin t based on p oints at whic h the source’s output is somehow similar. This is t ypically applied to time-frequency bins in a sp ectrogram representation. The function determining the target source similarity b et w een time-frequency bins, ? This w ork was funded b y EPSRC grant EP/L019981/1 2 F ano Y ela, Stow ell, Sandler while ignoring the entries associated with other sources, is the so-called ker- nel function. Consequen tly , if a magnitude of a bin deviates amongst the ones judged to b e similar b y the target source k ernel, one can assume there is another o verla ying source and employ order statistics to attenuate its influence. KAM has b een successfully emplo yed for a v ariety of tasks in source separa- tion, such as vocal separation, sp eech enhancement, p ercussiv e/harmonic sepa- ration or in terference reduction [8,9,4]. In the case of v o cal separation, a p opular approac h is to assume the accompaniment music to be typically more rep eti- tiv e and dense compared to the vocals, considered to b e sparse and v aried [2]. Meaning there are more segments in the mix containing the same or similar bac kground m usic than there is for vocals. The nature of these segments v ary amongst metho ds, such as a single rep eating p eriodic musical pattern [2], the temp oral context surrounding every time frame [5] or just a single time frame [1]. In all of these cases, the bac kground m usic is implicitly assumed to hav e a higher energy con tribution than that of the vocal source. Amongst these metho ds, a p opular choice for the accompaniment proximit y k ernel is the k nearest neigh b ours (k-NN) function, returning the k most similar frames to a given frame. The pro ximity measure b et w een frames is t ypically based on the Euclidean distance, and therefore, tw o frames will b e considered to b e similar if they share the same centre frequency . Within the k-NN frames selection, if the v o cal is indeed sparse it should app ear as an outlier and can therefore b e separated from the more common source through median filtering across similar bins. Since the breakdown p oin t of the median op erator is of 50% of outliers (vocals), one could exp ect the choice of k to b e k ey for a successful separation. How ever, there is little or no guidance on how to set this parameter in the literature, nor explanation of its o verall influence. Here we inv estigate the influence of the parameter k in a v o cal separation task and we further prop ose a nov el metho d for its automatic optimisation, based on consideration of the proximit y graph, which is light w eight and needs no prior training. In section 2 will introduce the KAM vocal separation baseline and discuss typical metho ds to choose the parameter k in the K-NN proximit y k ernel. W e will then prop ose a nov el computationally inexp ensiv e metho d for k optimisation in section 3 based on graph theory statistics. In section 4 we will further analyse and discuss the impact of this parameter through an exp erimen tal ev aluation and v alidate the prop osed metho d in such scenario. 2 V o cal Separation Using k Nearest Neighbours KAM is a framework capable of combining different approac hes to source sep- aration using different assumptions to mo del sound sources. F rom the differen t pro ximity k ernel families describ ed in [8], we will fo cus on the mo dels for rep et- itiv e patterns in a vocal separation task. In particular, we present a subset that can b e regarded as an instance of KAM using only one iteration of the kernel bac kfitting procedure describ ed in [8], which was also used in similar form in Do es k matter? 3 the REPET family of metho ds [2], and later extended to account for differen t rep etitiv e patterns [7,1]. These metho ds tak e adv an tage of the rep etitive nature of music and define a distinction b et w een a rep eating background and a sparse v aried foreground. F or v o cal separation in p opular m usic the background typically corresp onds to the m usic accompaniment and the vocals can b e regarded as the sparse foreground. Therefore, one can assume that the musical accompaniment con tributes to most of the energy across the frequency sp ectrum. W e follo w the method and notation describ ed in [1] serving as the baseline metho d on which we will in vestigate the influence and optimisation of its single inheren t parameter k . F ormally , we define the magnitude sp ectrogram of a musical signal as X ∈ R M × N , where M is the num b er of frequency bins and N the n umber of time frames. F or each pair of frames ( j, ` ) ∈ { 1 , . . . , N }× { 1 , . . . , N } , we then compute the squared Euclidean distance b et w een the tw o corresp onding columns in X : D j, ` = M X m = 1 ( X m, j − X m, ` ) 2 . The result is a symmetric matrix D , which w e can now sort to find the k nearest neigh b ours to every frame by keeping track of the frame index. Then, for every frame j , we create a matrix A j ∈ R M × K con taining as columns the sp ecific subset of the k most similar frames tak en from X . W e exp ect the selected k closest frames to j to share similar musical accompanimen t and differ in terms of the v o cal part. In other words, the v o cal contribution in the k nearest frames to j can b e regarded as an outlier and the musical accompanimen t as the commonality b et w een them. Consequently , the median filter is the op erator of c hoice in [1] to extract the common background music and separate out the vocal contribution on eac h frame. The estimated magnitude spectrogram Y ∈ R M × N of the m usical accompanimen t is: Y m, j := median( A j m, 1 , . . . , A j m,K ) T o extract b oth magnitude and vocals from the mixture, we use the soft mask W ∈ [0 , 1] M × N describ ed in[1]. The complex sp ectrograms for the accompani- men t and vocals can then b e estimated by applying soft masks W and (1 − W ) resp ectiv ely to the original mixture sp ectrogram using an elemen t-wise m ultipli- cation. A successful separation b et ween background music and vocals relies largely on the vocals actually b eing outliers within the selection of the k closest frames. W e w an t to mak e sure that the k -NN frames h av e similar bac kground m usic with no or different v o cals. How ever, there are also frames containing matching bac k- ground m usic and matching vocals, which will then b e very likely to b e selected as near neigh b ours. Those frames are unhelpful for the median filtering but since the breakdown p oint of the median op erator is of 50% of outliers (vocals), the metho d is robust to the v o cal rep etitions up to a p oint. This robustness is closely related to the n umber of nearest neighbours we choose, i.e. the parameter k . There seems to b e little or no indication on the metho d to find the optimal parameter k in the literature [8,1,7,5]. In [7] the authors introduce three other 4 F ano Y ela, Stow ell, Sandler parameters to set b oundaries for the choice of k . How ev er, no indication was found on how to actually fix an y of those parameters, including k . A recen t extension introducing a temp oral context R in the proximit y kernel [5] p erforms a parameter sw eep to set the new R parameter to the v alue giving the b est mean metric across a dataset. T o our knowledge, there are currently tw o broad approaches to setting k : p er- ceptual assessment or ev aluation metric optimisation. In the first approach one simply listens to the estimates for differen t k v alues and adjusts the parameter to the b est sounding setting. This is the preferred metho d to set k when there is a reduced num b er of songs to b e pro cessed. The second approach relies on a metric, typically the Signal to Distortion Ratio (SDR), comparing the estimated sound sources with the ground truth. One will set k to obtain the b est metric result. In practice, this means a parameter sw eep for differen t k v alues, for whic h no indication was found on how to pick. In addition, the commonly used SDR measure is known to be a pro xy for p erceptual quality and its precision has b een criticised [10]. Ho w ever, when dealing with large datasets, perceptual assessmen t of the results can b e v ery time consuming. Therefore, it is more typical to use the second approac h to optimise for an ov erall b est p erformance. A parameter sweeping approach to find the optimal k v alue has a n umber of disadv an tages, primarily linked to the optimisation through a p erformance met- ric. Firstly , the separation p erformance metrics usually require to ha ve ground truth separate tracks av ailable, which is not alwa ys p ossible in an application scenario. F urther, the commonly used separation p erformance metrics are com- putationally exp ensive [11], limiting the parameter sweep to a reduced num b er of v alues in a time constraint situation. In addition, optimising k using an ov erall p erformance metric do es not assure the b est v alue for all songs in the dataset. Moreo ver, fixing the k sw eep v alues leav es no ro om to inform the optimisation with the trac k’s individual prop erties, suc h as length. Ideally we would like to b e able to automatically pic k k in an unsup ervised w ay for each track separately , taking in to account the nature of the song and th us finding a tailored v alue for k assuring a successful separation. W e would also like to do this without having to p erform multiple runs of source separation and discarding all but one of them. 3 Prop erties of the k-NN graph F or a given music recording, the family of KAM metho ds we consider dep ends fundamen tally for its b eha viour on the set of nearest neighbours selected for eac h of the N frames. These nearest neighbour relationships can b e represen ted as a directed graph with frames as no des, and each no de having k arcs leading out ward to its nearest neighbours. Note that if frame i is a neigh b our of frame j , the reverse is not necessarily true. At extreme settings, if k = 0 then the graph has no arcs and thus no structure, while if k = N the graph is fully connected and likewise exhibits no structure. What are desirable c haracteristics for a k-NN graph to b e used in KAM? Do es k matter? 5 Unlik e many problems defined on a graph, in KAM w e do not wish our graph to take on simple structure such as well-separated clusters: instead, we wan t all frames to hav e connections to frames which are similar according to the current source kernel, but dissimilar in terms of the other sources. It is not clear how these structural considerations can b est b e quantified n umerically , though such structure would hav e some impact on summary statistics considered in graph theory . Consider a set of frames containing a bac kground musical phrase which is rep eated often: we would exp ect these to form a densely connected component in the graph. The frames also con taining sparsely-presen t and v ariable v o cal energy w ould b e exp ected to hav e arcs p oin ting to that densely connected comp onen t but few arcs p oin ting bac k out to them. Therefore, the num ber of incoming arcs (i.e. in-degree) w ould b e unevenly distributed across the no des, directly as a result of the observ ed signal prop erties whic h one assumes in KAM. One wa y to analyse such prop erties in graph theory is the concept of ‘hubs’, whic h are no des with an unusually high in-degree [12]. This has been of particular influence in so cial netw ork theory as researchers studied effects such as ‘small w orld’ phenomena, which can hav e imp ortant effects suc h as the sp eed at which news or illness spreads through a so cial net w ork. F or a given graph, one can define summary statistics whic h reflect the general presence of h ubs. One referred to as the ‘hubness’ is simply the skewness of the k-o ccurrence statistics, i.e. the sk ewness of the distribution of the in-degrees of no des in the graph. Here, the k-o ccurrence of a frame corresp onds to the num b er of times that frame is amongst the k nearest neigh b ours, and the ‘hubness’ is therefore the skewness of the distribution of all frames’ k-o ccurrence. In a k-NN graph we assign a fixed n umber of arcs, and so the av erage in-degree is alw ays k ; how ever if the graph con tains strong hubs then the skewness of the in-degree will b e high. In our vocal separation application in KAM it is clear that a graph with relativ ely high h ubness should t ypically b e one which has appropriate structure. W e typically ha v e very little a priori guidance ov er what v alue of k to choose, so it is adv an tageous that, for each trac k separately , we can iterate o ver a selection of p ossible k , inspect graph statistics such as h ubness for the graphs th us produced, and select k which pro duces the optimal statistics. Therefore, we here prop ose to select the k pro ducing the maximum hubness of the asso ciated k -NN graph. Ho wev er, in a situation where we v ary k , the hubness h will v ary even in the null case of a randomly-constructed graph. (This can b e seen in the extreme cases: for k = 0 or k = N the graph is symmetric and the hubness is 0, whereas for other k it can b e nonzero.) A standard n ull mo del can be generated by selecting k neigh b ours for each frame purely at random. This is related to the classic Erd˝ os- R ´ en yi random graph except that it is directed rather than undirected [13]. The distribution of k-o ccurrences in this null mo del follows a binomial distribution with parameters N and k / N , leading to an expression for the exp ected h ubness as: h null = (1 − 2 k / N ) / p k (1 − k/ N ) (1) 6 F ano Y ela, Stow ell, Sandler W e can th us define a normalised h ubness statistic as the ‘excess’ h ubness, i.e. the ra w observed hubness minus the h ubness exp ected under the null mo del, which should then b e less biased than the raw hubness in selecting k . The ab o ve n ull mo del is one of the simplest random graphs. In practice, graphs constructed from high-dimensional similarity measures do not b eha v e strictly in that fashion, and it is an ongoing research topic to mo del how k-NN graphs b eha ve in general [14]. In preliminary work w e found that the general scaling of the hubness statistic was out of line (larger) than in the simple null mo del, and so our empirical normalisation is given as h norm = h max( h ) − h null max( h null ) (2) where maxima are across the sw eep of k settings. Using the maximum hubness as a metric to choose k has numerous adv an- tages: 1. It do es not require any ground truth information 2. k is optimised p er track as a pre-pro cessing step b efore the separation actu- ally tak es place 3. It is quick to compute so we can sweep through a lot of differen t k v alues, so w e can hav e a finer optimisation 4. The hubness has b een demonstrated to hav e p erceptual relev ance for song similarit y in music recommendation, suggesting that it reflects prop erties of the nearest neigh b our graph that ha ve impact on its applied use. Ho w ever, it has not b een used for frame selection in KAM and so that is to b e explored here. 4 Exp erimen ts and Discussion T o ev aluate the prop osed metho d, w e quan titativ ely compare it against the stan- dard parameter sw eep for setting k in KAM for a v o cal separation task. W e chose to follo w the vocal separation metho d describ ed in [1] with FFT size of 4096 and hop size of 1024 samples, as it represen ts a baseline instance of the larger KAM framew ork. T o encourage reproducibility , we use the publicly a v ailable T est Demixing Secrets Dataset (DSD100) [15], containing 50 full length songs of diverse genres sampled at 44.1 kHz. Since the kernel implemen ted relies on musical rep etition, w e ev aluated our prop osed metho d on full length songs to ensure as muc h sound material as p ossible for KAM’s source reconstruction. Ho w ever, the literature only offers some indication on k v alues for 30 second segmen ts. W e therefore use a broad range of fix k v alues for the traditional parameter sw eep, letting k ∈ { 0 , 25 , 50 , 100 , 200 , 400 , 800 , 1600 , 3200 } , and a finer p ercen t increase sweep for the computational inexp ensiv e prop osed metho d taking the song length into accoun t, letting k ∈ { (0 . 001 , 0 . 011 , 0 . 021 , 0 . 031 , ..., 0 . 45) × N } where N is the total n umber of time frames in the song. Do es k matter? 7 25 50 100 200 400 800 1 , 600 3 , 200 6 6 . 5 7 7 . 5 8 8 . 5 SDR in dB Median SDR and Hubness across all songs in T est DSD100 SDR 25 50 100 200 400 800 1 , 600 3 , 200 0 0 . 1 0 . 2 0 . 3 0 . 4 0 . 5 log scale k v alues Normalised Hubness Hubness Fig. 1. Median SDR and hubness across all songs in T est DSD100 for differen t fixed k v alues SDR b oxplot of T est DSD 100 fo r di , e rent k v alue s 0 5 10 15 25 50 100 200 400 800 1600 3200 k values SDR in d B max SDR for eac h trac k min SDR for each trac k Fig. 2. SDR Boxplot of every song in the T est DSD100 dataset for different k v alues. The maximum and minimum SDR obtained for each song are mark ed in blue and orange resp ectiv ely , showing a general trend of higher separation p erformance with increasing k v alue. F ollo wing common practice in the field, w e employ the Signal to Distortion Ratio (SDR) in the BSS Ev al to olb o x 3.0 [11] as the quantitativ e indicator of the separation p erformance. Therefore, we would exp ect to observe a p ositiv e correlation b et w een SDR and h ubness for different k v alues. Due to the div ersity of styles in the dataset, one could also exp ect an improv emen t in the ov erall sep- aration p erformance (and so SDR) by using a tailored k for each song following the prop osed metho d. According to the standard metho d to fix k , one would pick the v alue with a higher ov erall SDR, here (Fig. 1) is the highest k of 3200 frames. Alternativ ely , the p ositiv e correlation b etw een the h ubness and SDR seen in Fig. 1 suggests the h ubness to indicate the optimal k v alue for a successful separation. Moreo ver, the similarit y b et ween boxplots in Fig. 2 for different k v alues suggests there might not b e an unique k that maximises the SDR of every song 8 F ano Y ela, Stow ell, Sandler 5 10 15 SDR b o xplot of di , erent k v alues for T est DSD100 T racks in T est DSD100 SDR in dB 11 43 10 17 48 34 36 1 47 32 18 45 38 30 33 16 26 39 37 29 12 27 3 8 31 4 9 2 20 13 41 28 50 5 49 40 46 24 22 14 19 25 35 23 44 15 21 42 7 6 death_heavydist_upbeat metal_slowbanging_HFdist pop_pianorepet industrial_spoken_synthsvar poppunk_loudguitar classicrock_distguitar_repet doublebass_voxheavyFX rap_synth rock_classic_gtrSolo_littlevox dark_emo_dist_guitar death_dist_banging pop_voxVerb_repet slowrock_roughvox_distguitar slowpopjazz_loudvox backfemale_solostring_littlevox spoken_repetperc_guitardist raspy_vox_popblues slowrock_multivox click_repet_female_mellowvox slow_female_distguitar heavy_raspyvox_upbeat_dist hiphop_dist_multiFX punk_pop_female_dist rock_blues_raspyvox funk_rock_repet_vox pop_repet pop_multivox rock_rap_dist bossa_male_maracas backvox_soundFX click_elec_expvox slow_emo_vox_sharp_guitar disco_female_synthFX_repet country_female_banjo_violin gtrloud_spokevox_dist country_female_arpg_guitar pop_chopsynth_duovox calm_shaker_female_repet heavy_powerguitarsolo_littlevox doublevox_malefemale_drums_repet 90elec_synths_spokenvox french_female_repet_short female_simple_rock_dist emo_bass_distguitar simple_guitar_vox_shaker doublevox_malefemale_varguitarreverb simple_pop_vox_acoust_guitar nasalfemvox_gtrsolo_chopBeat_repet pop_guitareffects dist_guitar_backfemale highest k value Fig. 3. SDR Boxplot of different k v alue for each song in the T est DSD100 dataset, briefly describ ed in the top axis and sorted in ascending v ariance order. The SDR obtained with the maximum k v alue of 3200 for each song is marked in blue showing the differen t b eha viour b etw een songs. in the dataset. Ho wev er, the crosses indicating the k v alue from that set for whic h the maximum and minim um SDR was obtained for each song partly go against this idea, as most of the separations were more successful with the highest k v alue. This b eha viour is surprising as the songs in the dataset present very distinct characteristics. One would exp ect most of the tracks to p eak at low er k , since 3200 frames represen ts more than 30% of the total frames for most songs, whic h seems to b e so man y frames that it should generally ov erpass the 50% of outliers breaking p oint of the median op erator. The abundance of highly rep etitiv e songs could p oten tially explain ho w such large k could b e successful. Ho wev er, the mark ers in Fig. 2 show differently as most of the songs obtained a higher SDR with the highest k v alue. This b eha viour comes as a surprise taking in to account the dataset’s disparity . Most trac ks were exp ected to p eak in SDR for low er k v alues than 3200 frames, whic h seems to b e so man y frames that it should generally ov erpass the 50% of outliers breaking p oin t of the median op erator. The abundance of highly rep etitive songs could p oten tially explain ho w such large k could b e successful, although the literature indicates the SDR ma y not b e a reliable metric of the actual separation p erformance [10]. Fig. 3 offers a different p erspective on the individual song b ehaviour which should shed some ligh t on the abov e dilemma. As expected, v ery rep etitiv e songs suc h as track 45, 4 or 50, achiev e a higher SDR with highest k v alues. How ever, it is also the case for uncon ven tional p op songs suc h as 43 or 17, where the Do es k matter? 9 10 13 4 46 33 47 3 27 35 15 29 30 28 19 50 49 14 5 23 42 8 26 45 9 32 20 7 40 38 22 6 39 2 43 25 1 11 2 34 21 41 12 37 48 16 17 44 18 31 36 2 4 6 8 10 12 14 DSD100 T est Dataset T rack num b er SDR in dB Comparison prop osed and standard method to pick k Proposed metho d Standard method Mix ( k =0 ) Fig. 4. SDR v alues for eac h song in the T est DSD100 dataset sorted in ascending order, using the optimal k issued from the standard and prop osed metho d, in comparison to the SDR of the raw mixture (i.e. k =0). v ariance in SDR is extremely low (less than 0.05). F or suc h cases the separation ma y not hav e b een successful, but Fig. 4 shows otherwise as the median SDR is ab o v e the mixture’s SDR (equiv alent k = 0). F urther, the ov erall SDR v ariance is surprisingly low, with a median of 1.4dB p otential SDR increase by c hanging k (maximum of 3.57dB and minimum of 0.17dB). With such a lo w potential SDR improv ement, one might wonder if k actually matters at all or again, if the SDR is failing to capture the actual separation p erformance. The ma jority of cases where differen t v alues of k induce substantial c hanges in SDR corresp ond to popular songs with a classic p op m usical set-up and rep eating m usical structures (Fig. 3)—the ideal scenario for the implemented KAM vocal separation as describ ed in [1]. One could therefore infer that a track sensitive to different k v alues (i.e. higher SDR v ariance), fulfills KAM requirements for a successful source separation. T rack 44 presents an excellent example as it has a high SDR median and high SDR v ariance (2.72 dB of p otential SDR impro vemen t). How ever, most of the tracks in the dataset fail to present such c haracteristics, introducing a question regarding the flexibility and adaptability of the implemen ted KAM for vocal separation. Songs which fulfill KAM ideal requirements for vocal separation (sensitiv e to k or highly rep etitiv e) are exp ected to present higher SDR v alues than more complex songs. How ever, Fig. 3 do es not present such logic, which makes one further wonder if the c hoice of separation p erformance metric is the adequate c hoice and so p erceptual mo dels or listening tests should b e adopted for separa- tion metho ds ev aluation. Nev ertheless, Fig. 4 shows the prop osed metho d can b e used as substitute to the current technique for fixing k . Both metho ds present similar results in most cases and although the prop osed one presents low er SDR for some songs, it seems a small trade-off for a considerable decrease in computation time (1000 times faster than the standard metho d). 10 F ano Y ela, Stow ell, Sandler References 1. FitzGerald, D.: V o cal separation using nearest neighbours and median filtering. In: Pro ceedings of the Irish Signals and Systems Conference (ISSC). (2012) 1–5 2. Rafii, Z., Pardo, B.: Rep eating pattern extraction technique (REPET): A simple metho d for m usic/voice separation. IEEE T ransactions on Audio, Sp eec h, and Language Pro cessing 21 (1) (2013) 71–82 3. FitzGerald, D.: Harmonic/p ercussiv e separation using median filtering. In: Pro- ceedings of the International Conference on Digital Audio Effects (DAFx), Graz, Austria (2010) 246–253 4. F ano Y ela, D., Ewert, S., FitzGerald, D., Sandler, M.B.: In terference reduction in music recordings combining kernel additive mo delling and non-negativ e matrix factorization. In: Proceedings of the IEEE International Conference on Acoustics, Sp eec h, and Signal Pro cessing (ICASSP), New Orleans, USA (2017) 5. F ano Y ela, D., Ew ert, S., Fitzgerald, D., Sandler, M.: On the importance of temp o- ral context in pro ximity kernels: A v o cal separation case study . In: Audio Engineer- ing So ciety Conference: 2017 AES International Conference on Semantic Audio. (Jun 2017) 6. F ano Y ela, D., Ewert, S., O’Hanlon, K., Sandler, M.B.: Shift-inv ariant kernel ad- ditiv e mo delling for audio source separation. In: Pro ceedings of the IEEE Interna- tional Conference on Acoustics, Speech, and Signal Pro cessing (ICASSP), Calgary , Canada (2018) 7. Rafii, Z., Pardo, B.: Music/voice separation using the similarity matrix. In: ISMIR. (2012) 583–588 8. Liutkus, A., FitzGerald, D., Rafii, Z., Pardo, B., Daudet, L.: Kernel additiv e mo dels for source separation. IEEE T ransactions on Signal Pro cessing 62 (16) (2014) 4298–4310 9. Rafii, Z., P ardo, B.: Online repet-sim for real-time speech enhancemen t. In: Acous- tics, Speech and Signal Processing (ICASSP), 2013 IEEE International Conference on, IEEE (2013) 848–852 10. Cano, E., FitzGerald, D., Brandenburg, K.: Ev aluation of qualit y of sound source separation algorithms: Human p erception vs quantitativ e metrics. In: Pro ceedings of the Europ ean Signal Pro cessing Conference (EUSIPCO). (2016) 11. Vincent, E., Grib on v al, R., F ´ ev otte, C.: Performance measurement in blind audio source separation. IEEE T ransactions on Audio, Sp eec h, and Language Pro cessing 14 (4) (2006) 1462–1469 12. Radov anovi ´ c, M., Nanop oulos, A., Iv ano vi´ c, M.: Nearest neigh b ors in high- dimensional data: The emergence and influence of hubs. In: Pro ceedings of the 26th Annual International Conference on Machine Learning, ACM (2009) 865–872 13. Erd¨ os, P ., R ´ en yi, A.: On random graphs, i. Publicationes Mathematicae (Debrecen) 6 (1959) 290–297 14. Radov anovi ´ c, M., Nanop oulos, A., Iv ano vi´ c, M.: Nearest neigh b ors in high- dimensional data: The emergence and influence of hubs. In: Pro ceedings of the 26th Annual International Conference on Machine Learning, ACM (2009) 865–872 15. Liutkus, A., St¨ oter, F.R., Rafii, Z., Kitam ura, D., Rivet, B., Ito, N., Ono, N., F onteca v e, J.: The 2016 signal separation ev aluation campaign. In: International Conference on Latent V ariable Analysis and Signal Separation, Springer (2017) 323–332
Original Paper
Loading high-quality paper...
Comments & Academic Discussion
Loading comments...
Leave a Comment