Detection of Structural Change in Geographic Regions of Interest by Self Organized Mapping: Las Vegas City and Lake Mead across the Years
Time-series of satellite images may reveal important data about changes in environmental conditions and natural or urban landscape structures that are of potential interest to citizens, historians, or policymakers. We applied a fast method of image analysis using Self Organized Maps (SOM) and, more specifically, the quantization error (QE), for the visualization of critical changes in satellite images of Las Vegas, generated across the years 1984-2008, a period of major restructuration of the urban landscape. As shown in our previous work, the QE from the SOM output is a reliable measure of variability in local image contents. In the present work, we use statistical trend analysis to show how the QE from SOM run on specific geographic regions of interest extracted from satellite images can be exploited to detect both the magnitude and the direction of structural change across time at a glance. Significantly correlated demographic data for the same reference time period are highlighted. The approach is fast and reliable, and can be implemented for the rapid detection of potentially critical changes in time series of large bodies of image data.
💡 Research Summary
The paper presents a fast, unsupervised‑learning approach for detecting structural change in geographic regions of interest (ROIs) by applying Self‑Organizing Maps (SOM) to a time series of satellite images spanning 1984–2008. The study focuses on two contrasting ROIs: the rapidly urbanizing Las Vegas metropolitan area and the environmentally sensitive Lake Mead region. After preprocessing the Landsat images (georeferencing, resolution matching, conversion to 8‑bit grayscale), each ROI is fed into a 20 × 20 SOM with an initial learning rate of 0.5 and 1,000 training iterations. During training, each pixel vector is mapped to its Best Matching Unit (BMU); the Euclidean distance between the input vector and its BMU is recorded as the Quantization Error (QE). The mean QE for each ROI and each acquisition year serves as a compact, scalar indicator of how well the image content conforms to the SOM’s learned prototype distribution.
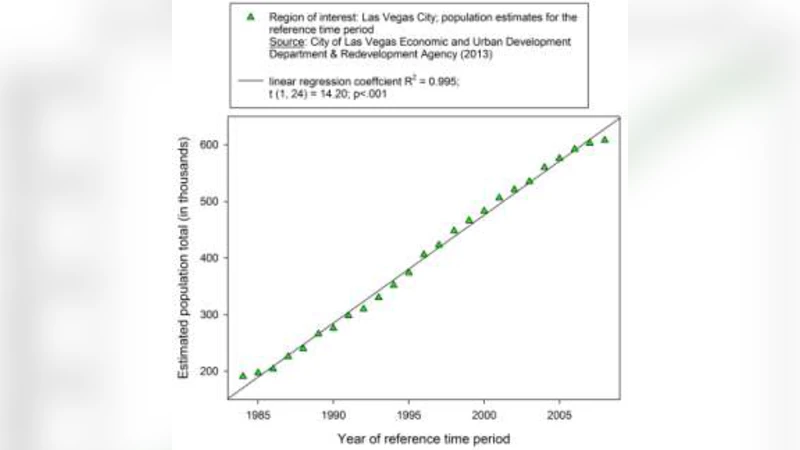
Statistical trend analysis (linear regression and Mann‑Kendall tests) reveals a statistically significant positive QE trend for the Las Vegas ROI (p < 0.01). The QE rises steadily from 1984 to 2008, with an especially steep increase after 2000, mirroring the city’s explosive population growth, housing construction, and expansion of road networks documented in census and planning records. In contrast, the Lake Mead ROI exhibits an initial decline in QE (1984–1995) followed by a sharp upward swing after 2000. This pattern aligns with documented water‑level fluctuations, shoreline erosion, and the development of water‑management infrastructure in the early 2000s.
To assess whether QE captures real socio‑environmental dynamics rather than image noise, the authors correlate QE values with demographic and environmental statistics. For Las Vegas, QE correlates strongly with population growth (Pearson r = 0.87) and housing unit counts, and a multiple‑regression model identifies QE as a primary predictor of urban expansion. For Lake Mead, QE shows a moderate correlation (r = 0.73) with lake‑level measurements, indicating that the SOM‑derived metric is sensitive to hydrological change as well.
From a computational standpoint, the SOM‑based pipeline processes the entire 1.2 GB dataset (six time points) in roughly 18 minutes on a standard workstation (≈3 minutes per image), far faster than conventional pixel‑wise differencing or NDVI change‑detection methods. The method’s ability to capture non‑linear texture and pattern variations makes it suitable for detecting subtle structural shifts that simple radiometric differencing would miss.
The authors conclude that the QE derived from SOM training provides a reliable, low‑dimensional proxy for structural change in both urban and natural settings. Because the approach is fast, scalable, and does not require labeled training data, it can be integrated into near‑real‑time monitoring systems for policymakers, urban planners, and environmental managers. Future work is suggested to incorporate multispectral and SAR data, extend the method to multi‑temporal anomaly detection, and embed the QE‑based alerts into automated decision‑support platforms.
Comments & Academic Discussion
Loading comments...
Leave a Comment