Similarity based hierarchical clustering of physiological parameters for the identification of health states - a feasibility study
This paper introduces a new unsupervised method for the clustering of physiological data into health states based on their similarity. We propose an iterative hierarchical clustering approach that combines health states according to a similarity cons…
Authors: Fabian Schrumpf, Gerold Bausch, Matthias Sturm
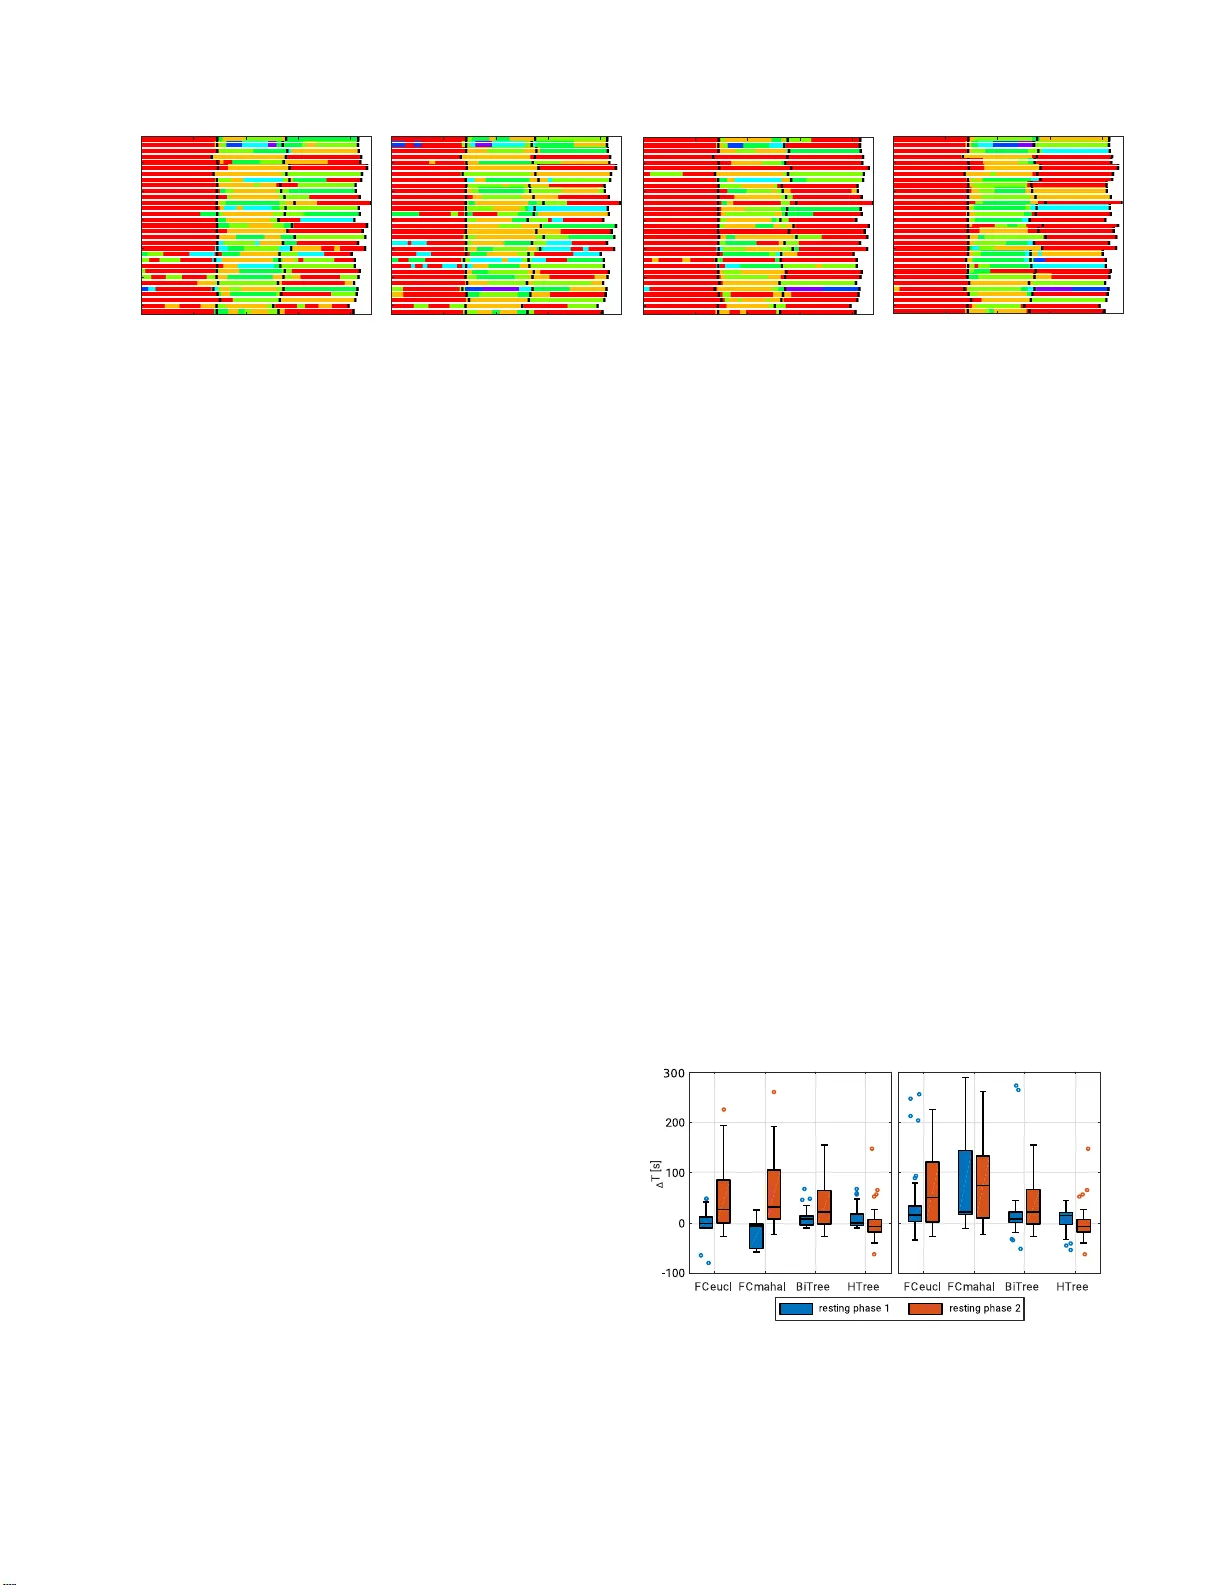
Similari ty based hierarc hical clustering of physiological paramete rs for the identification of health states – a feasibility study Fabian Schrumpf ∗ , Gerold Ba usch ∗ , Matthias Sturm ∗ and Mirco Fuc h s ∗ ∗ Leipzig Uni versity of Applied Sciences (HTWK), Labor atory fo r Biosignal Processing Abstract —This p aper i n troduces a new un su pervised method fo r the clustering of phy siological data into h ealth st ates based on their similarity . W e propose an iterative hierarchical clust erin g approach that combines health states according to a similarity constraint to new arbitrary health states. W e app lied our method to experimental data in which the physical strain of subjects was systematically varied. W e d erived h ealth states based on parameters extracted from ECG data. The occurrence of h ealth states sh ows a h i gh temporal corr elation to the experimental phases of the physical ex ercise. W e c ompared our method to other clustering algorithms and found a significantly hi gher accuracy with r espect to the identi fication of health states. Index T er ms —ECG, h ealth state, clustering I . I N T R O D U C T I O N W earable sensor technolog ies are b e coming m ore a n d m o re sophisticated. No wadays it is possible to condu c t recording s of a mu ltitude of physiolo gical signals (e.g. electrocar diogram , ECG) over se veral d ays by means of extrem ely miniatur- ized battery-d riv en system s. These systems are the basis for new clinical applications a s, for in stance, v ital parameter monitorin g in patien ts lo ng before and long after su rgica l interventions. However , recordin g such data is useless without approp riate pro cessing and an a ly zing me th ods along with suitable v isualization and aler ting stra tegies in case of relev ant medical events. M ore precisely , it is nece ssary to (1) extract relev ant p hysiologica l param eters, (2 ) to assess them not on ly accordin g to som e thresho ld s but also regarding th eir medica l importan ce for the individual p atient (that mean s with respect to the p articular disease of the patient), and (3) to der iv e some sort of c lassification of th e current ar bitrary h ealth state of a patient. No te that th e health state should b e u nderstood as a certain combination of vital p arameters such as th e heart rate (HR) and o xygen saturation. It does not describe a par ticular condition of a p a tient (suffering f rom a certain disease or a certain degree of illness). Recent ad vances in machine learnin g led to v arious ap- plications of data mining appr o aches for the pred iction of adverse clinical e vents [1]. Th ese app roaches common ly re ly on the definition and autom ated adoption o f thresho ld s. Th ey are b ased on the extraction of v ital paramters from physio- logical signals and their subsequen t class ification acco r ding to p redefined thresholds [ 2]. However , it is o ften difficult to define appro priate absolu te thresh olds, n ot least since labelled training data is still limited and only av ailable fo r certain diseases (e.g. spec ific h eart co nditions) [3]. Hen ce, the gen eral assessment of a p atients h ealth state during h is/her daily routine still remains an issue to be add r essed. It is very likely that similar health states can be described by a similar set o f physiolo gical par ameters. It m ight be useful to assess the similarity between these par ameter sets in order to identif y similar health states as well as changes from one health state to another . W e pr opose an iter a ti ve hierar chical clustering m e thod which is based on a similarity measure. If at least two par ameter sets ar e fo und to be similar accordin g to th is m easure, th ey are assigned to the same h ealth state. The similarity can be assessed using various techniques. W e utilized a r ather straig h tforward app r oach, i.e. the Mahalan obis distance. Our method is un supervised as it only relies on unlabelled data and do e s not n eed any a p riori assump tions on the expec ted numbe r of h ealth states. It is particular ly suited for the analysis o f data which ar ises, for in stance, in a clinical setting. Here, we pre sent an experimental study to d emonstrate the ab ility of our meth o d to id entify co rrelates between a set of p hysiologica l para m eters an d an arb itrary health state. Subjects we re asked to p e r form ph y sical exercises in ord er to modulate their physical strain. W e record ed ECG data and extracted several parameters (e.g., respiratory rate). The automated clustering of health states based o n our approach revealed an excellen t co r respond ence with the labelled refer- ence data, particularly in comp arison to several o ther meth o ds. The method could th us be helpfu l in a clinical setting, where doctors are co nfron te d with a great variety of vital parameters gathered over lon g p eriods by providing alerts to the staff when a multitude o f vital parameters take unusual values. It could be used to construct grap h s that describe the alteration of health states over time. Fro m a med ical perspec tive, this provides the o p portun ity to easily asses the d ev elopment oF a patients conditio n. I t migh t also b e possible to identify patterns o f h ealth states which inidcate a particular disease. The ev alutation of ou r meth od in a clinical setting is part of our curren t resear ch. I I . M E T H O D S A. Similarity based hierar chical clustering Our method identifies b iophysio lo gical states by succes- si vely dividing a data set into clusters ba sed o n their similarity . Giv en is the par ameter x n n ∈ R M , wh ich co ntains M physiolog ical param eters (i. e . fea tu res) that ar e representa tive 3 2 1 no. of iterations samples x x x x x x x x x x x x feature 1 feature 2 Fig. 1. Left: Example of the similarity based hierarchic al clustering approach. A set of 12 samples is clustere d into 3 health states. Right: The samples are combined based on their Mahalanob is distance. for sample n (i.e. time po int) of the data set consisting of N samples. W e regard e ach of the samples in the d ata set as a health state h k k ∈ [1 . . . N ] . The basic idea of our ap p roach is to comb ine different h ealth states which are similar a ccording to some co nstraint to a n ew health state. W e expect that this leads to a small numb er o f potential health states because certain ph ysical conditio ns can be character ized by a distinct set o f parameter values. M o re imp ortantly , we b eliev e that the variation o f the similarity constraint allows the iden tification of meaningful health states as, for instance, sleep phases o f a subject. W e utilized the Mahalan obis distance as a similarity measure since it allows to acco unt for potential corr elations between th e features. This is often the case in mu ltinomial clustering pro blems where fea tures can differ in scale and variance amo ng themselves [4]. Gi ven two feature vectors x i and x k and the covariance matrix of the un derlying sample set C ∈ R N × N , the Mahalano b is distance is defined as: d ( x i , x k ) = q ( x i − x k ) T C − 1 ( x i − x k ) (1) Note that, in th e case of C = 1 , d ( x i , x k ) would be the ordinar y Euclide an d istance between samples x i and x k . The first step is the calcu lation of th e pairwise Mahalan obis distance betwee n all samples of the data set. Secon d, samples and th e ir nearest neighbou r s f or whic h the d istance is lower than a cer tain th reshold are assign ed to the same cluster (i.e., health state). Note that this means that not all samples in the resulting cluster fulfill the pairwise similarity criterion. A small threshold v alue repr esents a r estrictiv e similarity constraint and prevents the gener ation of large clusters in th e first iteration step. The selection of this thre sh old is essential for the ability to disting ish pa r ticular states in th e d a ta set. Third, the c entroids of a ll different clusters are computed. Each centroid serves as a r epresentative fo r th e co rrespond ing cluster and is used for subseque n t iteratio ns. Fourth , the threshold (i.e. , the similarity c r iterion) is relaxed by an amoun t of 5 p ercent in or der to enab le the cluster s to grow . T hese steps are repeate d until an op tim ization criterion – fo r instance a certain c o mpactness of the clu sters – is rea c hed. In o ur feasibility study , howev er , we d id not u se such an optimization criterion. For th e sake of simp licity , we repeated this pr ocedure until a predefin e d n umber of iterations was reached. The prop osed algor ithm comb ines th e d ata into a tree-like structure an d is therefore related to classical ag glomerative Fig. 2. The exp erimenta l procedure consists of two resting phases (5 minutes each)) and a phase of physica l strain (3 minutes). The end of each phase is indica ted by means of a trigger button ( t 0 , t 1 , t 2 , t 3 ). The follo wing measures where deri ved: T he duration of each detect ed resting state ( T S 1 , T S 2 ), the duratio n of each true resting phase ( T P 1 , T P 2 ). Offset of the first resting state ( t of f 1 ), onset of the second resting state t on 2 . clustering. The main difference is that the resulting tree is not binary . This can be seen in Fig. 1. B. Experimental study W e car ried out an experim ental study in order to examine the f easibility o f o ur approach. Th e aim was to iden tify different phases of p hysical strain by means of the proposed clustering ap proach . W e re c r uited 32 healthy subjects am ong the employees and stud ents of our resear ch g roup. Their mean age was 2 6.8 ye a rs ( SD = 5.5 years). T he experiment con sists of thr ee different phases which are illustrated in Fig. 2. The subjects remained in a supine position an d where told to relax durin g th e r e sting phases. Th ey were asked to p erform squats in order to raise their respir atory freq uency and heart rate durin g th e exercise phase. Single chan nel ECG data was recorde d using a PLUX bio signals resear cher mea surement system (PLUX wireless biosign als, Lisbon, Portugal). The phases were labelled by mean s of a trigger b utton. The E CG record ings were used to extract f eatures to distin- guish between different states of phy sical strain. For instance, increased respiratory rates and shortened Q-TE duration s are known to b e co rrelated to ph ysical strain [5]. In a prepro- cessing step, baseline removal was applied an d the 50 Hz powerline inter ference was removed [6]. The signal was then subdivided into w in dows of 30 s length and an overlap of 29 s between adjacent windows. The following features were extracted in each window: (i) respiration rate, (ii) r e sp iration depth, (iii) heart rate variability ( HR V) and (iv) timin g lag between the onset of the QRS-w av e and the offset of the T -wa ve (Q-TE) [5]. In o r der to estimate the H R V , the QRS complexes including their on - and o ffsets were extracted [7], [8]. The respirato r y signal was estimated by interp olating the amplitudes o f the R-peak [9]. The depth of resp ir ation was then calcu lated as the root mean square value o f the respirato r y signal. The respirator y r ate was extracted by means o f th e autocorr elation fu nction of the respirato ry signal [10]. The T -wa ve detection was perf o rmed accordin g to th e algo rithm described in [11]. These fou r features were th e basis for the subsequent hierarchica l clusterin g o f e a c h individual data set. W e used a total of 35 iterations. Th e thr eshold was set to d thr e sh = 0 . 05 max ( d mahal ) for th e first iteratio n. This value was in - creased by 5% befo re ea ch iteration. 5 10 15 20 25 30 200 400 600 800 a) b) c) d) 200 400 600 800 200 400 600 800 200 400 600 800 subjects t [s] t [s] t [s] t [s] Rest Ex. Rest | | | | Rest Ex. Rest | | | | Rest Ex. Rest | | | | Rest Ex. Rest | | | | Fig. 3. Clustering result by means of the ECG-based feat ures (respir ation freque ncy , respiration depth, HR V , Q-TE duration ) using a) Euclidea n distanc e based fuzzy clusteri ng (FCeuc l); b) Mahalanobis distance based fuzzy clustering (FCmahal); c) binary hierarch ical clust ering (BiTree)); d) similarity based hierarc hical clusteri ng (Htree). Each line in the plots corresponds to the cluste ring results of a single subject . W e compared ou r m ethod to three o ther clustering al- gorithms. First, a fuzzy clustering method based on the Gustafson-Kessel-Algorithm ( FCeucl) was used [12]. Th is is a top down ap proach wh ich optim izes the probability dis- tribution of each sample to belon g to a certain cluster . The algorithm is based on the a priori defin itio n of the n umber of expected clusters. The proba b ility estimatio n is based on the Euclidean distance between the sample and the centres of the clusters. Th e second method is a variation of the first one. It uses Mahalanob is d istances (FCmahal) rather than Eu clidean distances [ 13]. The th ird method is a classical h ierarchical clustering appro ach that gr oups samples over a variety of distances by building a binary tree (BiT re e ). Finally , the r esulting clusters an d their occurr ences d uring the experiment wer e ev aluated to extract the duration of the th ree different phases f rom the ind ividual data sets. W e expected to find two major health states that coincide with the physical strain during the three experimental phases. First, a resting state during the first re la x ation ph ase, a stress state during ph ysical exercise, and an other r esting state in th e second relax ation ph a se. W e identified the dominan t cluster in each phase an d comp uted its start and end time. W e co mpared these times with those ob tained o n th e basis o f the trigger button. W e calcu la te d the time dif ference t d 1 (Eq. 2) between the end of the dominan t cluster and the time of the first button press at time t 1 (see also figure 2 ). T his ind icates how accurately the algorithm detects chan ges in phy sical strain. For th e same reason, the d uration t d 2 (Eq. 3) between the beginning of the seco n d resting state an d the second button press at tim e t 2 was deter mined. Add itio nally , the duratio n of th e resting p hases ba sed on th e cluster in g ap proach es and based on the trigge r chan n el were compared ( ∆ T 1 and ∆ T 2 see Eq. 4 and 5). t d 1 = t 1 − t off1 (2) t d 2 = t on2 − t 2 (3) ∆ T 1 = T P1 − T S 1 (4) ∆ T 2 = T P2 − T S 2 (5) C. Sensitivity Analysis W e pe r formed a sen siti vity analysis in order to ev aluate th e influence of the thresho ld pa rameter d thr e sh on the clustering results obtained with the HT ree metho d. T he th reshold pa- rameter was varied in a range from d thr e sh = 0 . 1 . . . 0 . 8 . The times an d durations of the major phases extracted using th ese different thresho ld s were compar e d to results o btained b y the setup ( d thr e sh = 0 . 5 ) d escribed in section II-B. This p articular threshold value was empirica lly determined and lead s to the best clustering results of the data sets. I I I . R E S U LT S Fig. 3 shows th e ide n tified clusters (color-coded) over time for all metho ds and su b jects. Ea c h black marker represen ts a button p ress and in dicates the true en d of a p a rticular experimental phase (cmp. Fig. 2). It can be seen that all methods establish an initial state (deno ted in r ed) durin g the first resting ph ase almo st c o nsistently fo r all subjects. This can be explained with the fact that the subjects lie in a supin e position and a r e rela xed which leads to a low variation of the under ly ing ph ysiological p arameters. Durin g th e exercise phase the hu man body reacts to the in creased physical strain with an in creased respiration fr equency an d respiration depth , a stron ger HR V and shorter Q-TE-d urations. It can be seen that the algorithms consistently detect a ch ange of the health state in a high tempo r al corr e la tio n to the first button press. That means that the beginning of the exercise phase is detected Fig. 4. Left: Delay between resting state offset and first butt on press during resting phase 1 ( t d 1 blue) and third button press and resting state onset during resting phase 2 ( t d 2 orange); Right: duration dif feren ce between first resting state and resting phase 1 ( ∆ T 1 blue) and betwee n second resting phase and resting phase 2 ( ∆ T 2 orange) ∆ t 1 ( d thresh ) - ∆ t 1 ( d thresh =0.5) ∆ t 2 ( d thresh ) - ∆ t 2 ( d thresh =0.5) ∆ t d1 ( d thresh ) - ∆ t d1 ( d thresh =0.5) ∆ t d2 ( d thresh ) - ∆ t d2 ( d thresh =0.5) 0.1 0.2 0.3 0.4 0.5 0.6 0.7 0.8 300 200 100 0 -100 -200 -300 -400 d thresh t [s] Fig. 5. Results of the sensiti vity analysis in order to in vestig ate the influence of d thr esh on the clu stering result s. The threshold parameter was var ied in a range of t thr esh = 0 . 1 . . . 0 . 8 and the delay times(Eq. 2 and 3) as well as the phase durati ons (Eq. 4 and 5) were compared to the ones obtained with d thr esh = 0 . 5 . correctly . However , the states ar e mu ch less stable and even additional states a re introd uced. After the exercise ph ase is completed (secon d b lack marker) the subjects relax during the second r e sting phase. W e expec te d th at the resulting health state resembles th e state from the first resting phase. The results fo r the clusterin g m ethods BiT ree an d HT ree clearly confirm o ur expectation s fo r most subjects. Howe ver, th ere ar e some sub jects ( e.g. subject 3) for which the health state in the second re sting phase is n ot equivalent to th e state in the fir st resting ph ase. In stead, an additional state is introduced which seems to be in tempor al correlation with the d u ration of the second resting phase. This e ffect occurs e ven mor e f requent in the clustering metho ds FCeucl a nd FCmahal. Next, a q uantitative ev a lu ation o f th e re sults was carr ied ou t. W e analy sed the temporal consistency between the clustering results an d th e exper imental procedur e. In particu lar , we compare d the time of the end of th e first r esting state obtained by mean s of the button press ( t 1 ) and o n th e basis o f the clustering ap proach es (see Fig. 4 lef t). Likewise, we com pared the times of the beginn ing of the second resting state (see Fig. 4 left). Fur thermor e we calculated the d u ration of th e resting states o btained u sing the clustering me th ods and comp a red them as well (Fig. 4, right). These values serve as a measure of how accu r ately th e method s follow th e changes in physical activity . The results indicate th at mo st of the algor ithms d etect a health state chang e in temporal proxim ity to a true chan ge of the physical activity . It can be seen in Fig. 4 (left panel) that the time d ifferences obtained for meth od HT r ee are particularly sm a ll. In other words, the metho d provides a relativ ely g ood d etection of the beginnin g and th e end of the exercise ph ase. Likewise, the method s FCeucl and BiT re e provide a good d etection of the b eginning of the exercise pha se but clearly perform weaker r egar d ing the correct detection of the beginn in g of the second resting phase. The time differences obtained fo r metho d FCmahal ar e large comp ared to all other methods. The results obtained from an alyzing the duration of the resting p h ases are depicted in Fig. 4 ( r ight pa n el). It can be seen th at the duration s o btained f or algo rithm HT ree are very similar to the tru e duration of the experimen tal ph ases. The methods FCeuc l and BiT r e e pr ovid e a go o d estimation for the du ration of th e first resting phase. Howe ver , the difference between the tru e and the estimated d uration of the second resting p h ase is ra th er large for these two m ethods. Likewise to the p revious an alysis, method FCmahal p rovides the weakest perfor mance and leads to large time differences. W e perform ed two-sample K o lmogor ov- Smirnov tests to check whether the results obtained by the HT ree m ethod are significantly different from th e o nes obtain ed from the other methods. Th e re sults can be seen in table I. It can be con cluded that th e HTree method performs significantly better regarding the detection of the onset and dur ation of the second resting state compare d to other appr oaches. T ABLE I P - VAL U E S O F T H E T W O - S A M P L E K S - T E S T C H E C K I N G W H E T H E R T H E T I M E S O B TA I N E D W I T H T H E B I T R E E M E T H O D A R E S I G N I FI C A N T LY D I FF E R E N T F RO M T H E T I M E S O B TA I N E D B Y T H E O T H E R M E T H O D S FCeucl FCmahal HTre e t d 1 0,36 < 0 . 05 0.14 t d 2 < 0 . 05 < 0 . 05 < 0 . 05 ∆ T 1 0,21 < 0 . 05 0,15 ∆ T 2 < 0 . 05 < 0 . 05 < 0 . 05 W e con ducted a sensitivity analysis to in vestigate h ow a particular th reshold para m eter d thr e sh influences the clustering results. The parameter was systematically varied a n d the clustering r esults (eg. t d 1 , t d 2 , ∆ T 1 and ∆ T 2 ) wer e compared to the results obtained for d thr e sh = 0 . 5 . Figu r e 5 shows that a small value leads to huge deviations from the optim um d thr e sh = 0 . 5 . A larger threshold value would be less prob- lematic. I V . D I S C U S S I O N W e have in troduced a new m ethod for the id entification of discrete individual h ealth states. Ou r approa c h is b ased o n determinin g the similarity b etween a certain set o f p hysio- logical par ameters at different time po ints. This leads to a n iterativ e hierarch ical clustering procedur e in which existing health states are comb ined into n ew h ealth states. W e pr oposed to use the Mahalano bis distance to estimate similarities but different mea sures m ig ht be applied as well. W e have proven the g eneral feasibility of our ap p roach by app lying the metho d to experimen ta l data. W e conducted an experimental study in which subjects un derwent different levels o f physical strain. The clusterin g of health states was perfo rmed using ou r propo sed appr oach and three reference method s. The results obtaine d with our pro posed p rocedu re revealed a high tempo ral correlation b etween the derived health states and the tr ue expe rimental phases. More impo rtantly , we identified phases w ith stable h ealth states before and after the ex er- cise phase consistently over subjects. These two states were identical in most of th e subjects. There are different reasons why this was not the case in some subje c ts. First, we d id not account for the particular physical conditio n when rec r uiting the sub jects. Some sub jects migh t nee d a par ticu larly lon g recovery time which can lead to d ifferent health states after exercise. Likewise, the absence o f a resting phase prior to the experiment m ig ht cau se a higher initial level of phy sical stress at the beginn ing of the experiment and, therefor e , a different health state. W e have sh own that o ur method sh ows a sig n ificantly better perfor mance compared to the ref e rence method s, particularly regarding the ∆ T 2 and the t d 2 measure. The measures ∆ T 1 and t d 1 , thoug h, on ly p rovide a sig n ificantly better p erforma nce when compared to th e FCmahal method. W e conclude that all considered methods are able to detect a transition from a re st- ing state to a n exercise state more or less precisely . Howe ver, only the metho d pro p osed her e lead s to a similar classification of the health states be f ore and after the experimental phase consistently acr oss nearly all subjects. It should be no ted th at our experimental d esign is simple in a sense that it allowed us to d istinguish between two very different states o f physical strain very clearly . It is no t in the scop e of the present work to discriminate between different le vels of phy sical ex ercise. It is straightfor ward to extend our method in se veral ways. An impo rtant issue is the selection o f a cr iter ion to stop the iterativ e proced ure. Th e utilization of a more sp ecific criterio n (e.g. cluster com pactness or a cer ta in c ost functio n that is bein g optimized) might lead to better clustering results. Another importan t issue is th e selection of th e featur es as a basis for clustering. It is obvio us that the p arameters th at were selected here are suffi ciently suited to explain the subjects hea lth states during the conducted experim ent. However , othe r applicatio ns might need additional information . T h is can be drawn, for example, fro m alter native ph ysiological para m eters o r even from no n-phy siological featu res as, for instance, behavioural data. Another aspect worth inves tigating is th e pe rforman ce of our me thod in a ty pical machin e lear ning setting wher e a defined subset of subjects serves as a training set and the learned clu ster parameters ar e app lied to a different set of subjects. This would also r equire additio n al infor mation on the subject (e.g. body mass, stature). Our final c o nclusion is that our me th od is ap p licable for the identificatio n of h ealth states based on physiolo gical d ata. Apart fro m the detection of phy sical strain, there are oth er relev ant application scenarios as, for example, the detection of pain from phy siological an d b ehavioural d ata. A C K N O W L E D G M E N T S This work was fu nded by the German Feder al Ministry of Education and Research (BMBF) (FKZ 03FH03 2IX5). R E F E R E N C E S [1] R. K. Kher , “Mobile and E-Healthca re: Recent Trends and Future Directi ons, ” J . of Health & Med. Econ. , vol. 2, no. 3, pp. 1–8, 2016. [2] A. R. M. Forkan et al. , “V iSiBiD: A learning model for early disco very and real-time prediction of sev ere clinica l eve nts using vital signs as big data, ” Comp. Networks , vol. 113, pp. 244–257, 2017. [3] A. L. Goldberger et al. , “PhysioBank, PhysioT oolkit, and PhysioNet: Components of a New Research Resource for Complex Physiolo gic Signals, ” Cir culat ion , vol. 101, no. 23, pp. e215–e 220, 2000. [4] P . Mahalanobi s, “On the general ized distance in statisti cs, ” Proc. of the Nat. Inst. of Sci. , vol. 2, pp. 49–55, 1936. [5] T . Hijzen et al. , “The electroc ardiogra m during emotiona l and physical stress.” Int. J. of Psychophysiol ogy , vol . 2, no. 4, pp. 273–279, 1985. [6] F . Zhang et al. , “Bi oelec tric signal detr ending using smoothness prior approac h, ” Med. Eng. & Physics , vol. 36, no. 8, pp. 1007–1013, 2014. [7] Cuiwei Li et al. , “Detecti on of ECG characte ristic points using wav ele t transforms, ” IEEE T rans. Bio-Med . Eng. , vol. 42, no. 1, pp. 21–28, 1995. [8] A. I. Manriquez et al. , “An algorithm for QRS onset and offset detecti on in single lead electroc ardiogra m records, ” in 2007 29th A nnu. Int. Conf. of the IEEE Eng. in Med. and Biology Soc. , no. 2, 2007, pp. 541–544. [9] Y . Zhao et al. , “Deri vati on of respiratory signals from single -lead ECG, ” P r ocee dings - 2008 International Seminar on Future B ioMedic al Informatio n Engineering , F BIE 2008 , vol . 12, pp. 15–18, 2008. [10] F . Schrumpf et al. , “Deriv ation of the respiratory rate from directly and indirec tly measured respira tory signa ls using autocorrela tion, ” Curr ent Dir ectio ns in Biomed. Eng. , vol. 2, no. 1, pp. 241–245, 2016. [11] H. Chatterje e et al. , “Real Time P and T W ave Detecti on from Ecg using Fpga, ” 2nd Int. Conf. on Comput., Commun., Contr ol and Inform. T echnol. , vol. 4. , pp. 840–844, 2012. [12] D. Gustafson et al. , “Fuzzy clustering with a fuzzy cova rianc e matrix, ” in 1978 IEE E Conf. on Decision and Contr ol , no. 2, 1978, pp. 761–766. [13] X. Zhao et al. , “Mahalanob is distance based on fuzzy cluste ring al- gorithm for image segment ation, ” Digital Signal Pr ocess. , vol. 43, pp. 8–16, 2015.
Original Paper
Loading high-quality paper...
Comments & Academic Discussion
Loading comments...
Leave a Comment