Multiview Hierarchical Agglomerative Clustering for Identification of Development Gap and Regional Potential Sector
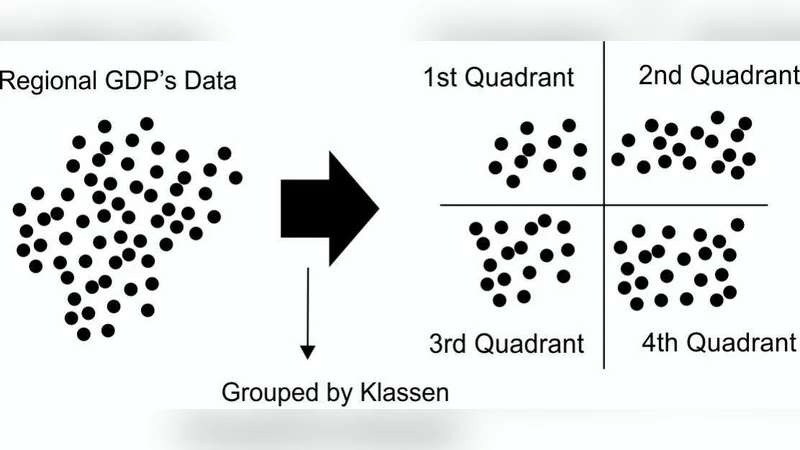
The identification of regional development gaps is an effort to see how far the development conducted in every District in a Province. By seeing the gaps occurred, it is expected that the Policymakers are able to determine which region that will be prioritized for future development. Along with the regional gaps, the identification in Gross Regional Domestic Product (GRDP) sector is also an effort to identify the achievement in the development in certain fields seen from the potential GRDP owned by a District. There are two approaches that are often used to identify the regional development gaps and potential sector, Klassen Typology and Location Quotient (LQ), respectively. In fact, the results of the identification using these methods have not been able to show the proximity of the development gaps between a District to another yet in a same cluster. These methods only cluster the regions and GRDP sectors in a firm cluster based on their own parameter values. This research develops a new approach that combines the Klassen, LQ and hierarchical agglomerative clustering (HAC) into a new method named multi view hierarchical agglomerative clustering (MVHAC). The data of GRDP sectors of 23 Districts in West Java province were tested by using Klassen, LQ, HAC and MVHAC and were then compared. The results show that MVHAC is able to accommodate the ability of the three previous methods into a unity, even to clearly visualize the proximity of the development gaps between the regions and GRDP sectors owned. MVHAC clusters 23 districts into 3 main clusters, they are, Cluster 1 (Quadrant 1) consists of 5 Districts as the members, Cluster 2 (Quadrant 2) consists of 12 Districts and Cluster 3 (Quadrant 4) consists of 6 Districts.
💡 Research Summary
The paper introduces a novel analytical framework called Multi‑View Hierarchical Agglomerative Clustering (MVHAC) to simultaneously identify regional development gaps and sectoral potentials. The authors note that Indonesia, like many developing countries, faces widening inter‑regional disparities, and that policymakers need tools that can both quantify these gaps and highlight which economic sectors are most promising in each area. Traditionally, two separate methods have been employed: Klassen typology, which classifies regions into four quadrants based on growth rate and contribution to Gross Regional Domestic Product (GRDP), and Location Quotient (LQ), which assesses the relative competitiveness of individual economic sectors. While useful, each method alone provides only a partial view—Klassen does not reveal intra‑quadrant differences, and LQ does not compare regions.
MVHAC integrates the strengths of both approaches with hierarchical agglomerative clustering (HAC). The procedure consists of three stages. First, for each district the authors compute a growth‑rate vector (DK) and a contribution vector (DP) using the current and previous year’s GRDP data; the formulas are Euclidean‑based transformations of the standard growth‑rate and contribution equations. Based on the relative magnitudes of DK versus DP, each district is assigned to one of the four Klassen quadrants (I–IV). Second, the Location Quotient for each GRDP sector is calculated as the sector’s share of district GRDP divided by its share of provincial GRDP. Sectors are labeled as “basic” (LQ > 1), “non‑basic LQ = 1”, or “non‑basic LQ < 1”. This yields a multi‑dimensional label set for every district. Third, within each Klassen quadrant the authors construct a distance matrix among districts using the sector‑level LQ vectors and apply HAC. The clustering can use single, complete, average, or centroid linkage; the authors chose a linkage that best reflects proximity of sectoral structures. The resulting dendrogram visualizes how closely districts are related in terms of both overall growth dynamics and sectoral strengths.
The empirical test uses data from 23 districts in West Java, covering nine GRDP sectors (agriculture, mining, manufacturing, utilities, construction, trade & hospitality, transport & communication, finance & services, and other services) for a current year and the preceding year. Applying MVHAC, the authors obtain three major clusters: Quadrant 1 (5 districts), Quadrant 2 (12 districts), and Quadrant 4 (6 districts). Quadrant 1 districts exhibit high growth and contribution rates and possess a majority of “basic” sectors, indicating robust, competitive economies. Quadrant 4 districts show low growth and contribution, with many “non‑basic” sectors, flagging them as priority targets for development interventions. Quadrant 2 districts fall in between, providing a nuanced middle ground.
The paper compares MVHAC against using Klassen alone, LQ alone, and a conventional HAC on raw GRDP values. Klassen alone yields the four quadrants but cannot differentiate districts within the same quadrant. LQ alone identifies sectoral competitiveness but lacks a regional comparative dimension. HAC alone clusters districts but offers no interpretive framework linking clusters to growth dynamics or sectoral advantage. MVHAC, by contrast, delivers a unified view where each cluster is interpretable in terms of both macro‑level development performance and micro‑level sectoral potential, and the dendrogram makes the proximity of districts visually apparent.
The authors highlight several advantages: (1) integration of multiple analytical perspectives into a single, policy‑relevant output; (2) clear visual representation that can be readily used by decision‑makers; (3) quantitative measurement of intra‑cluster similarity, which traditional methods lack. They also acknowledge limitations: the study’s geographic scope is confined to a single province, limiting generalizability; the number of clusters is implicitly set by the Klassen quadrants, which may not reflect the optimal data‑driven partitioning; only Euclidean distance is explored, ignoring alternative metrics; and no formal cluster validation indices (e.g., silhouette, Dunn) are reported, leaving the statistical robustness of the clusters untested. Moreover, the binary LQ threshold (LQ = 1) may oversimplify sector competitiveness, suggesting that a more graded or weighted approach could improve nuance.
In conclusion, MVHAC represents a meaningful methodological advance that merges growth‑rate analysis, sectoral competitiveness, and hierarchical clustering to provide a richer, more actionable picture of regional development gaps and potential sectors. The framework holds promise for informing targeted policy interventions, provided that future work expands the dataset, incorporates robust validation techniques, and refines the sectoral labeling scheme.
Comments & Academic Discussion
Loading comments...
Leave a Comment