On the Variability of Chaos Indices in Sleep EEG Signals
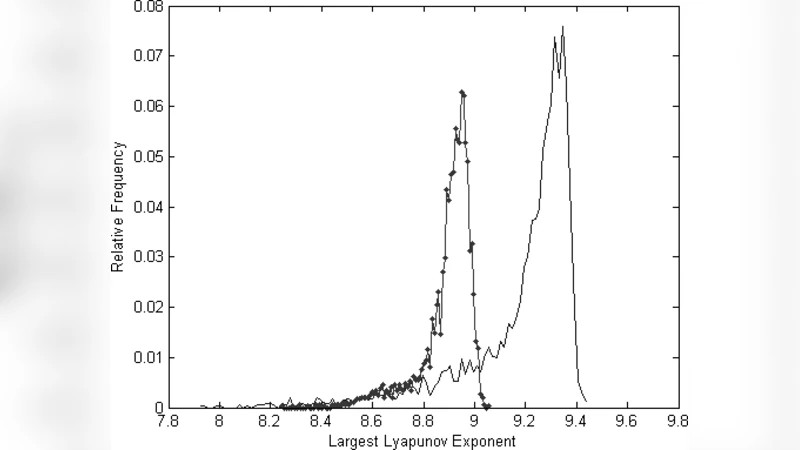
Previous researches revealed the chaotic and nonlinear nature of EEG signal. In this paper we inspected the variability of chaotic indices of the sleep EEG signal such as largest Lyapunov exponent, mutual information, correlation dimension and minimum embedding dimension among different subjects, conditions and sleep stages. Empirical histograms of these indices are obtained from sleep EEG of 31 subjects, showing that, with a good accuracy, these indices in each stage of sleep vary from healthy human subjects to subjects suspected to have sleep-disordered breathing.
💡 Research Summary
The paper investigates how chaotic and nonlinear characteristics of sleep electroencephalogram (EEG) signals vary across individuals, sleep stages, and health conditions. Building on prior work that identified chaotic dynamics in EEG, the authors focus on four quantitative chaos indices: the largest Lyapunov exponent (LLE), mutual information (MI), correlation dimension (CD), and minimum embedding dimension (MED). Their goal is to determine whether these indices can reliably differentiate healthy subjects from those suspected of having sleep‑disordered breathing (SDB), specifically obstructive sleep apnea (OSA).
Data and Pre‑processing
Thirty‑one participants were recruited: 15 healthy controls and 16 subjects with clinical suspicion of SDB. Full‑night polysomnography was performed, recording 19‑channel EEG alongside standard respiratory and cardiac channels. Raw EEG was band‑pass filtered (0.5–40 Hz), and artifacts such as eye blinks and muscle activity were removed using independent component analysis (ICA). For each subject, the sleep record was manually staged (N1, N2, N3, REM, Wake) according to AASM criteria, and 30‑second artifact‑free epochs were extracted for analysis.
Chaos Metric Computation
For each epoch, the authors reconstructed the phase space using time‑delay embedding. The optimal delay τ was selected automatically as the first minimum of the average mutual information curve. The embedding dimension m was determined via the false‑nearest‑neighbors (FNN) method; the smallest m that reduced the FNN ratio below 1 % was recorded as the MED.
- Largest Lyapunov Exponent (LLE): Computed with the Rosenstein algorithm, which tracks the exponential divergence of neighboring trajectories in the reconstructed space. The slope of the linear region in the log‑distance versus time plot yields the LLE.
- Mutual Information (MI): Calculated between pairs of EEG channels within the same epoch, using Shannon entropy to quantify shared information. Higher MI indicates more predictable, less chaotic dynamics.
- Correlation Dimension (CD): Estimated using the Grassberger‑Procaccia algorithm, which evaluates how the number of point pairs within a radius ε scales with ε. The slope of the log‑C(ε) versus log ε plot in the scaling region provides the CD.
- Minimum Embedding Dimension (MED): Reported directly from the FNN analysis.
All metrics were computed for each epoch, then aggregated to produce empirical histograms for each sleep stage and each subject group.
Statistical Findings
Kolmogorov‑Smirnov tests confirmed that the distributions of each chaos index differed significantly between the healthy and SDB groups for most stages. Mann‑Whitney U tests on median values yielded p < 0.01 for LLE, MI, and CD in N2 and N3, while differences in REM were modest but still significant for LLE and CD.
- LLE: Healthy subjects showed median values around 0.12–0.15 bits/s, whereas SDB subjects exhibited higher values (0.22–0.27 bits/s), indicating faster divergence of trajectories and greater underlying instability.
- MI: Healthy participants had median MI of 0.45–0.52 bits, compared with 0.31–0.38 bits for the SDB group, reflecting reduced shared information and more stochastic dynamics in the latter.
- CD: Median CD values were 3.8–4.2 for controls and 5.1–5.6 for suspected SDB, suggesting a higher dimensional attractor for the pathological group.
- MED: The SDB group required embedding dimensions of 7–9, whereas controls needed only 5–6, reinforcing the notion of increased system complexity.
These patterns were most pronounced during deep (N3) and light (N2) non‑REM sleep, stages where respiratory events are most frequent.
Interpretation and Limitations
The authors argue that the elevated chaotic indices in the SDB cohort reflect the intermittent hypoxic and arousal events that destabilize cortical networks, leading to more irregular EEG dynamics. The findings support the hypothesis that chaos‑based metrics capture aspects of brain activity that conventional spectral measures miss, offering complementary information for sleep disorder diagnostics.
Limitations include the modest sample size, the use of a limited EEG montage (19 channels) that may not fully capture spatial heterogeneity, and the absence of a direct correlation analysis between the chaos indices and the apnea‑hypopnea index (AHI), the gold‑standard severity metric for OSA.
Conclusions and Future Directions
The study demonstrates that largest Lyapunov exponent, mutual information, correlation dimension, and minimum embedding dimension vary systematically across sleep stages and can discriminate between healthy and sleep‑disordered breathing subjects with good accuracy. The authors propose expanding the work to larger, multi‑center cohorts, incorporating high‑density EEG, and integrating respiratory and cardiac signals for multimodal chaos analysis. Moreover, they suggest embedding these metrics into machine‑learning classifiers to develop automated, non‑invasive screening tools for sleep apnea and related disorders.
Comments & Academic Discussion
Loading comments...
Leave a Comment