Combining edge and cloud computing for mobility analytics
Mobility analytics using data generated from the Internet of Mobile Things (IoMT) is facing many challenges which range from the ingestion of data streams coming from a vast number of fog nodes and IoMT devices to avoiding overflowing the cloud with useless massive data streams that can trigger bottlenecks [1]. Managing data flow is becoming an important part of the IoMT because it will dictate in which platform analytical tasks should run in the future. Data flows are usually a sequence of out-of-order tuples with a high data input rate, and mobility analytics requires a real-time flow of data in both directions, from the edge to the cloud, and vice-versa. Before pulling the data streams to the cloud, edge data stream processing is needed for detecting missing, broken, and duplicated tuples in addition to recognize tuples whose arrival time is out of order. Analytical tasks such as data filtering, data cleaning and low-level data contextualization can be executed at the edge of a network. In contrast, more complex analytical tasks such as graph processing can be deployed in the cloud, and the results of ad-hoc queries and streaming graph analytics can be pushed to the edge as needed by a user application. Graphs are efficient representations used in mobility analytics because they unify knowledge about connectivity, proximity and interaction among moving things. This poster describes the preliminary results from our experimental prototype developed for supporting transit systems, in which edge and cloud computing are combined to process transit data streams forwarded from fog nodes into a cloud. The motivation of this research is to understand how to perform meaningfulness mobility analytics on transit feeds by combining cloud and fog computing architectures in order to improve fleet management, mass transit and remote asset monitoring
💡 Research Summary
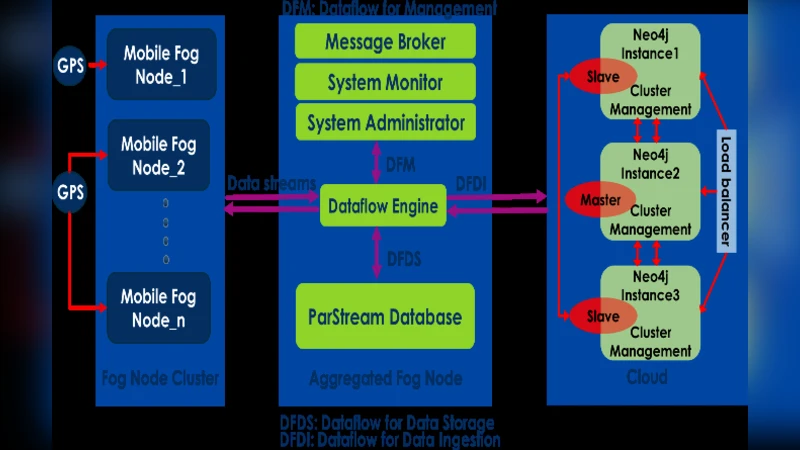
The paper presents a hybrid edge‑cloud architecture for real‑time mobility analytics on transit data streams generated by the Internet of Mobile Things (IoMT). The system is organized into three logical layers: (1) a sensing layer composed of mobile fog nodes installed inside buses, (2) an aggregated fog node acting as an access layer, and (3) a cloud core layer where heavyweight graph analytics are performed.
In the sensing layer, Cisco 829 GW‑LTE‑NA‑AK9 routers collect GPS coordinates, route identifiers, vehicle IDs, and timestamps at varying granularities (e.g., every 5 seconds, 30 minutes, or daily). A Python‑based data‑cleaning script runs on each mobile fog node and automatically handles five common error types: missing tuples, duplicate tuples, missing attribute values, redundant attributes, and incorrect attribute values.
Cleaned tuples are forwarded to the aggregated fog node, where the Edge Fog Fabric (EFF) platform orchestrates the data flow. EFF comprises a system administrator, a data‑flow editor and engine, a monitor, a message broker, and a ParStream database. It ensures continuous, bidirectional streaming of unbounded tuples, applying real‑time filtering, cleaning, and contextualization. Contextualization enriches each tuple with a high‑level mobility label. Using the Euclidean distance between consecutive points, the system assigns a “stop” label if the distance is less than 15 meters and a “move” label otherwise.
The enriched stream is stored as a series of static graph snapshots organized in a time‑tree within a Neo4j database deployed in the cloud. The cloud layer integrates Neo4j with Apache Spark GraphX to execute complex graph queries such as shortest‑path, vertex degree, and PageRank centrality over temporal graphs. Query results are emitted as time‑series of graph snapshots, enabling online analytics of large temporal networks while preserving speed and scalability.
The prototype was evaluated using real transit feeds from the CODIAC transit network in the Greater Moncton area (642 bus stops, 30 routes). Experiments focused on a single day (June 8 2016) during peak hours. Shortest‑path queries highlighted congested stops (displayed as red nodes) and free‑flow movements (green nodes). Degree and PageRank analyses identified high‑traffic stations (e.g., Plaza, Champlain Street, Main Street) and illustrated where buses passed stops without passenger activity.
Key contributions include: (i) a clear separation of lightweight edge processing (data cleaning and contextualization) from heavyweight cloud processing (graph analytics), reducing bandwidth consumption and cloud overload; (ii) a practical implementation of an end‑to‑end data‑flow pipeline using ParStream, EFF, Neo4j, and Spark GraphX; (iii) demonstrable insights into transit dynamics through visual graph analytics.
The authors acknowledge that the current implementation supports only a unidirectional flow (edge → cloud). Future work will extend the framework to support bidirectional flows, deploy the EFF platform across all layers, and design coherent mobility‑analytics workflows that address scalability, speed, and complexity challenges inherent in massive IoMT data streams. The research is funded by the NSERC/Cisco Industrial Research Chair in Real‑time Mobility Analytics, with data supplied by CODIAC Transit and compute resources provided by Compute Canada.
Comments & Academic Discussion
Loading comments...
Leave a Comment