Three-Dimensional Photoacoustic Tomography using Delay Multiply and Sum Beamforming Algorithm
Photoacoustic imaging (PAI), is a promising medical imaging technique that provides the high contrast of the optical imaging and the resolution of ultrasound (US) imaging. Among all the methods, Three-dimensional (3D) PAI provides a high resolution a…
Authors: Roya Paridar, Moein Mozaffarzadeh, Ali Mahloojifar
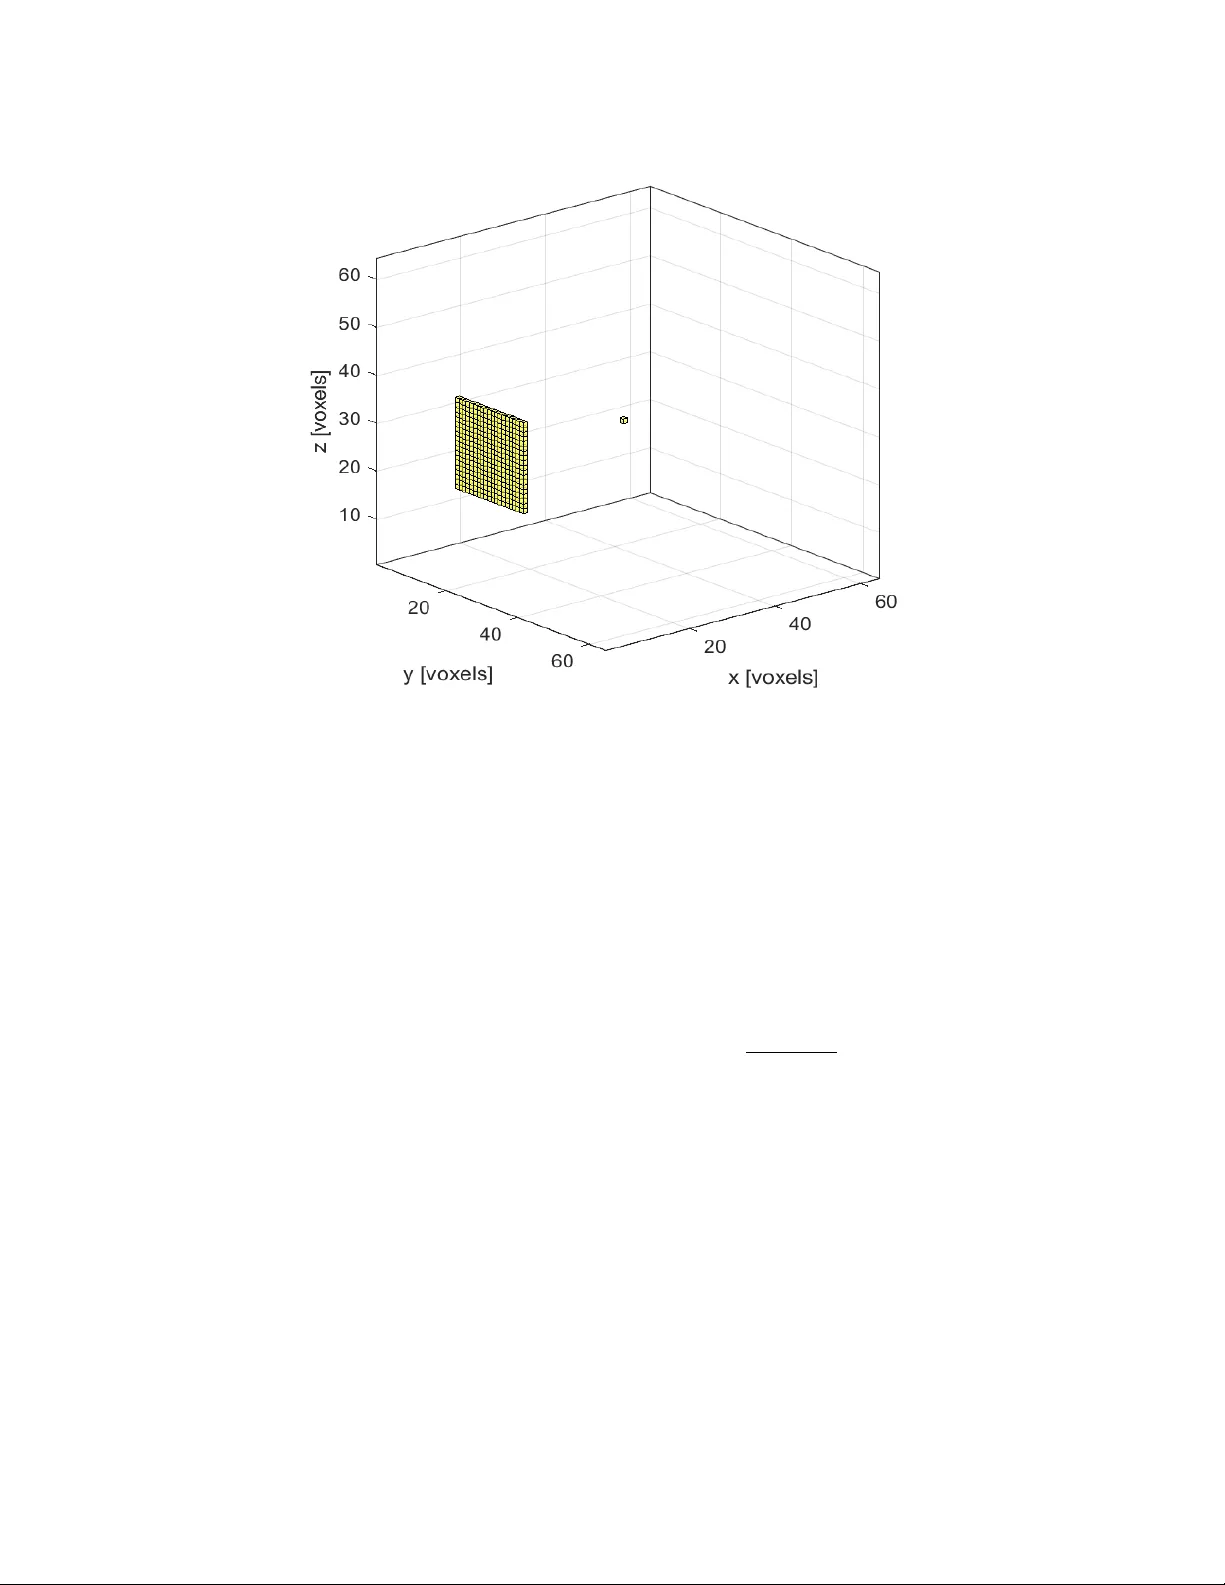
Three-Dimensional Photoacoustic T omograph y using Dela y Multiply and Sum Beamforming Algorithm Ro ya P aridar 1 , Mo ein Mozaffarzadeh 1 , Ali Mahlo o jifar 1 , Mohammadreza Nasiria v anaki 2 , and Mahdi Oro o ji *,1 1 Departmen t of Biomedical Engineering, T arbiat Mo dares Universit y , T ehran, Iran 2 Departmen t of Biomedical Engineering, W a yne State Universit y , Detroit, Michigan, USA ABSTRA CT Photoacoustic imaging (P AI), is a promising medical imaging technique that provides the high contrast of the optical imaging and the resolution of ultrasound (US) imaging. Among all the metho ds, Three-dimensional (3D) P AI pro vides a high resolution and accuracy . One of the most common algorithms for 3D P A image reconstruction is delay-and-sum (D AS). Ho wev er, the quality of the reconstructed image obtained from this algorithm is not satisfying, ha ving high lev el of sidelob es and a wide mainlob e. In this pap er, dela y-m ultiply-and- sum (DMAS) algorithm is suggested to o vercome these limitations in 3D P AI. It is sho wn that DMAS algorithm is an appropriate reconstruction tec hnique for 3D P AI and the reconstructed images using this algorithm are impro ved in the terms of the width of mainlob e and sidelob es, compared to DAS. Also, the quan titative results sho w that DMAS impro ves signal-to-noise ratio ( S N R ) and full-width-half-maxim um ( F W H M ) for about 25 dB and 0.2 mm , resp ectiv ely , compared to DAS. Keyw ords: Photoacoustic imaging, 3D imaging, photoacoustic tomography , b eamforming 1. INTR ODUCTION Photoacoustic Imaging (P AI), is a promising medical imaging mo dalit y that uses an electromagnetic excitation pulse, illuminating the imaging target, to generate photoacoustic (P A) signals. 1 , 2 It combines the physics of ultrasound (US) and the optical imaging and pro vides the optical con trast and ultrasonic resolution. 3 , 4 In addition, it do es not ha ve the sp ec kles that app ear in a pure US imaging system and is a non-ionizing and nonin v asive h ybrid imaging modality. 5 P A can be used in differen t applications, and its effects ha ve b een extensiv ely inv estigated in v arious cases of studies. 6 – 10 A numerical analysis for infan t brain imaging has b een conducted. 11 There are tw o imaging metho ds in P AI: P A tomography (P A T) and P A microscopy. 12 , 13 P A T is a three-dimensional (3D) fast-dev eloping medical imaging tec hnique that is suitable for in v iv o imaging. No wada ys, P A T is one of the largest research areas in biomedical applications and is still growing quickly. 13 , 14 As the optical absorption strongly dep ends on physiological conditions, such as haemoglobin concentration, P A T pro vides functional information. P A T has b een used in sev eral applications such as tumor detection, 15 imaging small animals, 16 blo od flow measurement, 17 functional and structural imaging 18 and skin lesions imaging. 19 In P A T, a different types of transducers such as linear, circular and arc, are lo cated around the medium in order to measure the acoustic propagated wa ves, caused by the laser illumination. Then, a reconstruction algorithm is necessary to form the optical absorption distribution map of the tissue. 20 Lo w-cost P AI systems using hav e b een designed for different purp oses. 21 – 23 F or the linear-arra y imaging, there is a high similarity b et ween the b eamforming algorithm used in P A and US image formation. 24 Dela y-and-sum (DAS) b eamformer is the most t ypical algorithm used in medical P A and US imaging, due to its simple implementation. Ho wev er, the quality of the image obtained by this algorithm is not satisfying, having high level of sidelob es and a low resolution. Dela y-multiply-and-sum (DMAS), introduced b y Matrone et al . , 25 w as prop osed to improv e the image quality compared to DAS. The sidelob es and the width of mainlob e would b e reduced using DMAS algorithm. Double stage DMAS (DS-DMAS ) has b een developed for linear-array imaging, providing a higher contrast compared to DMAS b eamformer. 26 – 28 In order to improv e the resolution of DMAS, it has b een com bined with Minim um F urther author information: (Send corresp ondence to M. Oro o ji) Mahdi Oro o ji: E-mail: moro o ji@modares.ac.ir V ariance (MV) b eamformer. 29 – 34 As a w eighting metho d for the P A image reconstruction, mo dified coherence factor (MCF) and high resolution CF (HRCF) hav e b een introduced, which result in a higher con trast and a b etter resolution compared to the conv entional CF, resp ectiv ely. 35 , 36 In this pap er, we prop ose to use DMAS b eamforming metho d for 3D P AI while its sup eriorit y for 2D imaging h as b een pro ved in the former publications. A 2D array of US transducers is used to p erform the 3D P AI. It has b een shown that DMAS can b e used for 3D application of P AI as w ell. The rest of the pap er is organized as follo ws. In section 2, a brief explanation ab out the P A effect and beamformers are presented. In section 3, the results of the numerical study are ev aluated. Finally , the conclusion is rep orted in section 4. 2. METHODS 2.1 Photoacoustics The P A wa ves are generated as follows: ∇ 2 − 1 c 2 0 ∂ 2 ∂ t 2 p ( ~ r , t ) = − β C p ∂ H ( ~ r , t ) ∂ t , (1) where p is the initial pressure at p osition r and time t , C p is the sp ecific heat capacity , β is the isobaric volume expansion, c 0 is the sp eed of sound, H represen ts the heating function whic h can b e in terpreted as the pro duct of the spatial absorption function A ( r ) and the temp oral illumination function I e ( t ) as b elow: H ( ~ r, t ) = A ( r ) I e ( t ) . (2) Assuming that the medium is acoustically homogeneous and I e ( t ) = δ ( t ), the measured initial pressure can b e expressed as: p ( ~ r 0 , t 0 ) = β C p Z d 3 ~ rA ( ~ r ) d dt 0 δ t 0 − | ~ r 0 − ~ r | c 0 4 π | ~ r 0 − ~ r | . (3) The key problem is ab out ho w to reconstruct A ( ~ r ) when p ( ~ r 0 , t 0 ) is av ailable. There is a relation b et ween the spherical Radon transform and the initial pressure: g ( ~ r 0 , ~ t ) = 4 π C p β t t Z 0 dt 0 p ( ~ r 0 , t 0 ) = Z d 3 ~ r A ( ~ r ) δ ( ¯ t − | ~ r 0 − ~ r | ) , (4) where ¯ t = c 0 t , and g ( ~ r 0 , ¯ t ) is the spherical Radon transform of A ( ~ r ). The P A image can b e reconstructed by in verting ( 4 ). There are several metho ds and algorithms for P A image reconstruction. One of these algorithms is back-pro jection (BP) algorithm. How ever, the quality of the reconstructed image by BP in 3D space is not suitable due to artifacts, sp ecially in the case that the num b er of the active elemen ts in the 2D arra y sensor is lo w. In linear-arra y P AI, BP w ould b e treated as a DAS algorithm. 2.2 D AS and DMAS Beamformers D AS is the most common metho ds in linear-arra y medical P A and US image reconstruction. In this algorithm, the delays to the signals received by the array elements are calculated prop ortional to their distances from the target. Then, the delay ed signals are summed up to construct the absorption distribution of the medium. The D AS b eamformed signal has the following equation: y DAS ( k ) = N X i =1 v i ( k − ∆ i ) , (5) where v i is the detected signal, ∆ i is the time delay for i th detector, y DAS ( k ) and k are the output signal and the time index, resp ectiv ely . As mentioned b efore, this is the most commonly used algorithm due to its simple implemen tation. Ho wev er the quality of the images obtained b y this algorithm is not satisfying. The image Figure 1: Simulation la yout. resolution and contrast obtained from ( 5 ) are limited due to the wide mainlob e and large sidelob es of the D AS b eamformed signals. In order to ov ercome these limitations, another b eamforming algorithm, named DMAS, is prop osed. This algorithm improv es the image quality significantly compared to DAS. The DMAS b eamformed signal is as follows: y DM AS ( t ) = N − 1 X i =1 N X j = i +1 s i ( t ) s j ( t ) , (6) where N is the n umber of receivers, s i and s j are the dela y ed signals received b y i th and j th detectors, respectively . As shown in ( 6 ), in this algorithm the delay ed receive s ignals are com binatorially coupled and multiplied b efore the summation. The amplitude of each multiplication is squared, and to address this problem, following formula is suggested: y DM AS ( t ) = N − 1 X i =1 N X j = i +1 sig n ( s i ( t ) s j ( t )) . q | s i ( t ) s j ( t ) | . (7) Using ( 7 ), the sidelob es and the width of mainlob e would be improv ed compared to ( 5 ). 3. RESUL TS The k-wa ve to olb o x is used to design the absorb er and the 2D array sensor in a 3D space. 37 An imaging region is simulated with dimensions of 6.4 mm ( depth ) × 6.4 mm ( w idth ) × 6.4 mm ( heig ht ). A spherical absorb er with 0.1 mm radius is lo cated as the initial pressure. The absorber is lo cated at the depth of 3.2 mm , and cen tered on the y − z plane. The sp eed of sound is assumed 1540 m/s . A 2D array of US transducers with 361 elements is lo cated at the center of y − z plane, which b oth its width and heigh t are 1.9 mm . The simulation lay out is depicted in Figure 1 . Note that the asymmetrically distribution of the array elements with resp ect to the p oin t target, results in a more noisy reconstructed image; the lateral resolution of the p oin t target will b e reduced if its the distance from the center of the arra y increases . 1 Therefore the arra y elements are distributed symmetrically x-y plane -2 0 2 Lateral distance [mm] -2 0 2 Axial distance [mm] x-z plane -2 0 2 Lateral distance [mm] -2 0 2 Axial distance [mm] y-z plane -2 0 2 Lateral distance [mm] -2 0 2 Axial distance [mm] (a) x-y plane -2 0 2 Lateral distance [mm] -2 0 2 Axial distance [mm] x-z plane -2 0 2 Lateral distance [mm] -2 0 2 Axial distance [mm] y-z plane -2 0 2 Lateral distance [mm] -2 0 2 Axial distance [mm] (b) Figure 2: The reconstructed 3D P A images of a single p oin t target using (a) D AS and (b) DMAS algorithm in x − y plane (z=3.2 mm ), x − z plane (y=3.2 mm ) and y − z plane (x=3.2 mm ). Noise is added to the received signals having a S N R of 50 dB . T able 1: F W H M at the depth of 3.2 mm Beamformer F W H M ( mm ) D AS 0.76 DMAS 0.55 with resp ect to the p oin t target in order to preven t the noise caused by the asymmetric distribution of the elemen ts. The cen tral frequency of the arra y is 7 M H Z with 77% bandwidth. Gaussian noise is added to the receiv ed signals to mak e the signals similar to the real condition, having a signal-to-noise Ratio ( S N R ) of 50 dB and 10 dB . The images are reconstructed using D AS and DMAS algorithms for b etter comparison. The results are sho wn in Figure 2 where w e face a S N R of 50 dB . Figure 2 (a) and Fig 2 (b) sho w the recon- structed images using DAS and DMAS b eamformer, resp ectiv ely . The first column shows a cross section of the reconstructed image in the x − y plane, and the second and third column also show the results in the x − z plane and y − z plane, resp ectiv ely , at the depth of 3.2 mm . Note that since the x − y and x − z plane are b oth p erp endicular to y − z plane (where the arra y sensor is lo cated, named detection plane), the reconstructed images in these tw o planes are the same. It can b e seen that the reconstructed image using DMAS has a higher qualit y compared to DAS, as exp ected. Also, a b etter noise suppression is achiev ed. T o hav e a b etter ev aluation, lateral v ariations are presented in Figure 3 . Lateral v ariations at the depth of 3.2 mm in the detection plane and x − y plane (p erpendicular to the detection plane) are shown in Figure 3 (a) and Figure 3 (b), resp ectiv ely . The lateral v ariations in x − z plane are not depicted since it is similar to the lateral v ariations in x − y plane. It is ob vious that DMAS b eamformer results in a narrow er width of mainlob e and low er level of sidelob es compared to DAS, which indicates the improv ement in the terms of resolution and contrast. Consequen tly , DMAS results in an image with a higher qualit y compared to D AS. S N R and the spatial resolution are tw o important metrics to ev aluate and compare the p erformance of the b eamformers. The full-width-half-maximum ( F W H M ) in -6 dB can b e used to estimate the spatial resolution. The F W H M and S N R for the single p oin t target at the -3 -2 -1 0 1 2 3 Lateral distance [mm] y-z plane -80 -60 -40 -20 0 Power [dB] Depth= 3.2 mm DAS DMAS (a) -3 -2 -1 0 1 2 3 Lateral distance [mm] x-y plane -80 -60 -40 -20 0 Power [dB] Depth= 3.2 mm DAS DMAS (b) Figure 3: Lateral v ariations of the reconstructed image of a single p oin t target using D AS and DMAS at the depth of 3.2 mm in (a) y − z plane, named detection plane, and (b) x − y plane which is p erpendicular to the detection plane. T able 2: S N R at the depth of 3.2 mm Beamformer S N R ( dB ) y − z plane x − y plane D AS 38.90 42.00 DMAS 64.14 66.63 depth of 3.2 mm (sho wn in Figure 2 ) are calculated and presented in T able 1 and T able 2 , resp ectively . T able 1 sho ws that DMAS provides a narrow er width of mainlob e in -6 dB compared to D AS. Note that the calculated F W H M are similar in all three planes. S N R s are calculated as follo ws: S N R = 20 log 10 P sig nal /P noise , (8) where P sig nal is the difference b etw een the maximum and minim um in tensity of the reconstructed image, and P noise is the standard deviation of the reconstructed image. 27 T able 2 sho ws that DMAS b eamformer results in a higher S N R compared to DAS. Therefore, DMAS outp erforms DAS in the terms of noise reduction. It should b e noted that the calculated S N R are similar in x − y plane and x − z plane. 4. CONCLUSION 3D P AI is used to mak e the diagnosis procedure faster and more accurate. In this pap er, D AS and DMAS b eamforming methods w ere applied on a 3D imaging space, where the P A signals were acquired by a 2D array of the US transducers. The quality of the reconstructed image obtained by D AS was not satisfying due to its high lev el of sidelob es and wide mainlob e. It was suggested to use DMAS algorithm in order to improv e the image qualit y compared to DAS. Numerical sim ulation with a single p oin t target was p erformed. The reconstructed images were ev aluated qualitativ ely and quantitativ ely . The qualitativ e results sho wed that DMAS algorithm pro vides an image with a b etter qualit y and b etter noise reduction compared to D AS. Also, quantitativ e results sho wed that, compared to DAS, S N R and F W H M were improv ed for ab out 25 dB and 0.2 mm , resp ectiv ely . REFERENCES [1 ] W ang, B., Xiang, L., Jiang, M. S., Y ang, J., Zhang, Q., Carney , P . R., and Jiang, H., “Photoacoustic tomograph y system for nonin v asiv e real-time three-dimensional imaging of epilepsy ,” Biome dic al optics expr ess 3 (6), 1427–1432 (2012). [2 ] Nasiria v anaki, M., Xia, J., W an, H., Bauer, A. Q., Culv er, J. P ., and W ang, L. V., “High-resolution photoacoustic tomography of resting-state functional connectivity in the mouse brain,” Pr o c e e dings of the National A c ademy of Scienc es 111 (1), 21–26 (2014). [3 ] Mehrmohammadi, M., Jo on Y o on, S., Y eager, D., and Y Emeliano v, S., “Photoacoustic imaging for cancer detection and staging,” Curr ent mole cular imaging 2 (1), 89–105 (2013). [4 ] Mahmoo dk alay eh, S., Jooy a, H. Z., Hariri, A., Zhou, Y., Xu, Q., Ansari, M. A., and Av anaki, M. R. N., “Lo w temp erature-mediated enhancement of photoacoustic imaging depth,” arXiv pr eprint (2018). [5 ] Beard, P ., “Biomedical photoacoustic imaging,” Interfac e fo cus , rsfs20110028 (2011). [6 ] Khodaee, A. and Nasiria v anaki, M., “Study of data analysis methods in functional connectivity photoa- coustic tomograph y (fcpat),” in [ Photons Plus Ultr asound: Imaging and Sensing 2017 ], 10064 , 1006438, In ternational So ciet y for Optics and Photonics (2017). [7 ] Mohammadi, L., Behnam, H., and Nasiria v anaki, M., “Mo deling skull’s acoustic attenuation and disp er- sion on photoacoustic signal,” in [ Photons Plus Ultr asound: Imaging and Sensing 2017 ], 10064 , 100643U, In ternational So ciet y for Optics and Photonics (2017). [8 ] Xu, Q., V olinski, B., Hariri, A., F atima, A., and Nasiria v anaki, M., “Effect of small and large animal skull b one on photoacoustic signal,” in [ Photons Plus Ultr asound: Imaging and Sensing 2017 ], 10064 , 100643S, In ternational So ciet y for Optics and Photonics (2017). [9 ] V olinski, B., Hariri, A., F atima, A., Xu, Q., and Nasiria v anaki, M., “Photoacoustic in vestigation of a neona- tal skull phan tom,” in [ Photons Plus Ultr asound: Imaging and Sensing 2017 ], 10064 , 100643T, International So ciet y for Optics and Photonics (2017). [10 ] Hariri, A., F atima, A., and Nasiriav anaki, M., “A cost-effectiv e functional connectivit y photoacoustic to- mograph y (fcpat) of the mouse brain,” in [ Photons Plus Ultr asound: Imaging and Sensing 2017 ], 10064 , 1006439, International Society for Optics and Photonics (2017). [11 ] Meimani, N., Abani, N., Gelov ani, J., and Av anaki, M. R., “A numerical analysis of a semi-dry coupling configuration in photoacoustic computed tomography for infant brain imaging,” Photo ac oustics 7 , 27–35 (2017). [12 ] W ang, L. V., “Multiscale photoacoustic microscopy and computed tomography ,” Natur e photonics 3 (9), 503–509 (2009). [13 ] Nasiria v anaki, M., Xia, J., W an, H., Bauer, A. Q., Culv er, J. P ., and W ang, L. V., “Resting-state functional connectivit y imaging of the mouse brain using photoacoustic tomography ,” in [ SPIE BiOS ], 89432O–89432O, In ternational So ciet y for Optics and Photonics (2014). [14 ] Nasiria v anaki, M. et al., “Resting-state functional connectivity measuremen t in the mouse brain using a low cost photoacoustic computed tomography ,” in [ F r ontiers in Optics ], JW4A–62, Optical So ciet y of America (2016). [15 ] Mallidi, S., Luk e, G. P ., and Emelianov, S., “Photoacoustic imaging in cancer detection, diagnosis, and treatmen t guidance,” T r ends in biote chnolo gy 29 (5), 213–221 (2011). [16 ] Xia, J. and W ang, L. V., “Small-animal whole-b o dy photoacoustic tomography: a review,” IEEE T r ansac- tions on Biome dic al Engine ering 61 (5), 1380–1389 (2014). [17 ] W ang, L., Xia, J., Y ao, J., Maslo v, K. I., and W ang, L. V., “Ultrasonically enco ded photoacoustic flo wgraphy in biological tissue,” Physic al r eview letters 111 (20), 204301 (2013). [18 ] Y ao, J. and W ang, L. V., “Sensitivity of photoacoustic microscop y ,” Photo ac oustics 2 (2), 87–101 (2014). [19 ] Vionnet, L., Gˆ ateau, J., Sch w arz, M., Buehler, A., Ermolay ev, V., and Ntziac hristos, V., “24-mhz scanner for optoacoustic imaging of skin and burn,” IEEE tr ansactions on me dic al imaging 33 (2), 535–545 (2014). [20 ] Xu, M., Xu, Y., and W ang, L. V., “Time-domain reconstruction algorithms and numerical simulations for thermoacoustic tomography in v arious geometries,” IEEE T r ansactions on biome dic al engine ering 50 (9), 1086–1099 (2003). [21 ] Hariri, A., F atima, A., Mohammadian, N., Mahmo odk alay eh, S., Ansari, M. A., Bely , N., and Av anaki, M. R., “Developmen t of lo w-cost photoacoustic imaging systems using very low-energy pulsed laser dio des,” Journal of biome dic al optics 22 (7), 075001 (2017). [22 ] Hariri, A., Hosseinzadeh, M., No ei, S., and Nasiriav anaki, M., “Photoacoustic signal enhancement: tow ards utilization of very low-cost laser diodes in photoacoustic imaging,” in [ Photons Plus Ultr asound: Imaging and Sensing 2017 ], 10064 , 100645L, International So ciet y for Optics and Photonics (2017). [23 ] Hariri, A., F atima, A., Mohammadian, N., Bely , N., and Nasiriav anaki, M., “T ow ards lo w cost photoa- coustic microscop y system for ev aluation of skin health,” in [ Imaging Sp e ctr ometry XXI ], 9976 , 99760X, In ternational So ciet y for Optics and Photonics (2016). [24 ] Omidi, P ., Diop, M., Carson, J., and Nasiria v anaki, M., “Impro vemen t of resolution in full-view linear- arra y photoacoustic computed tomography using a no vel adaptiv e weigh ting metho d,” in [ Photons Plus Ultr asound: Imaging and Sensing 2017 ], 10064 , 100643H, International So ciet y for Optics and Photonics (2017). [25 ] Matrone, G., Sa voia, A. S., Caliano, G., and Magenes, G., “The dela y multiply and sum b eamforming algorithm in ultrasound b-mo de medical imaging,” IEEE tr ansactions on me dic al imaging 34 (4), 940–949 (2015). [26 ] Mozaffarzadeh, M., Mahlo o jifar, A., and Oro o ji, M., “Image enhancement and noise reduction using mo di- fied dela y-multiply-and-sum b eamformer: Application to medical photoacoustic imaging,” in [ Ir anian Con- fer enc e on Ele ctric al Engine ering (ICEE) 2017 ], 65–69, IEEE (2017). [27 ] Mozaffarzadeh, M., Mahloo jifar, A., Oro o ji, M., Adabi, S., and Nasiriav anaki, M., “Double-stage dela y mul- tiply and sum b eamforming algorithm: Application to linear-array photoacoustic imaging,” IEEE T r ansac- tions on Biome dic al Engine ering 65 (1), 31–42 (2018). [28 ] Mozaffarzadeh, M., Sadeghi, M., Mahlo o jifar, A., and Oro o ji, M., “Double-stage delay multiply and sum b eamforming algorithm applied to ultrasound medical imaging,” Ultr asound in Me dicine and Biolo gy 44 (3), 677 – 686 (2018). [29 ] Mozaffarzadeh, M., Mahlo o jifar, A., and Oro o ji, M., “Medical photoacoustic b eamforming using minimum v ariance-based delay multiply and sum,” in [ Digital Optic al T e chnolo gies 2017 ], 10335 , 1033522, Interna- tional So ciet y for Optics and Photonics (2017). [30 ] P aridar, R., Mozaffarzadeh, M., Nasiria v anaki, M., and Oro o ji, M., “Double minim um v ariance b eamform- ing metho d to enhance photoacoustic imaging,” arXiv pr eprint arXiv:1802.03720 (2018). [31 ] Mozaffarzadeh, M., Av anji, S. A. O. I., Mahlo o jifar, A., and Oro o ji, M., “Photoacoustic imaging using com bination of eigenspace-based minim um v ariance and delay-m ultiply-and-sum b eamformers: Sim ulation study ,” arXiv pr eprint arXiv:1709.06523 (2017). [32 ] Mozaffarzadeh, M., Mahloo jifar, A., Oro o ji, M., Kratkiewicz, K., Adabi, S., and Nasiriav anaki, M., “Linear- arra y photoacoustic imaging using minimum v ariance-based dela y multiply and sum adaptiv e b eamforming algorithm,” Journal of Biome dic al Optics 23 (2), 026002 (2018). [33 ] P aridar, R., Mozaffarzadeh, M., Mehrmohammadi, M., and Oro o ji, M., “Photoacoustic image formation based on sparse regularization of minimum v ariance b eamformer,” arXiv pr eprint arXiv:1802.03724 (2018). [34 ] Mozaffarzadeh, M., Mahlo o jifar, A., Nasiriav anaki, M., and Oro o ji, M., “Eigenspace-based minimum v ari- ance adaptive b eamformer combined with dela y multiply and sum: Exp erimen tal study ,” arXiv pr eprint arXiv:1710.01767 (2017). [35 ] Mozaffarzadeh, M., Y an, Y., Mehrmohammadi, M., and Makkiabadi, B., “Enhanced linear-array photoa- coustic b eamforming using modified coherence factor,” Journal of Biome dic al Optics 23 (2), 026005 (2018). [36 ] Mozaffarzadeh, M., Mehrmohammadi, M., and Makkiabadi, B., “Image Impro vemen t in Linear-Arra y Photoacoustic Imaging using High Resolution Coherence F actor W eighting T echnique,” arXiv pr eprint arXiv:1710.02751 (Oct. 2017). [37 ] T reeby , B. E. and Co x, B. T., “k-wa ve: Matlab to olbox for the simulation and reconstruction of photoa- coustic wa ve fields,” Journal of biome dic al optics 15 (2), 021314–021314 (2010).
Original Paper
Loading high-quality paper...
Comments & Academic Discussion
Loading comments...
Leave a Comment