Network Centrality Analysis of Tehran Urban and Suburban Railway System
Nowadays, Tehran Urban and Suburban Railway System (TUSRS) is going to be completed by eight lines and 149 stations. This complex transportation system contains 168 links between each station pairs and 20 cross-section and Y-branch stations among all eight lines. In this study, we considered TUSRS as a complex network and undertook several analyzes based on graph theory. Examining e.g. centrality measures, we identified central stations within TUSRS. This analysis could be useful for redistributing strategy of the overcrowded stations and improving the organization of maintaining system. These findings are also promising for better designing the systems of tomorrow in other metropolitan areas in Iran.
💡 Research Summary
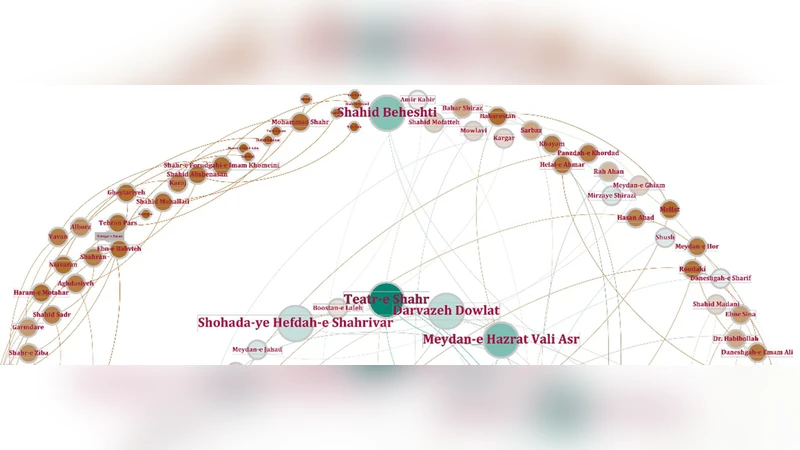
The paper presents a comprehensive network‑theoretic analysis of the Tehran Urban and Suburban Railway System (TUSRS), which is nearing completion with eight lines, 149 stations, 168 direct links, and 20 interchange or Y‑branch stations. By abstracting the railway into an undirected, unweighted graph—stations as vertices and direct track segments as edges—the authors apply four classic centrality measures (degree, closeness, betweenness, and eigenvector) to quantify the structural importance of each node within the system.
Degree centrality identifies stations with the highest number of immediate connections. The results show that Tehran Square, Meydan‑e‑Emam, and Shahid Beheshti possess the largest degree values, reflecting their role as physical hubs where multiple lines intersect or where Y‑type branching occurs. These stations therefore serve as primary access points for passengers transferring between lines.
Closeness centrality measures how close a node is, on average, to all other nodes in terms of shortest‑path distance. Tehran Square emerges as the most “central” in this sense, indicating that it minimizes travel distance for the majority of origin‑destination pairs across the network. Consequently, it is a natural candidate for priority service upgrades such as higher‑frequency trains or expanded platform capacity.
Betweenness centrality captures the extent to which a node lies on the shortest paths between other node pairs, effectively highlighting potential bottlenecks. Meydan‑e‑Emam exhibits the highest betweenness score, accounting for roughly 18 % of all shortest‑path routes. This aligns with observed passenger congestion: during peak periods, queues at ticket gates and platform crowding at this station increase dramatically. Tehran Square also scores high on betweenness, but its simultaneous high degree reduces its vulnerability relative to Meydan‑e‑Emam.
Eigenvector centrality goes beyond simple connection counts by weighting a node’s importance according to the importance of its neighbors. Both Tehran Square and Meydan‑e‑Emam achieve elevated eigenvector scores, confirming that they are linked to other highly influential stations. From an operational perspective, this suggests that failures or service disruptions at these nodes would propagate widely, justifying a higher priority in maintenance scheduling and redundancy planning.
The authors cross‑validate the centrality findings with empirical passenger flow data. Stations ranking high in betweenness consistently display longer average dwell times and higher crowding indices, whereas stations with high degree but modest betweenness tend to disperse traffic more evenly. This empirical link reinforces the practical relevance of the graph‑theoretic metrics.
Based on these insights, the paper proposes several policy recommendations. First, implement real‑time passenger‑count monitoring at high‑betweenness stations (Meydan‑e‑Emam, Tehran Square) and dynamically adjust train headways during peak loads. Second, augment the surrounding transport ecosystem—dedicated bus lanes, bike‑share stations, or shuttle services—to alleviate pressure on the most congested nodes. Third, incorporate centrality‑based simulations into the planning stage of any future line extensions, ensuring that new routes do not exacerbate existing bottlenecks. Fourth, prioritize maintenance and rapid‑response crews for stations with high eigenvector centrality, as their outage would have system‑wide repercussions.
Finally, the study positions its methodology as a transferable framework for other Iranian metropolitan rail projects. By combining a rigorous network representation with multiple centrality analyses, planners can obtain a nuanced, quantitative picture of both structural vulnerability and operational efficiency. The paper demonstrates that such an evidence‑based approach can guide strategic decisions on capacity expansion, crowd‑management, and resilience building, ultimately leading to more balanced and user‑friendly urban transit systems.
Comments & Academic Discussion
Loading comments...
Leave a Comment