Single Stage Prediction with Embedded Topic Modeling of Online Reviews for Mobile App Management
Mobile apps are one of the building blocks of the mobile digital economy. A differentiating feature of mobile apps to traditional enterprise software is online reviews, which are available on app marketplaces and represent a valuable source of consum…
Authors: Shawn Mankad, Shengli Hu, An
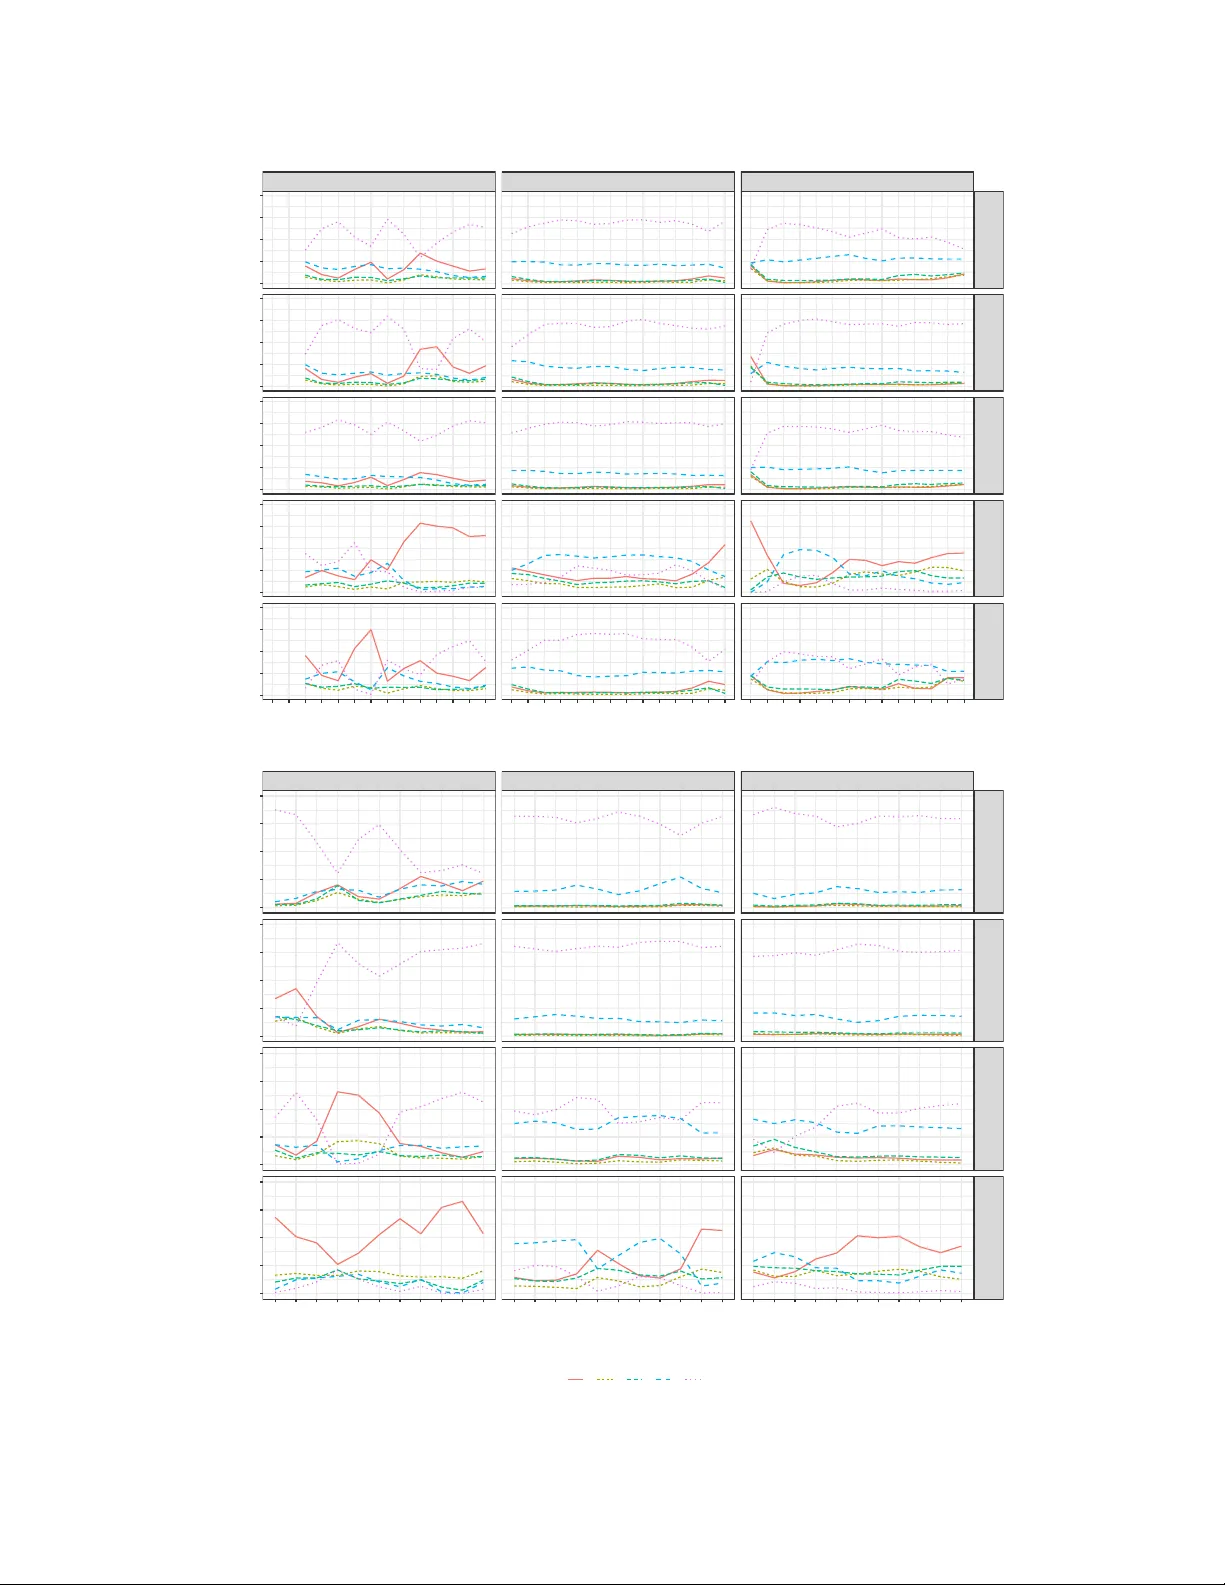
Submitte d to the Annals of Applie d Statistics arXiv: SINGLE ST A GE PREDICTION WITH EMBEDDED TOPIC MODELING OF ONLINE REVIEWS F OR MOBILE APP MANA GEMENT By Sha wn Mankad ∗ , Shengli Hu ∗ , and Anandasiv am Gop al † Cornel l University ∗ and University of Maryland † Mobile apps are one of the building blocks of the mobile digi- tal economy . A differentiating feature of mobile apps to traditional en terprise softw are is online reviews, whic h are av ailable on app mar- k etplaces and represen t a v aluable source of consumer feedback on the app. W e create a sup ervised topic mo deling approach for app devel- op ers to use mobile reviews as useful sources of quality and customer feedbac k, thereb y complemen ting traditional softw are testing. The approac h is based on a constrained matrix factorization that lev er- ages the relationship b etw een term frequency and a giv en resp onse v ariable in addition to co-o ccurrences b etw een terms to recov er top- ics that are b oth predictive of consumer sentimen t and useful for understanding the underlying textual themes. The factorization is com bined with ordinal regression to pro vide guidance from online re- views on a single app’s performance as well as systematically compare differen t apps o ver time for benchmarking of features and consumer sen timent. W e apply our approac h using a dataset of ov er 100,000 mo- bile reviews o ver several years for three of the most p opular online tra vel agent apps from the iT unes and Go ogle Play marketplaces. 1. In tro duction. Mobile commerce is exp ected to reach $250 billion by 2020 ( MobileBusi- nessInsigh ts , 2016 ), and through the increasing prev alence of smartphones, has already started to significan tly influence all forms of economic activity . Increasingly , the mobile ecosystem is gaining significan t attention from enterprises that are p orting many of their standardized enterprise-based soft w are functionalities to mobile platforms ( Serrano, Hernantes and Gallardo , 2013 ). The rise of tablets and smartphones, combined with the corresponding drop in PC-based traffic on the Internet ( ABIresearc h , 2012 ), suggests that most enterprises will need to consider “mobile” as an imp ortan t part of their service p ortfolio. A cen tral part of this mo ve to the mobile ecosystem is, of course, the mobile app . Mobile apps are softw are pro ducts that are typically embedded in the native operating system of the mobile device, link to v arious wireless telecommunication proto cols for communication, and offer sp ecific forms of services to the consumer ( W asserman , 2010 ; Krishnan et al. , 2000 ). One critical issue faced b y all softw are dev elopmen t teams is that of softw are quality ( Pressman , 2005 ), leading to the quality of experience for the user ( Kan, Basili and Shapiro , 1994 ). The issue of quality of exp erience, based on the underlying functionality pro vided by the mobile app, is of particular imp ortance in the mobile context ( Ickin et al. , 2012 ), esp ecially as service industries increase their presence in this sphere. Poor qualit y of exp erience on the mobile app can damage the underlying brand ( An thes , 2011 ), alienate rewards customers and increase defections to comp etitors for more casual users, thus reducing reven ues. These issues are also faced in enterprise soft ware dev elopmen t con texts, where qualit y and the customer exp erience are particularly critical. T o meet these re- quiremen ts, mature soft ware firms sp end considerable time and effort in surveying customers and AMS 2000 subje ct classific ations: Primary 62P25; secondary 62H99 Keywor ds and phr ases: mobile apps, online reviews, text analysis, topic mo deling, matrix factorization 1 2 MANKAD, HU, AND GOP AL dev eloping theoretical mo dels of softw are quality and customer requirements b efore-hand ( Para- suraman, Zeithaml and Berry , 1988 ; Pressman , 2005 ). In con trast to these organizational efforts to manage quality and customer requiremen ts, how ev er, the mobile dev elop er has access to a significan t quan tit y of feedback on the quality of exp erience from the app through the channel of online r eviews . Online reviews pro vide the developmen t team with readily and easily accessible feedbac k on the quality of experience from using the app, while also influencing other p otential customers’ do wnload decisions. Moreo ver, useful information in suc h reviews are often found in the text, rather than simply the o verall rating for the app. Th us, an arguably easy approach to understanding user-p erceived qualit y and satisfaction with a mobile app ma y b e to simply manually read the related online reviews and incorp orate this understanding into the app dev elopmen t pro cess. How ever, this approac h poses several c hallenges. First, online reviews are characterized by high volume and diversit y of opinions, making it harder to parse out the truly imp ortan t feedbac k from non-diagnostic information ( Go des and Mayzlin , 2004 ). Second, they are driv en b y significan t individual biases and idiosyncrasies, thereb y making it risky to base quality impro v ement initiativ es on single reviews or reviewers ( Li and Hitt , 2008 ; Chen and Lurie , 2013 ; Chen et al. , 2014 ). Finally , reading and absorbing all reviews asso ciated with an app is infeasible simply due to volume, given the num b er of apps that are av ailable on the marketplace, the num b er of reviews that are generated p er app, and the rate at which new reviews are added, which is at an increasing rate ( Lim et al. , 2015 ). Researc hers at the in tersection of softw are engineering and unstructured data analysis hav e de- v elop ed metho dologies to help the app dev elopment teams tap into this useful source of collectiv e information to extract sp ecific insights that may guide future developmen t w ork on the app (s ee Ba v ota ( 2016 ) for a comprehensive surv ey). F or example, Chen et al. ( 2014 ) dev eloped a decision supp ort to ol to automatically filter and rank informativ e reviews that lev erages topic mo deling tec h- niques, sentimen t, and classification algorithms. Iacob and Harrison ( 2013 ); Panic hella et al. ( 2015 ) and Maalej and Nabil ( 2015 ) use a combination of linguistic pattern matc hing rules, topic mo deling, and classification algorithms to classify reviews into different categories, lik e feature requests and problem discov ery , that dev elop ers can use to filter for informativ e reviews. Galvis Carre ˜ no and Win bladh ( 2013 ) applied topic mo deling to app store reviews to capture the underlying consumer sen timen t at a giv en momen t in time. Similarly , F u et al. ( 2013 ) p erform regularized regression with word frequencies as cov ariates to identify terms with strong sentimen t that guide subsequent topic mo deling of app reviews. The authors aggregate their findings ov er time to gain insigh t in to a single app as well as all apps in the market. This w ork extends this literature to help understand the ev olution of consumer sentimen t ov er time while b enchmarking apps against their comp etitors by systematically incorp orating time effects and the comp etitive landscap e into a supervised topic mo deling framework that estimates the impact of certain discussion themes on the customer exp erience. Our data contains online reviews from the iT unes and Go ogle Play marketplaces for three firms at the heart of the tra vel ecosystem in the United States, namely Exp edia, Kay ak, and T ripAdvisor. All three of these firms provide apps that are free, and are aimed at frequent tra velers, with functionalit y for search, managing reserv ations, accessing promotions, logging into tra vel accounts, reviewing tra vel activities, and so on. Figure 1 shows that the time-series of a verage star ratings for each of the apps evolv es ov er time as new versions are released. As an illustrativ e example, imp ortant issues for Exp edia’s managerial and developmen t teams heading into 2013 (if not so oner) w ould b e to understand why ratings hav e trended do wn w ards on the iT unes platform and how consumer discussion compares to comp eting firms, so that appropriate remedial action can b e tak en to impro ve their p ositioning in the mobile mark etplace. SINGLE ST AGE PREDICTION WITH MOBILE APP ONLINE REVIEWS 3 ● ● ● ● ● ● ● ● ● ● ● ● ● ● ● ● ● ● ● ● ● ● ● ● ● ● ● ● ● ● ● ● ● ● ● ● ● ● ● ● ● ● ● ● ● ● ● ● ● ● ● ● ● ● ● ● ● ● ● ● ● ● ● ● ● ● ● ● ● ● ● ● ● ● ● ● ● ● ● Expedia Kay ak T r ipAdvisor iT unes Google Play 2011 2012 2013 2014 2011 2012 2013 2014 2011 2012 2013 2014 1 2 3 4 5 1 2 3 4 5 A ver age Rating Fig 1: Average app rating o ver eac h y ear-quarter, b y mobile app and platform. The main idea b ehind our approac h is that features can b e derived from the text not only b y considering the co-o ccurrences b etw een terms in reviews, but also with the observed asso ciation b et ween term usage and star ratings – the resp onse v ariable of interest. Th us, by using a constrained matrix factorization embedded within an ordinal regression mo del, w e lev erage the relationship b et ween terms and the resp onse v ariable to recov er topics that are predictive of the outcome of in terest in addition to b eing useful for understanding the underlying textual themes. The mo del is flexible enough to analyze m ultiple apps around common topics with evolving regression coefficients as new app v ersions are released to the public. These are imp ortan t and no vel extensions with resp ect to the topic mo deling literature, since they allows managers and developmen t teams to go b ey ond a static summary of the review corpus asso ciated with an app to systematically compare differen t apps ov er time for b enchmarking of features and consumer sentimen t. By pinp ointing the causes of user dissatisfaction, a manager or developmen t team can steer future developmen t effort appropriately while ensuring a match b etw een the user exp erience and the appropriate developmen t effort by the developmen t team. Exp edia, Kay ak, and T ripAdvisor were three of the most review ed trav el apps at the time of collecting the data, which is comprised of 104,816 English reviews across a total of 162 different v ersions of these apps representing the full history of these apps from their introduction to the iT unes and Go ogle Play marketplaces until Nov ember 2014. Even in this sp ecific context, where w e limit our attention to a particular industry and trio of apps, we see that there are ov er a 1,000 reviews p er app p er y ear, with even more reviews to b e considered if the dev elop er were interested in examining the reviews of comp etitor apps as well, th us underscoring the need for a statistical and semi-automated approach. The next section presents in detail the proposed mo dels and estimation framew ork follo wed b y a review of comp eting metho ds in Section 3 . Through a detailed simulation study under differen t generativ e mo dels (Section 4 ) as w ell as with the iT unes and Go ogle Pla y data (Section 5 ), we sho w that the prop osed mo del p erforms fav orably when compared to comp eting metho ds for out of sample predictions and topic interpretabilit y . W e also use the results of the mo del to c haracterize and contrast the apps o ver time. The paper concludes with a short discussion on the ov erall findings, the limitations of our work, and directions for future research in Section 6 . 4 MANKAD, HU, AND GOP AL 2. Single Stage Predictions with Matrix F actorization. Prior work in the domain of text analytics and online reviews ( Cao, Duan and Gan , 2011 ; Galvis Carre ˜ no and Win bladh , 2013 ; Tirunillai and T ellis , 2014 ; Abrahams et al. , 2015 ; Mank ad et al. , 2016 ) has follow ed a tw o-stage approac h, where one first deriv es text features through topic mo deling and subsequently applies linear regression or another statistical model for prediction and inference. In principle there are man y wa ys to perform this tw o-stage procedure, both in terms of generating text features and prop erly com bining them within a statistical model. W e address this issue b y integrating b oth steps together using a matrix factorization framework. The problem w e fo cus on is prediction and explanation of a resp onse v ariable when given a set of documents. F ormally , let X ∈ R n × p + b e a do cumen t term matrix with n do cuments on the rows and p terms on the columns. Let Y ∈ R n × 1 b e a resp onse vector. Though in our application, Y = { 1 , 2 , 3 , 4 , 5 } n will b e comp osed of online review scores for apps on iT unes and Go ogle Play , whic h are b etter mo deled with an ordered multinomial distribution, w e b egin b y solving in a no vel w a y the case when the resp onse v ariable is normally distributed and extend in Section 2.2 to the ordinal regression setting. The ob jectiv e function for the prop osed factorization is min Λ ,β || Y − X Λ β || 2 2 (1) sub ject to (Λ) ij ≥ 0 for all i, j. The p × m non-negativ e matrix Λ are the term-topic loadings, the m -v ector β are regression co ef- ficien ts that reveal the effect of each topic on the resp onse Y . T o enhance interpretabilit y of the mo del, we require that topic loadings satisfy non-negativity constrain ts, whic h has b een prop osed for matrix factorization with text and other forms of data in previous works, most notably with extensions of the Nonnegativ e Matrix F actorization and Probabilistic Laten t Semantic Analysis mo dels ( Lee and Seung , 1999 , 2001 ; Ding, Li and Peng , 2008 ; Ding, Li and Jordan , 2010 ). The underlying in tuition for why non-negativity is helpful with text is given in Xu, Liu and Gong ( 2003 ). Do cuments and terms are group ed together b y their underlying topics and are also represen ted in the document-term matrix as data p oints in the p ositiv e orthant. As a result, non-negativit y constrain ts result in a factorization that is able to b etter matc h the geometry of the data by estimating correlated v ectors that iden tify eac h group of do cumen ts and terms. W e build up on this literature and imp ose non-negativit y to b etter capture the natural geometry of the data. T o understand the topic comp osition for a given do cument, one can insp ect the corresp onding row of X Λ, where larger v alues indicate greater topic imp ortance to the do cumen t. Since the regression co efficien ts β can take p ositiv e and negativ e v alues, the optimization problem most resembles the Semi-Nonnegative Matrix F actorizations in Ding, Li and Jordan ( 2010 ), which w as prop osed for clustering and visualization problems, and Mank ad and Michailidis ( 2013 , 2015 ), who adapt the factorization for net w ork analysis. The exact form and context of our mo del is, to our kno wledge, no vel, and manages to a void the well-kno wn issue of ov erfitting, whic h plagues other matrix factorization approac hes in text analysis. Sp ecifically , with classical tec hniques like Latent Seman tic Analysis (see Section 3 for detailed review; Deerwester et al. ( 1990 )) or Probabilistic Laten t Semantic Analysis ( Hofmann , 1999 ), one extracts topics by estimating a low-rank matrix factorization of the form X ≈ U D V T sub ject to, resp ectiv ely , the orthonormalit y constraints of Singular V alue Decomp osition or probability constraints. In b oth cases, the num b er of parameters gro ws linearly with the n um b er of do cuments in the corpus. With the proposed factorization the n um b er of parameters to estimate do es not depend on corpus size, and gro ws with the size of the v o cabulary and n umber of topics. W e note that the factorization as posed ab ov e is not fully iden tifiable, as the columns of Λ are sub ject to p erm utations. The arbitrary ordering of topics is a feature present in all topic mo deling SINGLE ST AGE PREDICTION WITH MOBILE APP ONLINE REVIEWS 5 tec hniques other than Latent Semantic Analysis. Moreov er, note that Λ D and D − 1 β , where D is a p ositiv e diagonal m × m matrix, is another solution with the same ob jectiv e v alue. W e explored additional constraints on Λ and/or β to fix the scaling, but found that these approac hes add complexit y to the estimation without noticeably improving the quality of the final solution. Thus, w e omit further discussion of these approaches here. W e also note that since the prop osed metho d do es not estimate a formal probabilit y mo del for the topic structure, the do cument-term matrix X can b e prepro cessed with term-frequency inv erse do cumen t frequency (TFIDF) w eigh ting ( Salton and Michael , 1983 ) ( X ) ij = TF ij log( n IDF j ) , where TF ij denotes the term frequency (w ord count) of term j in do cument i , IDF j is the num ber of do cuments con taining term j , and n is the total num b er of do cuments in the corpus. This normalization has its theoretical basis in information theory and has b een sho wn to represent the data in a wa y that b etter discriminates groups of documents and terms compared to simple w ord coun ts ( Rob ertson , 2004 ). Finally , the prop osed factorization can b e used to generate predictions for an y new do cument b y represen ting the do cumen t with the p -vector ˜ x so that the prediction is ˆ y = ˜ x ˆ Λ ˆ β . 2.1. Estimation. The estimation approac h w e present alternates betw een optimizing with re- sp ect to Λ and β . The algorithm solves for Λ using a pro jected gradien t descent metho d that has b een effective at balancing cost p er iteration and conv e rgence rate for similar problems p osed in Nonnegativ e Matrix F actorization ( Lin , 2007 ). Starting with β , when holding Λ fixed, it is easy to verify that the remaining optimization problem is the usual regression problem leading to ˆ β = (Λ T X T X Λ) − 1 Λ T X T Y . Driv en by our up coming extension to the real data and results therein, w e do not to regularize β , though it can b e adv an tageous and easily done in other data contexts. T urning our attention to Λ, a standard gradient descen t algorithm would start with an initial guess Λ (0) and constants γ i and iterate: 1. F or i = 1 , 2 , . . . 2. Set Λ ( i +1) = Λ ( i ) − γ i ∆ Λ , where the gradient of the ob jective function with resp ect to Λ is (2) ∆ Λ = X T X Λ β β T − X T Y β T . Note that X T X and X T Y can b e precomputed for faster computing time. Due to the subtraction, the non-negativit y of Λ cannot b e guaran teed. Th us, the basic idea of pro jected gradient descen t is to pro ject elements in Λ to the feasible region using the pro jection function, which for our problem is defined as P ( γ ) = max (0 , γ ). The basic algorithm is then 1. F or i = 0 , 1 , 2 , . . . 2. Set Λ ( i +1) = P (Λ ( i ) − γ i ∆ Λ ). T o guarantee a sufficien t decrease at each iteration and con vergence to a stationary point, the “Armijo rule” developed in Bertsek as ( 1976 , 1999 ) pro vides a sufficient condition for a giv en γ i at eac h iteration (3) || Y − X Λ ( i +1) β || − || Y − X Λ ( i ) β || ≤ σ h ∆ Λ ( i ) , Λ ( i +1) − Λ ( i ) i , 6 MANKAD, HU, AND GOP AL where σ ∈ (0 , 1) and h· , ·i is the sum of element wise products of t w o matrices. Th us, for a giv en γ i , one calculates Λ ( i +1) and c hec ks whether ( 3 ) is satisfied. If the condition is satisfied, then the step size γ i is appropriate to guarantee conv ergence to a stationary p oint. The final algorithm is given in pseudo co de in Algorithm 1 . See the supplementary material ( Mank ad, Hu and Gopal , 2018 ) and App endix A for further discussion. 2.2. Extensions for Online R eviews Data: A Continuation R atio Mo del with Emb e dde d T opic Mo deling. In our data and generally with online review scores, Y = { 1 , 2 , 3 , 4 , 5 } n , which are not w ell mo deled with a normal distribution. T o b etter fit our data, we embed the factorization within a type of ordinal regression, the contin uation ratio mo del ( Fienberg , 2007 , Ch.6), that incorp orates time dynamics and multiple corp ora (apps). W e use the contin uation ratio mo del instead of the more p opular prop ortional o dds mo del ( Mc- Cullagh , 1980 ) for primarily computational reasons, since the regression coefficients can b e solved with standard logistic regression with the con tin uation ratio mo del. In practice, several researchers ha v e observ ed that both forms of ordinal regression yield very similar results ( Armstrong and Sloan , 1989 ; Arc her and Williams , 2012 ; Harrell , 2015 ). The basic idea is start with the following logit function logit( Y = k ) = α k + X β , which we adapt to logit( Y = k ) = α k + X Λ β , where logit( Y = k ) = log P ( Y = k | Y ≥ k ,X ) P ( Y >k | Y ≥ k ,X ) . The corresp onding lik eliho o d is then the pro duct of conditionally indep enden t binomial terms for each level of Y . The log lik eliho o d is given b y l (Λ , β | Y , X ) = n X i =1 K − 1 X k =1 ( Y k ) i log( p ( k )) + (1 − k X j =1 ( Y j ) i ) log (1 − p ( k )) = n X i =1 K − 1 X k =1 ( Y k ) i α k + ( X ) i Λ β − log(1 + e α k +( X ) i Λ β ) − n X i =1 K − 1 X k =1 (1 − k X j =1 ( Y j ) i ) log (1 + e α k +( X ) i Λ β ) , where p ( k ) = P ( Y i = k | Y i ≥ k , ( X ) i , α k , β ) = e α k +( X ) i Λ β 1+ e α k +( X ) i Λ β , ( X ) i refers to the i th row of X , and Y k are binary resp onse vectors for categories k = 1 , . . . , K created from Y ( Y k ) j = ( 1 if ( Y ) j = k 0 otherwise for j = 1 , . . . , n do cuments. An imp ortant realization from the lik eliho o d function is that it can b e partitioned so that es- timating the regression co efficien ts, holding Λ fixed, can b e done through standard binary logistic regression techniques. T o our knowledge Co x ( 1988 ) and Armstrong and Sloan ( 1989 ) were the first to sho w this for the standard contin uation ratio mo del. The basic idea to apply logistic regression is to stac k the reco ded the response v ariables (( Y k ) j ), including only observ ations that satisfy the condition Y ≥ k for k = 1 , . . . , K , and duplicate corresp onding rows to form the design matrix with dumm y v ariables added to model the intercepts α k . In our con text, the same tric k can be applied when holding Λ fixed. SINGLE ST AGE PREDICTION WITH MOBILE APP ONLINE REVIEWS 7 Recall our goal is to b enchmark multiple apps ov er time, which calls for a dynamic mo del logit( Y ta = k ) = α tak + X ta Λ β ta , where a indexes the set of apps and t denotes time. Note that the num ber of do cuments changes with eac h app and time interv al, but that the v o cabulary is kept constan t across them so that X ta is n ta × p , Y tak are n ta × 1 response vectors, and β ta are m × 1 regression coefficients for each time interv al, app category . Such a mo del is appropriate as long as the fo cal app or set of apps main tain the same core functionality , since then we could reasonably exp ect the discussion topics captured in Λ to remain in v ariant. By visualizing β ta o v er time, as sho wn in Section 5 , w e can b egin to understand the trend of consumer sentimen t around topics in Λ for different apps as well the effectiv eness of developmen t teams at resp onding to customer feedback. Another k ey assumption is that the regression coefficients β ta are indep enden t of k , the rating lev el sp ecified for eac h review. Arguably , this assumption is not germane to our online reviews data, since the occurrence and discussion of topics can hav e sentimen t to them, and thus are related to the o v erall rating of the review. W e also consider a saturated version of the model, where the regression co efficien ts v ary with the level of the resp onse v ariable logit( Y ta = k ) = α tak + X Λ β tak . Likelihoo d ratio tests as well as out of sample prediction accuracy rates sho w that the constrained mo del is preferred, that is, assuming that β tak = β ta for all k leads to b etter statistical and predictiv e mo dels (see App endix B for more information). Estimation of the dynamic mo del follows a v ery similar alternating pro jected gradient descent algorithm as for the base factorization. When solving for Λ, holding α tak and β ta fixed, w e again utilize the pro jected gradient descent algorithm with appropriate up dates for the gradien t of Λ and the Armijo rule ( Bertsek as , 1976 , 1999 ) to guaran tee con vergence to a stationary p oint. Some further details are giv en in App endix C . When holding Λ fixed, one can estimate α tak and β ta for each app-time by rep eatedly utilizing the logistic regression solution from the static case for eac h app-time com bination. T o encourage smo othness in the regression coefficients, we utilize a rolling window so that α tak and β ta are estimated using data from time p oints t and t − 1. Another approac h yielding similar results w ould be to add a formal smo othness p enalty to the log lik eliho o d. A rigorous implementation of suc h an approach is outside the scop e of this pap er, but an in teresting area of future work. Finally , when giv en a new do cumen t x ta , one can predict the rating by selecting the resp onse category with largest probability P ( Y ta = 1) = p (1) (4) P ( Y ta = k ) = p ( k ) k − 1 Y j =1 (1 − p ( j )) , k = 2 , . . . , K − 1 (5) P ( Y ta = K ) = 1 − K − 1 X k =1 P ( Y ta = k ) , (6) where p ( k ) = P ( Y ta = k | Y ≥ k , x ta , Λ , α tak , β ta ) = e α tak + x ta Λ β ta 1+ e α tak + x ta Λ β ta . 3. Relation with T opic Mo deling Metho ds. As sho wn in T able 1 , the historical roots of the proposed mo del go bac k to Laten t Semantic Analysis (LSA), the most classical technique for topic mo deling, which is based on the Singular V alue Decomp osition (SVD) of the do cument-term matrix X ≈ U D V T ( Deerw ester et al. , 1990 ). In man y information retriev al tasks X is pro jected on to the w ord-topic factors X V T for a low rank representation of the data. W e of course are building 8 MANKAD, HU, AND GOP AL on this idea with X Λ. With LSA, since V can take elements of an y sign, the interpretation of the resultan t factors can b e challenging in practice, whic h led to the dev elopmen t of the Probabilistic Laten t Seman tic Analysis. Probabilistic Latent Semantic Analysis (pLSA) dev elop ed in Hofmann ( 1999 ) is a formal prob- abilit y mo del o ver the joint distribution of w ords and do cuments. The idea is that each w ord in a do cument is a sample dra wn from a mixture of multinomial distributions that correspond to differen t topics. pLSA can b e written in the same algebraic form of SVD but imp oses probabilit y constrain ts, whic h greatly impro ved the interpretation of the resultan t factors. In fact, Ding, Li and P eng ( 2008 ) sho w an equiv alency betw een the pLSA mo del and the Non-Negativ e Matrix F actor- ization (NMF) of the do cument-term matrix when one imp oses sum to one constraints in addition to the non-negativity for the NMF. While pLSA is widely seen as an improv emen t ov er LSA, there are tw o ma jor dra wbacks. First, the n um b er of parameters to b e estimated gro ws linearly with the size of the corpus, which can lead to ov erfitting. Second, there is no systematic w ay to assign probabilities to new do cuments after training the mo del. As discussed previously , b oth of these concerns are addressed in our mo del. SINGLE ST AGE PREDICTION WITH MOBILE APP ONLINE REVIEWS 9 Metho d Decomp osition T yp e Purp ose Sup ervised Incorp orates Time Multiple Corp ora Laten t Semantic Analysis ( Deerw ester et al. , 1990 ) Orthonormal T opic Mo deling No No No Probablistic Latent Semantic Analysis ( Hofmann , 1999 ) Probabilistic T opic Mo deling No No No Laten t Dirichlet Allo cation ( Blei, Ng and Jordan , 2003 ) Probabilistic T opic Mo deling No No No Dynamic Latent Dirichlet Allo cation ( Blei and Lafferty , 2006 ) Probabilistic T opic Mo deling No Y es No Sup ervised Latent Dirichlet Allo cation ( Mcauliffe and Blei , 2008 ) Probabilistic T opic Mo deling & Prediction Y es No No Laten t Asp ect Rating Analysis ( W ang, Lu and Zhai , 2010 ) Probabilistic T opic Mo deling & Prediction Y es No No Multinomial Inv erse Regression ( T addy , 2013 ) Logistic Regression Sen timent Analysis Y es No Y es Single Stage Matrix F actorization (Prop osed Approach) Non-negativ e T opic Mo deling & Prediction Y es Y es Y es T able 1 Summary and evolution of topic mo deling metho ds. 10 MANKAD, HU, AND GOP AL The latent Dirichlet allo cation (LDA) of Blei, Ng and Jordan ( 2003 ) addresses these t w o issues with a hierarc hical Bay es ian generative mo del for ho w documents are constructed. LD A has been sho wn to work very well in practice for data exploration and unsup ervised learning, and hence has b een used extensiv ely in text mining applications ( Blei , 2012 ). As men tioned previously , within the soft w are qualit y and mobile app reviews literature, sev eral pap ers (e.g., F u et al. ( 2013 ); Ba vota ( 2016 )) use LDA as part of a multi-stage analysis that feeds in to regression mo dels and/or visual- izations. W e use the follo wing LDA generating pro cess in the next section to simulate do cuments in order to study how the proposed and comp eting metho ds p erform in a con trolled setting under v arious generating pro cesses and signal-to-noise environmen ts. The idea is that do cuments are constructed in a multi-stage pro cedure. 1. Define K topics, which are probability distributions ov er words and denoted as γ 1: K . 2. Randomly draw a distribution o ver topics for the entire corpus θ | α ∼ D ir ichl et ( α ). 3. F or eac h word in a do cument: (a) Randomly sample a topic according to the distribution of topics created in Step 1, i.e., z n ∼ M ul tinomial ( θ ). (b) Randomly sample a word according to the topic, i.e., w n | z n ∼ γ . This generative pro cess defines a joint probabilit y distribution, where the goal is to infer the con- ditional distribution of the topic structure giv en the observ ed do cuments and word counts p ( γ 1: K , θ 1: D , z 1: D | w 1: D ) . This task creates a key statistical challenge that has b een addressed with to ols lik e Gibbs sampling ( P orteous et al. , 2008 ) or v ariational algorithms ( Blei and Jordan , 2006 ). There ha v e b een several related extensions to LD A. F or example, Titov and McDonald ( 2008b ) dev elop the Multi-grain T opic Mo del for modeling online reviews, which improv es the coherence and interpretabilit y of the topic-keyw ords by enforcing a hierarchical topic structure. The dynamic topic mo del ( Blei and Lafferty , 2006 ) is another related extension that allows the topic loadings to c hange o ver time. These mo dels do not consider do cument annotations or prediction, as in this w ork. The sup ervised latent Diric hlet allo cation (sLDA) of Mcauliffe and Blei ( 2008 ) do es consider do cumen t lab els by adding a final stage to the LD A generative pro cess, where a resp onse v ariable is drawn on each do cument from the do cumen t’s topic prop ortions. 4. F or each do cumen t, draw a resp onse v ariable Y | z 1: N , η , σ 2 ∼ N ( η T ¯ z , σ 2 ), where the prev alence of topics determine the outcome v ariable. sLD A has b een utilized for recommender systems in the con texts of scien tific articles ( W ang and Blei , 2011 ) and physical pro ducts ( W u and Ester , 2015 ), and extended to allo w for additional co- v ariates for the regression step ( Agarw al and Chen , 2010 ). W e note that because these extensions are motiv ated by recommender systems, the fo cus is usually on adding latent v ariables that cap- ture each user’s affinity to differen t asp ects of a pro duct as he or she reviews items ( McAuley and Lesk ov ec , 2013 ). Thus, conceptually the emphasis is on iden tifying preferences to products (or their attributes) at the user-level. Our w ork is motiv ated b y a different problem that results in conceptual and mo deling differences. Sp ecifically , we are primarily in terested in b enchmarking from the pro d- uct developer or designer’s p oint of view, which requires understanding preferences at an aggregate (not user) lev el ov er time. Thus, one inno v ation w e incorp orate is to characterize the time ev olution of how discussion on a common set of topic impacts the a verage customer’s exp erience for multiple SINGLE ST AGE PREDICTION WITH MOBILE APP ONLINE REVIEWS 11 apps. This is an imp ortan t extension, since this ultimately allo ws managers to go beyond a static summary of their app’s p erformance to understand ho w the customer exp erience is evolving with differen t apps and v ersions. Additionally , b ecause metho d do es not estimate a formal probabilit y distribution for the topic structure, w e can represent each do cument using the term-frequency in- v erse do cument frequency ( Robertson , 2004 ), which has b een shown to be adv an tageous for v arious learning tasks. Our mo del also do es not require tuning an y parameters, whereas sLDA requires careful sp ecification of hyperparameters. Numerous empirical studies show that the p erformance of LD A-based metho ds with online app reviews is sensitive to hyperparameter sp ecification ( Lu, Mei and Zhai , 2011 ; Panic hella et al. , 2013 ; Thomas et al. , 2013 ; Ba vota , 2016 ). Another closely related literature stream is aspect modeling, where the main goal is to decomp ose a review in to multidimensional asp ects (topics) with ratings on eac h asp ect ( Titov and McDonald , 2008a ). Conceptually and at a high level, our work can b e view ed as b eing representativ e of this stream, since in our mo del the Λ and β parameters enco de, resp ectively , the “asp ects” and their sen timen t. The main difference b etw een our w ork and the aspect mo deling literature lies in the observ able data structure and precise mo deling goals. Most asp ect mo deling research assumes that ratings on each asp ect are observ able and ha v e the goal of lab eling each sen tence within a review with an asp ect and sentimen t. Common mo deling approac hes are to extend LDA ( Bro dy and Elhadad , 2010 ; Titov and McDonald , 2008a ; Lu et al. , 2011 ; Jo and Oh , 2011 ) or pursue other similar laten t v ariable mo dels ( Snyder and Barzila y , 2007 ; Bro dy and Elhadad , 2010 ; McAuley , Lesk o v ec and Jurafsky , 2012 ). F or example, in our setting, the referenced asp ect mo dels would b e appropriate if a reviewer pro vided separate numerical ratings for several dimensions, like functionalit y , user in terface, reliability of the app, and so on. How ever, this is rarely the case with app reviews, unlike reviews for restaurants on Y elp where such underlying asp ects ma y b e av ailable. T o our kno wledge there is one work in asp ect mo deling that assumes an iden tical observ able data structure. The Laten t Asp ect Rating Analysis mo del (LARA; W ang, Lu and Zhai ( 2010 )) aims to infer laten t asp ects and their sen timen t scores from a review’s text and its o v erall review rating. The pap er follows a t wo-stage pro cedure, first using a seeded and iterativ e algorithm to iden tify asp ects within each review, follow ed by a latent rating regression mo del. While LARA can b e extended or mo dified to predict ov erall ratings, as in this w ork, the direct use-cases are distinct, namely annotation of sentences and inference of latent asp ect ratings. Finally w e discuss the m ultinomial in v erse regression of T addy ( 2013 ), which uses a logistic regression to extract sentimen t information from do cumen t annotations and phrase counts that are mo deled as dra ws from a multinomial distribution. The nuanced differences in context leads to differen t mo deling decisions. Since sentimen t analysis is the main ob jective in T addy ( 2013 ), where reco v ering dictionaries is critical, the multinomial inv erse regression analysis is done at the phrase or term level. Our approac h performs topic modeling (grouping of the terms) at the same time as regression. 4. Sim ulation Study . W e test the accuracy of the prop osed mo del relative to comp eting metho ds under differen t settings. The first simulation establishes self-consistency of the proposed factorization, that is, resp onses are generated from the mo del implied b y the factorization. The second sim ulation generates responses using the sup ervised laten t Diric hlet allo cation mo del of Mcauliffe and Blei ( 2008 ). F or a fair comparison, we consider the canonical setting underlying ( 1 ) with a normally distributed resp onse and without consideration of time or multiple apps. The metho ds we compare are as follo ws: 1. Laten t seman tic analysis of the document-term matrix with TFIDF weigh tings (denoted as LSA). Once the do cument term matrix has b een decomp osed with SVD, X train ≈ U D V T , the 12 MANKAD, HU, AND GOP AL singular v ectors in V are used as indep endent v ariables in a regression mo del Y = X test V β + ; 2. Probabilistic latent s eman tic analysis (denoted as pLSA). Similarly , w e estimate Y = X test V β + , where V are the probabilistic word-topic loadings estimated from X train ; 3. Laten t Dirichlet Allo cation (LD A). Similarly , w e estimate Y = X test V β + , where V are the probabilistic word-topic loadings estimated from X train . The Dirichlet parameters are chosen through five-fold cross v alidation; 4. Sup ervised LD A (denoted as sLD A). The Diric hlet parameters for the Do cument/T opic and T opic/T erm distributions are c hosen through five-fold cross v alidation and σ 2 is set to b e the training sample v ariance; 5. ` 1 p enalized linear regression (Lasso; Tibshirani ( 1996 ); F riedman, Hastie and Tibshirani ( 2010 )) of the response v ariable on the document term matrix. T en-fold cross-v alidation on the training data is used to select the tuning parameter; 6. The prop osed factorization of the do cument-term matrix (denoted as SSMF for Single-Stage Matrix F actorization). All analyses are performed using R ( R Core T eam , 2014 ), with the “tm” ( F einerer, Hornik and Mey er , 2008 ) and “topicmo dels” ( Gr ¨ un and Hornik , 2011 ) libraries. F or sLD A, w e use the collapsed Gibbs sampler implemented in the “lda” pac k age ( Chang , 2012 ). Code for the prop osed Single-Stage Matrix F actorization is provided in the supplementary material ( Mank ad, Hu and Gopal , 2018 ). 4.1. Self Consistency. Data are generated to study ho w the prop osed mo del performs under its implied generating pro cess, where Y | X , Λ , β , σ 2 ∼ Normal( X Λ β , 1). X is the do cumen t term matrix, (Λ) ij ∼ Uniform[0 , 1], and ( β ) j ∼ Normal(0 , 1). Do cuments are sim ulated using the Latent Diric hlet Pro cess ( Blei, Ng and Jordan , 2003 ) with b oth Dirichlet parameters for Do cument/T opic and T opic/T erm distributions set equal to 0.8. The size of the vocabulary is set to p = 2000 to roughly match our real dataset and others in the online review space ( B ¨ usc hk en and Allen by , 2016 ; Han et al. , 2016 ). W e v ary the n umber of do cuments n = { 100 , 1000 , 10000 } and the n um b er of terms in eac h do cumen t µ = { 15 , 250 , 2000 } to study how eac h mo del p erforms in different en vironments. The estimated num b er of topics is alwa ys equal to the true v alue and v aried from 2 to 20. After training eac h mo del, we assess the accuracy of the predictions on the test set using the ro ot mean squared error, which are shown in the top panel of T able 2 . When the sample size is 1000 or low er, Lasso and the prop osed mo del p erform b est. Lasso’s p erformance is perhaps exp ected giv en that the generative model can be reparameterized as a linear regression X Λ β = X γ , where γ p × 1 = Λ β is a vector of co efficien ts. It is notable that the prop osed mo del p erforms well when the num b er of words in each document is small. This is imp ortan t esp ecially in the mobile apps con text since the ov erwhelming ma jority of app reviews are written on mobile devices, leading to shorter and less formal writing styles ( Burtc h and Hong , 2014 ). In our real app reviews data, the a v erage do cumen t length is under 20 w ords. When the n um b er of documents is large, we see that all metho ds p erform equally well, meaning that the adv antages of sup ervision diminish in larger datasets. 4.2. Sup ervise d L atent Dirichlet Al lo c ation. Data are generated under the generating process assumed by sLDA ( Mcauliffe and Blei , 2008 ), where Y | Z , β , σ 2 ∼ Normal( β T Z, σ 2 ). Z is the Do c- umen t/T opic probabilit y distribution. All other settings are iden tical to the previous simulation study . T able 2 sho ws that sLD A and Lasso p erform best with a n = 100 and µ = 15, with the prop osed metho d coming in third. In other settings ev ery method tends to p erform similarly . The robust p erformance of SSMF in b oth simulations with do cumen ts of v arying length indicates that the prop osed factorization should b e useful for our app review data as well as with other corp ora. SINGLE ST AGE PREDICTION WITH MOBILE APP ONLINE REVIEWS 13 Self-Consistency µ n LSA pLSA LD A sLDA Lasso SSMF 15 100 1 . 090 1 . 087 1 . 088 1 . 044 1 . 038 1 . 040 (0 . 004) (0 . 004) (0 . 004) (0 . 003) (0 . 003) (0 . 006) 15 1000 1 . 039 1 . 038 1 . 038 1 . 037 1 . 032 1 . 033 (0 . 001) (0 . 001) (0 . 001) (0 . 001) (0 . 001) (0 . 004) 15 10000 1 . 032 1 . 032 1 . 032 1 . 036 1 . 025 1 . 032 (0 . 001) (0 . 001) (0 . 001) (0 . 001) (0 . 001) (0 . 001) 250 100 1 . 056 1 . 058 1 . 057 1 . 323 1 . 018 1 . 009 (0 . 003) (0 . 003) (0 . 003) (0 . 012) (0 . 003) (0 . 003) 250 1000 1 . 007 1 . 007 1 . 007 1 . 013 1 . 003 1 . 003 (0 . 001) (0 . 001) (0 . 001) (0 . 001) (0 . 001) (0 . 001) 250 10000 1 . 002 1 . 002 1 . 002 1 . 004 1 . 002 1 . 002 (0 . 001) (0 . 001) (0 . 001) (0 . 001) (0 . 001) (0 . 001) 2000 100 1 . 050 1 . 049 1 . 049 1 . 710 1 . 011 0 . 999 (0 . 003) (0 . 003) (0 . 003) (0 . 028) (0 . 003) (0 . 003) 2000 1000 1 . 004 1 . 004 1 . 004 1 . 027 1 . 001 1 . 001 (0 . 001) (0 . 001) (0 . 001) (0 . 002) (0 . 001) (0 . 001) 2000 10000 0 . 998 0 . 998 0 . 998 1 . 002 0 . 999 0 . 998 (0 . 002) (0 . 002) (0 . 002) (0 . 002) (0 . 002) (0 . 002) sLD A Generating Process µ n LSA pLSA LD A sLDA Lasso SSMF 15 100 1 . 110 1 . 109 1 . 112 1 . 077 1 . 073 1 . 106 (0 . 005) (0 . 005) (0 . 005) (0 . 005) (0 . 004) (0 . 013) 15 1000 1 . 057 1 . 057 1 . 057 1 . 056 1 . 052 1 . 053 (0 . 002) (0 . 002) (0 . 002) (0 . 002) (0 . 002) (0 . 008) 15 10000 1 . 051 1 . 051 1 . 051 1 . 053 1 . 051 1 . 052 (0 . 002) (0 . 002) (0 . 002) (0 . 002) (0 . 002) (0 . 002) 250 100 1 . 102 1 . 102 1 . 102 1 . 293 1 . 077 1 . 077 (0 . 005) (0 . 005) (0 . 005) (0 . 012) (0 . 005) (0 . 006) 250 1000 1 . 068 1 . 068 1 . 068 1 . 070 1 . 069 1 . 068 (0 . 004) (0 . 004) (0 . 004) (0 . 004) (0 . 004) (0 . 004) 250 10000 1 . 054 1 . 053 1 . 054 1 . 059 1 . 053 1 . 050 (0 . 002) (0 . 002) (0 . 002) (0 . 002) (0 . 002) (0 . 002) 2000 100 1 . 100 1 . 100 1 . 099 1 . 730 1 . 206 1 . 060 (0 . 005) (0 . 005) (0 . 005) (0 . 035) (0 . 025) (0 . 005) 2000 1000 1 . 072 1 . 072 1 . 072 1 . 087 1 . 095 1 . 070 (0 . 004) (0 . 004) (0 . 004) (0 . 004) (0 . 011) (0 . 004) 2000 10000 1 . 001 1 . 001 1 . 001 1 . 002 0 . 999 1 . 000 (0 . 002) (0 . 002) (0 . 002) (0 . 002) (0 . 002) (0 . 002) T able 2 R oot Me an Squar ed Err or aver aged over al l r anks fr om the simulation study with standar d err ors in p ar entheses. 14 MANKAD, HU, AND GOP AL Platform-App Num b er Reviews Av erage Review Length (c haracters) % Reviews with “!” Y ule’s K iT unes-Expedia 2772 98.715 28.968 62.325 iT unes-Ka yak 13120 68.948 31.623 59.289 iT unes-T ripAdvisor 19519 107.949 32.235 71.308 Go ogle Play-Expedia 6999 95.246 15.416 69.915 Go ogle Play-Ka yak 21059 58.023 15.267 49.637 Go ogle Play-T ripAdvisor 41347 65.660 14.069 53.895 T able 3 Summary statistics for the online r eviews data. Y ule’s K is a me asur e of v o cabulary richness, wher e higher numb ers indic ate a mor e diverse voc abulary ( Holmes , 1985 ). 5. iT unes and Go ogle Play App Reviews. W e now demonstrate the metho d’s real-life viabilit y and applicabilit y b y using the mobile apps marketplace data from the apps pro vided b y Exp edia, Kay ak, and T ripAdvisor that we describ ed earlier. W e begin b y discussing the prepro- cessing and mo del selection steps, follow ed by a detailed discussion of the findings. T o ensure accurate w ord coun ts when forming the document term matrix, w e follo w the standard prepro cessing steps ( Boyd-Graber et al. , 2014 ) of transforming all text into lo wercase and remo ving punctuation, stopw ords (e.g., “a”, “and”, “the”), and an y terms comp osed of less than three char- acters. In addition to counting the frequency of single w ords, we also coun t bigrams, whic h are all t w o w ord phrases that appear in the corpus. F or example, the sen tence “this is a wonderful app” is tokenized into single w ords “this”, “is”, “a”, “wonderful”, “app” as well as tw o-word phrases “this is”, “is a”, “a wonderful”, and “wonderful app”. After counting all unigrams and bigrams, w e remo v e terms that ha v e o ccurred in less than 20 reviews and apply TFIDF w eighting. The resulting total vocabulary size is 2583 for reviews from iT unes and 1389 for reviews from Go ogle Play . T able 3 sho ws an ov erview of the review data, where we se e that despite b eing a younger platform, Go ogle Pla y has more reviews for every app. The customer writing st yle also seems to v ary b y platform. iT unes reviews tend to be longer, p otentially more emotional due to greater n umber of exclamation p oints, and hav e a higher lexical div ersity . W e analyze each platform separately due to these differences in addition to the fact that the hardware (mobile phones and tablets) that run the mobile apps v ary across platforms, as do the underlying developmen t enviromen ts that used to dev elop co de for the apps. W e also define time in terms of year-quarters in our analysis to a v oid sparsit y issues early in an app’s lifecycle and also to roughly match the approximate rate at which upgrades and new functionalities are released for the apps in our sample. The last observed quarter for each platform is withheld as the test set. Cross-v alidation applied to the training sample selects five topics for iT unes and four topics for the Google Play platform according to misclassification error rate (MER). T able 4 sho ws the top ten keyw ords from our final mo dels using. Each of the topics were manually lab eled with headings after insp ecting the keyw ords and reviews that loaded most heavily onto each topic. F or instance, T able 5 sho ws reviews that correspond to the largest v alues in columns (topics) of X Λ for the Go ogle Pla y data. Due to space constraints, the top reviews for all topics and the iT unes data are omitted. SINGLE ST AGE PREDICTION WITH MOBILE APP ONLINE REVIEWS 15 iT unes T opic 1 Keywords T opic 2 Keywords Usabilit y (Online Reviews) F unctionalit y (Reserv ations) useful, helpful, go o d, co ol, a wsome, nice, great app, a v ailabilit y , great, wish app indisp ensable, reviewers, advisor alwa ys, since last, app also, establishment, helpfull, properties, helping, reviews pictures T opic 3 Keywords T opic 4 Keywords Ov erall Quality V ersioning great, aw esome, lov e, easy , app, b est, use, amazing, great app, p erfect, easy use fill, forced, changing, w orthless, latest version, returned, happ ened, old version, back old, bring bac k T opic 5 Keywords F unctionalit y (Soft ware Bugs) emails, crashes, almost every , dont wan t, one star, cate- gory , glitc h, apply , in ternet connection, customer service Go oglePla y T opic 1 Keywords T opic 2 Keywords F unctionalit y (Reserv ations) Usabilit y (UI & Design) brillian t, commen t, paid, w asn t, seriously , scroll, coup on, hotel flight, apparently , main helpful, half, av erage, exp ensive, en ter, agent, av ailabil- it y , adv ertised, liked, order T opic 3 Keywords T opic 4 Keywords Usabilit y (Comp osing Reviews) Installation & V ersioning write reviews, find wa y , asking, p o or, line, app im, searc hed, app bo ok, either, downloading bloat ware, stupid, uninstalled, uninstall, useless, crap, remo ve, month, return, expensive, message T able 4 The top ten topic keywor ds fr om estimating five topics on iT unes and four topics on Go o gle Play. 16 MANKAD, HU, AND GOP AL Reviews that load most hea vily onto “Usabilit y (Comp osing Reviews)” “i downloaded app on my new phone to write reviews i was able to find what i wan ted to write reviews and entering the review w as easy i hav ent searc hed for lists yet” “just cant submit hav e to paste cant type in to input line for submit name” “on several o ccasions reviews that i hav e submitted hav e either failed to submit successfully and give an error message or hav e mysteriously disapp eared after apparen tly b eing submitted successfully another v arian t problem is that draught that are sav ed can also disapp ear it is extremely frustrating to sp end perhaps minutes writing a review on a mobile device only to find that the time has b een wasted in terms of displaying tripadvisor information on the mov e it is reasonable” “but in en tering a commen t i w ent up to add something and it wouldn t allow me to scroll bac k do wn to complete m y commen t so i had to either completely redo the review or just enter and hop e for the best since the livelihoo d of establishments depend up on these commen ts this should not happ en please fix it this happ ened on a galaxy tablet” Reviews that load most hea vily onto “Installation & V ersioning” “new mobile tablet app is frustrating unable to b o ok hotel reserv ation with more than one trav eler unable to b o ok multiple ro oms unable to mak e changes in reserv ation unable to cancel reserv ation through mobile app unable to use online supp ort telephone supp ort slow and useless credit for first time mobile use unav ailable after telephone supp ort call hang up dial the hotel direct and dump this app” “i cant uninstall this app on my s i dont hav e a need for it please let me remov e it im so sick of bloatw are apple has the right idea when it comes to con trolling what go es on there phonessmh sprint and samsung you make it hard to b e a loy al customer when there are apps on my phone that i don t need or use that cant b e uninstalled” “samsung should stop adding crap bloat ware and leav e us course what we wan t installed on our phone why we cant remov e such app bring the phone with the app installed but lea ve us remo ve it i never use such app and i dont need it” “can t uninstall can t remov e” T able 5 T op r eviews asso ciate d with differ ent topics for the Go o gle Play platform. SINGLE ST AGE PREDICTION WITH MOBILE APP ONLINE REVIEWS 17 Assessing the qualit y of topic keyw ords can be challenging, since in terpretabilit y is a difficult c haracteristic to quantify . Mimno et al. ( 2011 ) pro vide one solution in a measure called topic coher- ence, where the general idea is to gauge the interpretabilit y of each topic based on co-o ccurrences of its keyw ords. The av erage keyw ord coherence is defined as Coherence = 2 K p ( p − 1) K X k =1 p X u =2 u − 1 X v =1 log D ( w k u , w k v ) + 0 . 01 D ( w k v ) , where ( w k 1 , . . . , w k p ) is the list of p top words in topic k , K is the num ber of topics, D ( w ) is the n um b er of reviews containing the w ord w , and D ( w , w 0 ) is the num ber of reviews containing b oth w and w 0 . The constant 0 . 01 is added to av oid taking the log of zero when tw o k eywords do not co- o ccur ov er all do cuments. Coherence is b ounded ab o v e by zero; mo del results with larger coherence scores ha ve b een sho wn to b e more in terpretable by human judges ( Mimno et al. , 2011 ). T o measure redundancy of the recov ered topics, w e rep ort Uniqueness, which is defined as the av erage prop ortion of keyw ords in eac h topic that do not appear as keyw ords for other topics (similar to “in ter-topic similarit y” in Arora et al. ( 2013 )). Larger v alues indicate more useful results. The top and middle panels of T able 6 shows that the prop osed metho d is generating interpretable and useful results. In con trast to competing methods that tend to score w ell on either Coherence or Uniqueness, SSMF is comp etitiv e on b oth dimensions. A third wa y to v alidate our results is to compare out of sample forecasts. W e generate predictions on the test set by using the estimated do cument-topic matrix ˆ Λ and regression co efficien ts from the most recent quarter ˆ β T − 1 ,a . W e again b enchmark the performance against LSA, pLSA, LD A, sLD A, and Lasso. The tw o-stage pro cedures utilize the con tin uation ratio mo del in the second stage and Lasso refers to the ` 1 p enalized con tinuation ratio mo del of Archer and Williams ( 2012 ). W e also include a standard con tin uation ratio model with all unigrams and bigrams as co v ariates and no p enalty . The b ottom panel of T able 6 shows that Lasso and the prop osed metho d pro duce the most accurate predictions. These results are consistent with the simulation study that sho w ed these t wo metho ds p erforming well among the tested metho dologies when the sample size is in the thousands, which approximately matches the n umber of reviews receiv ed eac h quarter collectiv ely for the three apps. 18 MANKAD, HU, AND GOP AL Keyw ord Coherence Platform LSA pLSA LD A sLDA Lasso Ordinal Regression SSMF iT unes -0.566 -0.750 -0.564 -0.688 NA NA -0.743 (0.355%) (32.979%) max (27.035%) (26.017%) Go ogle -0.862 -1.113 -0.826 -1.057 NA NA -0.926 Pla y (4.358%) (34.746%) max (27.966%) (12.107%) Uniqueness Platform LSA pLSA LD A sLDA Lasso Ordinal Regression SSMF iT unes 0.096 0.726 0.132 0.344 NA NA 0.592 (86.777%) max (81.818%) (52.617%) (18.457%) Go ogle 0.188 0.843 0.170 0.475 NA NA 0.580 Pla y (77.699%) max (79.834%) (43.654%) (31.198%) Misclassification Error Rates Platform LSA pLSA LDA sLD A Lasso Ordinal Regression SSMF iT unes 0.319 0.313 0.320 0.712 0.294 0.319 0.299 (8.503%) (6.463%) (8.844%) (142.180%) min (8.503%) (1.701%) Go ogle 0.373 0.376 0.376 0.639 0.334 0.377 0.327 Pla y (14.067%) (14.984%) (14.984%) (95.413%) (2.140%) (15.291%) min T able 6 Aver age topic c oherenc e and uniqueness b ase d on the top 100 topic keywor ds, and out of sample misclassific ation err or r ate when pr e dicting online r eview r atings in the first quarter of 2014 for iT unes and thir d quarter of 2014 for Go o gle Play. The r ep orte d p er centage is the r elative p er c entage of differenc e to the b est r esult. Note that sLDA was run assuming a normal ly distribute d resp onse as this is the only working option in the public c o de. Al l other metho ds wer e combine d with a c ontinuation r atio mo del. SINGLE ST AGE PREDICTION WITH MOBILE APP ONLINE REVIEWS 19 Ha ving c hosen and v alidated the prop osed models, we turn to syn thesizing our findings from the mobile apps data and the the estimation of Λ and β , which are summarized in Figures 2 and 3 , resp ectively . Figure 2 shows the amoun t of discussion in each quarter on eac h topic, assessed b y taking column sums of X ta Λ. Figure 3 displays the regression co efficients transformed in to probabilities, which is necessary to a void in terpretation difficulties that arise with viewing the co efficien ts directly . Sp ecifically , P ( Y ta = k ) is calculated by considering a h yp othetical document that loads on to a single topic, where X ta Λ = e m and e m is a v ector with 1 in the m -th p osition and zero elsewhere. The required marginal probabilities can b e readily computed using ( 4 )-( 6 ). These t w o figures, com bined with the ratings evolutions in Figure 1 , show several interesting patterns that help characterize the evolution of eac h app ov er time while also identifying areas of impro v ement for the res p ectiv e app dev elopment teams. W e see a small dip in the ov erall ratings for the Kay ak app on iT unes in the third and fourth quarter of 2013. This decrease coincided with discussion around t w o issues: softw are bugs (crashes, API errors, etc.) and versioning, whic h are then asso ciated with higher chances of the app b eing rated low er on the 5-p oint scale by users. Ev en though the volume of discussion was fairly stable, the topics b ecame increasingly toxic as users were rating the app more harshly along these dimensions, thereb y dragging do wn the o v erall rating. Similarly , we can see the o dds of receiving 1-star reviews strongly increasing with the o ccurrence of these topics within reviews, coinciding with a negativ e episo de in the ov erall ratings for the Expedia app on iT unes b et w een the third quarter of 2012 and the third quarter of 2013. In fact, we can see from Figure 3 that Exp edia has p ersistent problems with versioning and softw are bugs on b oth platforms that are on-going at the end of the data. On Go ogle Play , Exp edia is generally rated low er than its competitors, and w e see that, in addition to v ersioning, the company had difficulty esp ecially in 2012 with general user in terface issues around the launch of the app, follo w ed by difficulties around comp osing and p osting online reviews by its users. In con trast, T ripAdvisor has consisten tly b een rated highly on b oth platforms since the apps w ere in tro duced to the public. In terestingly , on b oth platforms we see installation and versioning as significan t sources of disconten t from users, though the amount of discussion on these topics has b een low. Nonetheless, it is relev an t to note that T ripAdvisor forces automatic up dates of its apps on b oth platforms and is ev en embedded in the op erating system as a default program on certain v ersions of Android mobile phones, which is at the heart of the negativ e feedback from users. This raises an interesting tradeoff for T ripAdvisor’s mobile strategy - b etw een the options of increasing its user base b y being embedded within the Android system v ersus the cost of alienating some users who may b e annoy ed at having to uninstall the app manually . 6. Conclusion. Consider a mobile app dev elop er who has introduced an app on the Go ogle Pla y app store and has received, o ver a p erio d of time, several thousand reviews from users. Ideally , the dev eloper would like to extract some information from these reviews that will help inform where the main problems are with the developed app, as well as where the app stands with resp ect to comp etitor apps on dimensions that relate to user exp erience or service qualit y . F urthermore, o v er time, the dev elop er w ould lik e to understand time trends relating to dimensions of feedbac k from online reviews, and ho w these are asso ciated with the receiv ed app rating. In this pap er, w e present an ordinal regression framework with em b edded topic modeling to recov er topics from online reviews that are predictiv e of the star rating in addition to b eing useful for understanding the underlying textual themes. Moreov er, this mo del p erforms particularly well in the sp ecific context of mobile apps, where reviews tend to be short, c hange o ver time with app v ersions, but ha v e common elements in terms of what users tend to discuss in these reviews. W e demonstrated how the mo del can b e applied for b enchmarking by analyzing mobile app reviews for Expedia, Ka yak, and T ripAdvisor. Sp ecifically , by in v estigating the trend in ov erall 20 MANKAD, HU, AND GOP AL iT unes ● ● ● ● ● ● ● ● ● ● ● ● ● ● ● ● ● ● ● ● ● ● ● ● ● ● ● ● ● ● ● ● ● ● ● ● ● ● ● ● Expedia Kay ak T r ipAdvisor 2010 Q4 2011 Q1 2011 Q2 2011 Q3 2011 Q4 2012 Q1 2012 Q2 2012 Q3 2012 Q4 2013 Q1 2013 Q2 2013 Q3 2013 Q4 2014 Q1 2010 Q4 2011 Q1 2011 Q2 2011 Q3 2011 Q4 2012 Q1 2012 Q2 2012 Q3 2012 Q4 2013 Q1 2013 Q2 2013 Q3 2013 Q4 2014 Q1 2010 Q4 2011 Q1 2011 Q2 2011 Q3 2011 Q4 2012 Q1 2012 Q2 2012 Q3 2012 Q4 2013 Q1 2013 Q2 2013 Q3 2013 Q4 2014 Q1 0.2 0.4 0.6 T opic Discussion T opic ● Functionality (Reservations) Functionality (Software b ugs) Over all Quality Usability (Online Revie ws) V ersioning Go ogle Play ● ● ● ● ● ● ● ● ● ● ● ● ● ● ● ● ● ● ● ● ● ● ● ● ● ● ● ● ● ● ● ● ● T r ipAdvisor Kay ak Expedia 2012 Q1 2012 Q2 2012 Q3 2012 Q4 2013 Q1 2013 Q2 2013 Q3 2013 Q4 2014 Q1 2014 Q2 2014 Q3 2012 Q1 2012 Q2 2012 Q3 2012 Q4 2013 Q1 2013 Q2 2013 Q3 2013 Q4 2014 Q1 2014 Q2 2014 Q3 2012 Q1 2012 Q2 2012 Q3 2012 Q4 2013 Q1 2013 Q2 2013 Q3 2013 Q4 2014 Q1 2014 Q2 2014 Q3 0.1 0.2 0.3 0.4 0.5 T opic Discussion T opic ● Functionality (Reservations) Installation & V ersioning Usability (Composing Revie ws) Usability (UI & Design) Fig 2: Prev alence of topics in reviews o ver time. SINGLE ST AGE PREDICTION WITH MOBILE APP ONLINE REVIEWS 21 iT unes 1 1 1 1 1 1 1 1 1 1 1 1 2 2 2 2 2 2 2 2 2 2 2 2 3 3 3 3 3 3 3 3 3 3 3 3 4 4 4 4 4 4 4 4 4 4 4 4 5 5 5 5 5 5 5 5 5 5 5 5 1 1 1 1 1 1 1 1 1 1 1 1 2 2 2 2 2 2 2 2 2 2 2 2 3 3 3 3 3 3 3 3 3 3 3 3 4 4 4 4 4 4 4 4 4 4 4 4 5 5 5 5 5 5 5 5 5 5 5 5 1 1 1 1 1 1 1 1 1 1 1 1 2 2 2 2 2 2 2 2 2 2 2 2 3 3 3 3 3 3 3 3 3 3 3 3 4 4 4 4 4 4 4 4 4 4 4 4 5 5 5 5 5 5 5 5 5 5 5 5 1 1 1 1 1 1 1 1 1 1 1 1 2 2 2 2 2 2 2 2 2 2 2 2 3 3 3 3 3 3 3 3 3 3 3 3 4 4 4 4 4 4 4 4 4 4 4 4 5 5 5 5 5 5 5 5 5 5 5 5 1 1 1 1 1 1 1 1 1 1 1 1 2 2 2 2 2 2 2 2 2 2 2 2 3 3 3 3 3 3 3 3 3 3 3 3 4 4 4 4 4 4 4 4 4 4 4 4 5 5 5 5 5 5 5 5 5 5 5 5 1 1 1 1 1 1 1 1 1 1 1 1 1 1 2 2 2 2 2 2 2 2 2 2 2 2 2 2 3 3 3 3 3 3 3 3 3 3 3 3 3 3 4 4 4 4 4 4 4 4 4 4 4 4 4 4 5 5 5 5 5 5 5 5 5 5 5 5 5 5 1 1 1 1 1 1 1 1 1 1 1 1 1 1 2 2 2 2 2 2 2 2 2 2 2 2 2 2 3 3 3 3 3 3 3 3 3 3 3 3 3 3 4 4 4 4 4 4 4 4 4 4 4 4 4 4 5 5 5 5 5 5 5 5 5 5 5 5 5 5 1 1 1 1 1 1 1 1 1 1 1 1 1 1 2 2 2 2 2 2 2 2 2 2 2 2 2 2 3 3 3 3 3 3 3 3 3 3 3 3 3 3 4 4 4 4 4 4 4 4 4 4 4 4 4 4 5 5 5 5 5 5 5 5 5 5 5 5 5 5 1 1 1 1 1 1 1 1 1 1 1 1 1 1 2 2 2 2 2 2 2 2 2 2 2 2 2 2 3 3 3 3 3 3 3 3 3 3 3 3 3 3 4 4 4 4 4 4 4 4 4 4 4 4 4 4 5 5 5 5 5 5 5 5 5 5 5 5 5 5 1 1 1 1 1 1 1 1 1 1 1 1 1 1 2 2 2 2 2 2 2 2 2 2 2 2 2 2 3 3 3 3 3 3 3 3 3 3 3 3 3 3 4 4 4 4 4 4 4 4 4 4 4 4 4 4 5 5 5 5 5 5 5 5 5 5 5 5 5 5 1 1 1 1 1 1 1 1 1 1 1 1 1 1 2 2 2 2 2 2 2 2 2 2 2 2 2 2 3 3 3 3 3 3 3 3 3 3 3 3 3 3 4 4 4 4 4 4 4 4 4 4 4 4 4 4 5 5 5 5 5 5 5 5 5 5 5 5 5 5 1 1 1 1 1 1 1 1 1 1 1 1 1 1 2 2 2 2 2 2 2 2 2 2 2 2 2 2 3 3 3 3 3 3 3 3 3 3 3 3 3 3 4 4 4 4 4 4 4 4 4 4 4 4 4 4 5 5 5 5 5 5 5 5 5 5 5 5 5 5 1 1 1 1 1 1 1 1 1 1 1 1 1 1 2 2 2 2 2 2 2 2 2 2 2 2 2 2 3 3 3 3 3 3 3 3 3 3 3 3 3 3 4 4 4 4 4 4 4 4 4 4 4 4 4 4 5 5 5 5 5 5 5 5 5 5 5 5 5 5 1 1 1 1 1 1 1 1 1 1 1 1 1 1 2 2 2 2 2 2 2 2 2 2 2 2 2 2 3 3 3 3 3 3 3 3 3 3 3 3 3 3 4 4 4 4 4 4 4 4 4 4 4 4 4 4 5 5 5 5 5 5 5 5 5 5 5 5 5 5 1 1 1 1 1 1 1 1 1 1 1 1 1 1 2 2 2 2 2 2 2 2 2 2 2 2 2 2 3 3 3 3 3 3 3 3 3 3 3 3 3 3 4 4 4 4 4 4 4 4 4 4 4 4 4 4 5 5 5 5 5 5 5 5 5 5 5 5 5 5 Expedia Kayak T ripAdvisor Usability (Online Reviews) Functionality (Reservations) Overall Quality V ersioning Functionality (Software bugs) 2010 Q4 2011 Q1 2011 Q2 2011 Q3 2011 Q4 2012 Q1 2012 Q2 2012 Q3 2012 Q4 2013 Q1 2013 Q2 2013 Q3 2013 Q4 2014 Q1 2010 Q4 2011 Q1 2011 Q2 2011 Q3 2011 Q4 2012 Q1 2012 Q2 2012 Q3 2012 Q4 2013 Q1 2013 Q2 2013 Q3 2013 Q4 2014 Q1 2010 Q4 2011 Q1 2011 Q2 2011 Q3 2011 Q4 2012 Q1 2012 Q2 2012 Q3 2012 Q4 2013 Q1 2013 Q2 2013 Q3 2013 Q4 2014 Q1 0.00 0.25 0.50 0.75 1.00 0.00 0.25 0.50 0.75 1.00 0.00 0.25 0.50 0.75 1.00 0.00 0.25 0.50 0.75 1.00 0.00 0.25 0.50 0.75 1.00 Probability Rating 1 2 3 4 5 Go ogle Play 1 1 1 1 1 1 1 1 1 1 1 2 2 2 2 2 2 2 2 2 2 2 3 3 3 3 3 3 3 3 3 3 3 4 4 4 4 4 4 4 4 4 4 4 5 5 5 5 5 5 5 5 5 5 5 1 1 1 1 1 1 1 1 1 1 1 2 2 2 2 2 2 2 2 2 2 2 3 3 3 3 3 3 3 3 3 3 3 4 4 4 4 4 4 4 4 4 4 4 5 5 5 5 5 5 5 5 5 5 5 1 1 1 1 1 1 1 1 1 1 1 2 2 2 2 2 2 2 2 2 2 2 3 3 3 3 3 3 3 3 3 3 3 4 4 4 4 4 4 4 4 4 4 4 5 5 5 5 5 5 5 5 5 5 5 1 1 1 1 1 1 1 1 1 1 1 2 2 2 2 2 2 2 2 2 2 2 3 3 3 3 3 3 3 3 3 3 3 4 4 4 4 4 4 4 4 4 4 4 5 5 5 5 5 5 5 5 5 5 5 1 1 1 1 1 1 1 1 1 1 1 2 2 2 2 2 2 2 2 2 2 2 3 3 3 3 3 3 3 3 3 3 3 4 4 4 4 4 4 4 4 4 4 4 5 5 5 5 5 5 5 5 5 5 5 1 1 1 1 1 1 1 1 1 1 1 2 2 2 2 2 2 2 2 2 2 2 3 3 3 3 3 3 3 3 3 3 3 4 4 4 4 4 4 4 4 4 4 4 5 5 5 5 5 5 5 5 5 5 5 1 1 1 1 1 1 1 1 1 1 1 2 2 2 2 2 2 2 2 2 2 2 3 3 3 3 3 3 3 3 3 3 3 4 4 4 4 4 4 4 4 4 4 4 5 5 5 5 5 5 5 5 5 5 5 1 1 1 1 1 1 1 1 1 1 1 2 2 2 2 2 2 2 2 2 2 2 3 3 3 3 3 3 3 3 3 3 3 4 4 4 4 4 4 4 4 4 4 4 5 5 5 5 5 5 5 5 5 5 5 1 1 1 1 1 1 1 1 1 1 1 2 2 2 2 2 2 2 2 2 2 2 3 3 3 3 3 3 3 3 3 3 3 4 4 4 4 4 4 4 4 4 4 4 5 5 5 5 5 5 5 5 5 5 5 1 1 1 1 1 1 1 1 1 1 1 2 2 2 2 2 2 2 2 2 2 2 3 3 3 3 3 3 3 3 3 3 3 4 4 4 4 4 4 4 4 4 4 4 5 5 5 5 5 5 5 5 5 5 5 1 1 1 1 1 1 1 1 1 1 1 2 2 2 2 2 2 2 2 2 2 2 3 3 3 3 3 3 3 3 3 3 3 4 4 4 4 4 4 4 4 4 4 4 5 5 5 5 5 5 5 5 5 5 5 1 1 1 1 1 1 1 1 1 1 1 2 2 2 2 2 2 2 2 2 2 2 3 3 3 3 3 3 3 3 3 3 3 4 4 4 4 4 4 4 4 4 4 4 5 5 5 5 5 5 5 5 5 5 5 Expedia Kayak T ripAdvisor Functionality (Reservations) Usability (UI & Design) Usability (Composing Reviews) Installation & V ersioning 2012 Q1 2012 Q2 2012 Q3 2012 Q4 2013 Q1 2013 Q2 2013 Q3 2013 Q4 2014 Q1 2014 Q2 2014 Q3 2012 Q1 2012 Q2 2012 Q3 2012 Q4 2013 Q1 2013 Q2 2013 Q3 2013 Q4 2014 Q1 2014 Q2 2014 Q3 2012 Q1 2012 Q2 2012 Q3 2012 Q4 2013 Q1 2013 Q2 2013 Q3 2013 Q4 2014 Q1 2014 Q2 2014 Q3 0.00 0.25 0.50 0.75 1.00 0.00 0.25 0.50 0.75 1.00 0.00 0.25 0.50 0.75 1.00 0.00 0.25 0.50 0.75 1.00 Probability Rating 1 2 3 4 5 Fig 3: Probability of ratings b y topic app earance. 22 MANKAD, HU, AND GOP AL ratings in combination with the estimated ratings probabilit y by topic, w e identified potential reasons b ehind p o or user satisfaction that resulted in negative mo vemen ts in the ov erall star rating for an app. F or instance, we observ e that the increased odds of receiving 1-star reviews during the final quarter of our dataset is asso ciated with negativ e feedback related to the topic describ ed b y v ersioning issues. On deeper examination, we conclude that all three companies on the tw o platforms should b e particularly cognizan t of the pros and cons of the versioning strategy they esp ouse. While forcing users in to app up dates may help improv e the user exp erience for s ome users b y fixing soft w are bugs or introducing new and imp ortant features to the up dated app, there is the p oten tial cost of alienating a different and p otentially o verlapping set of users when such automatic up dates are to o frequent or add low quality features. Suc h a p oten tial tradeoff can b e deduced b y app developers through the use of the SSMF approach w e describ e. In a related manner, and as discussed ab o ve for T ripAdvisor, a similar p otential downside from a dev elopmen t p ersp ective exists with resp ect to the strategy of preinstalling the app on mobile phones. While this strategy helps some users, it can cause dissatisfaction to others who are faced with ha ving to delete the app manually . In y et another instance during the final quarter of data, Exp edia’s iT unes-based users rep ort the presence of critical softw are bugs while Android-based users complain ab out the reserv ation functionality . Based on our metho dology , it would b e p ossible for Exp edia to corrob orate these initial insigh ts through traditional softw are testing and redirect their app developmen t team’s efforts more effectively tow ards tackling these sources of discon tent among its users. It is in teresting to note that our prop osed mo del and Lasso generally p erformed the b est, and on par with eac h other, among the tested metho dologies in terms of forecasting accuracy on both the real reviews data as well as on sim ulated data. These results are consistent with O’Callaghan et al. ( 2015 ) who sho wed that NMF st yle factorizations may lead to b etter solutions compared to LDA-based approaches, esp ecially with niche or non-mainstream corp ora, such as reviews for mobile apps on mobile devices, which tend to b e short and informal. Another factor determining the efficacy of the prop osed mo del, relative to other mo dels, is sample size (num b er of do cuments). In the sim ulation, Lasso and the prop osed mo dels were preferred when the sample size was in the thousands or smaller. At larger sample sizes in each time point, our simulation indicated that t w o-stage pro cedures with standard topic mo deling in the first stage p erform equally w ell. While w e consider three clearly comp etitiv e apps within the same industry here, an imp ortant and particularly insigh tful extension of our metho dology could b e to recov er mark et structure for the en tire app market using online app reviews. Mark et structure is an imp ortant factor in firm- lev el decision making p ertaining to pro duct developmen t, pricing, and marketing strategies. Y et, in general with mobile apps, the appropriate set of benchmark or comp etitive apps is unclear, esp ecially from the consumers’s p ersp ective. F or instance, if an app streams video even without it b eing a core feature, the a v erage consumer migh t benchmark this functionalit y in ternally against Netflix or the Y ouT ub e app, p opular apps that sp ecialize in video pla yback. Thus, identifying whic h other apps are seen b y the consumer as competitors or substitutes could b e derived from the set of online reviews associated with each of these apps, thereb y enhancing the v alue that companies gain from a be tter understanding of online reviews. T ackling this problem w ould likely require analyzing data from a muc h broader set of mobile apps, p otentially the entire marketplace, which raises sev eral metho dological issues from prepro cessing the data ( F u et al. , 2013 ) to summarizing net w ork structure and trends o v er time. As such, a growing n um b er of firms hav e b egun developing dash b oards that displa y summaries of online customer reviews to managers ( Han et al. , 2016 ). Our metho dology is promising for suc h summaries that require b enchmarking, understanding market dynamics, and prediction accuracy . SINGLE ST AGE PREDICTION WITH MOBILE APP ONLINE REVIEWS 23 Ac kno wledgemen ts. This material is based up on work supp orted by the National Science F oundation under Gran t No. 1633158 (Mank ad). The authors would also lik e to thank the anonymous referees, the Asso c iate Editor, and Editor for constructive comments and suggestions that resulted in a muc h improv ed pap er. SUPPLEMENT AR Y MA TERIAL Ra w Data and R Co de (doi: COMPLETED BY THE TYPESETTER ; .zip). The zip file contains the raw online reviews data for the three apps on b oth platforms in addition to implementations in R of the prop osed matrix factorization. References. ABIresearch, (2012). M-Commerce Growing to 24Smartphone Adoption. https://www.abiresearch.com/press/ m- commerce- growing- to- 24- of- total- e- commerce- marke/ Accessed: 2016-06-18. Abrahams, A. S. , F an, W. , Alan W ang, G. , Zhang, Z. J. and Jia o, J. (2015). An In tegrated T ext Analytic F ramew ork for Pro duct Defect Discov ery. Pr o duction and Op erations Management 24 975–990. A gar w al, D. and Chen, B.-C. (2010). fLDA: matrix factorization through laten t dirichlet allocation. In Pr o c e e dings of the thir d ACM international c onfer enc e on Web se ar ch and data mining 91–100. ACM. Anthes, G. (2011). Inv asion of the mobile apps. Communic ations of the ACM 54 16–18. Archer, K. and Williams, A. (2012). L 1 penalized contin uation ratio models for ordinal resp onse prediction using high-dimensional datasets. Statistics in me dicine 31 1464–1474. Armstrong, B. G. and Sloan, M. (1989). Ordinal regression mo dels for epidemiologic data. Americ an Journal of Epidemiolo gy 129 191–204. Arora, S. , Ge, R. , Halpern, Y. , Mimno, D. , Moitra, A. , Sont a g, D. , Wu, Y. and Zhu, M. (2013). A practical algorithm for topic modeling with pro v able guaran tees. In International Confer enc e on Machine L e arning 280–288. Ba vot a, G. (2016). Mining Unstructured Data in Softw are Rep ositories: Current and F uture T rends. In 2016 IEEE 23r d International Confer enc e on Softwar e A nalysis, Evolution, and R e engine ering (SANER) 5 1–12. IEEE. Ber tsekas, D. P. (1976). On the Goldstein-Levitin-Poly ak gradient pro jection metho d. Automatic Contr ol, IEEE T r ansactions on 21 174–184. Ber tsekas, D. P. (1999). Nonlinear programming. Blei, D. M. (2012). Probabilistic topic mo dels. Communications of the ACM 55 77–84. Blei, D. M. and Jordan, M. I. (2006). V ariational inference for Dirichlet process mixtures. Bayesian Analysis 1 121–143. Blei, D. M. and Laffer ty, J. D. (2006). Dynamic topic mo dels. In Pr o c e e dings of the 23r d international c onfer ence on Machine le arning 113–120. ACM. Blei, D. M. , Ng, A. Y. and Jordan, M. I. (2003). Latent dirichlet allo cation. the Journal of machine L e arning r esear ch 3 993–1022. Boyd-Graber, J. , Mimno, D. , Newman, D. , Airoldi, E. M. , Blei, D. , Eroshev a, E. A. and Fienberg, S. E. (2014). Care and F eeding of T opic Mo dels: Problems, Diagnostics, and Improv ements. Handb ook of Mixe d Mem- b ership Mo dels and Their Applications . Brod y, S. and Elhad ad, N. (2010). An unsup ervised aspect-sentimen t model for online reviews. In Human L anguage T e chnolo gies: The 2010 Annual Confer enc e of the North Americ an Chapter of the Asso ciation for Computational Linguistics 804–812. Asso ciation for Computational Linguistics. Bur tch, G. and Hong, Y. (2014). What Happ ens When W ord of Mouth Go es Mobile? Pro c ee dings of the Interna- tional Confer enc e on Information Systems . B ¨ uschken, J. and Allenby, G. M. (2016). Sentence-Based T ext Analysis for Customer Reviews. Marketing Scienc e 35 953–975. Cao, Q. , Duan, W. and Gan, Q. (2011). Exploring determinants of v oting for the helpfulness of online user reviews: A text mining approach. De cision Supp ort Systems 50 511–521. Chang, J. (2012). lda: Collapsed Gibbs sampling metho ds for topic mo dels. R pack age version 1.3.2. Chen, Z. and Lurie, N. H. (2013). T emp oral contiguit y and negativity bias in the impact of online word of mouth. Journal of Marketing R ese ar ch 50 463–476. Chen, N. , Lin, J. , Hoi, S. C. , Xiao, X. and Zhang, B. (2014). AR-Miner: mining informativ e reviews for developers from mobile app marketplace. In Pr o c e e dings of the 36th International Confer enc e on Softwar e Engine ering 767– 778. ACM. Cox, C. (1988). Multinomial regression mo dels based on contin uation ratios. Statistics in Me dicine 7 435–441. 24 MANKAD, HU, AND GOP AL Deer wester, S. C. , Dumais, S. T. , Landa uer, T. K. , Furnas, G. W. and Harshman, R. A. (1990). Indexing b y latent seman tic analysis. JAsIs 41 391–407. Ding, C. , Li, T. and Peng, W. (2008). On the equiv alence b etw een Non-negative Matrix F actorization and Proba- bilistic Latent Semantic Indexing. Comput. Stat. Data Anal. 52 3913–3927. Ding, C. , Li, T. and Jordan, M. I. (2010). Con vex and Semi-Nonnegativ e Matrix F actorizations. Pattern Analysis and Machine Intel ligenc e, IEEE T r ansactions on 32 45-55. Feinerer, I. , Hornik, K. and Meyer, D. (2008). T ext Mining Infrastructure in R. Journal of Statistic al Softwar e 25 1–54. Fienberg, S. E. (2007). The analysis of cr oss-classifie d c ate goric al data . Springer Science & Business Media. Friedman, J. , Hastie, T. and Tibshirani, R. (2010). Regularization P aths for Generalized Linear Mo dels via Co ordinate Descent. Journal of Statistic al Softwar e 33 1–22. Fu, B. , Lin, J. , Li, L. , F aloutsos, C. , Hong, J. and Sadeh, N. (2013). Why p eople hate your app: Making sense of user feedbac k in a mobile app store. In Pr o c e e dings of the 19th ACM SIGKDD international confer enc e on Know le dge disc overy and data mining 1276–1284. ACM. Gal vis Carre ˜ no, L. V. and Winbladh, K. (2013). Analysis of user comments: an approach for softw are require- men ts evolution. In Pr o c e e dings of the 2013 International Confer enc e on Softwar e Engine ering 582–591. IEEE Press. Godes, D. and Ma yzlin, D. (2004). Using online conv ersations to study w ord-of-mouth communication. Marketing scienc e 23 545–560. Gr ¨ un, B. and Hornik, K. (2011). topicmo dels: An R Pac k age for Fitting T opic Mo dels. Journal of Statistic al Softwar e 40 1–30. Han, H. J. , Mankad, S. , Ga virneni, S. and Verma, R. (2016). What guests really think of your hotel: T ext analytics of online customer reviews. Cornel l Hospitality R eport . Harrell, F. (2015). R e gr ession mo deling str ate gies: with applic ations to line ar models, lo gistic and or dinal r e gr ession, and survival analysis . Springer. Hofmann, T. (1999). Probabilistic latent seman tic indexing. In Pr o c e e dings of the 22nd annual international ACM SIGIR c onfer enc e on Rese ar ch and development in information retrieval 50–57. ACM. Holmes, D. I. (1985). The analysis of literary style–a review. Journal of the R oyal Statistic al So ciety. Series A (Gener al) 328–341. Iacob, C. and Harrison, R. (2013). Retrieving and analyzing mobile apps feature requests from online reviews. In Mining Softwar e R ep ositories (MSR), 2013 10th IEEE Working Confer enc e on 41–44. IEEE. Ickin, S. , W ac, K. , Fiedler, M. , Janowski, L. , Hong, J.-H. and Dey, A. K. (2012). F actors influencing qualit y of exp erience of commonly used mobile applications. Communic ations Magazine, IEEE 50 48–56. Jo, Y. and Oh, A. H. (2011). Asp ect and sentimen t unification mo del for online review analysis. In Pr o ce e dings of the fourth ACM international c onfer enc e on Web se ar ch and data mining 815–824. ACM. Kan, S. , Basili, V. R. and Shapir o, L. N. (1994). Soft w are qualit y: an ov erview from the p ersp ective of total qualit y management. IBM Systems Journal 33 4–19. Krishnan, M. S. , Kriebel, C. H. , Kekre, S. and Mukhop adhy a y, T. (2000). An empirical analysis of pro ductivity and quality in softw are pro ducts. Management scienc e 46 745–759. Lee, D. D. and Seung, H. S. (1999). Learning the parts of ob jects by non-negativ e matrix factorization. Natur e 401 788-791. Lee, D. D. and Seung, H. S. (2001). Algorithms for non-negative matrix factorization. A dvanc es in neur al infor- mation pr o c essing systems 556–562. Li, X. and Hitt, L. M. (2008). Self-selection and information role of online pro duct reviews. Information Systems R esear ch 19 456–474. Lim, S. L. , Bentley, P. J. , Kanakam, N. , Ishika w a, F. and Honiden, S. (2015). Inv estigating country differences in mobile app user b ehavior and challenges for soft ware engineering. Softwar e Engine ering, IEEE T r ansactions on 41 40–64. Lin, C.-b. (2007). Pro jected gradient metho ds for nonnegative matrix factorization. Neur al c omputation 19 2756– 2779. Lu, Y. , Mei, Q. and Zhai, C. (2011). In v estigating task p erformance of probabilistic topic models: an empirical study of PLSA and LDA. Information R etrieval 14 178–203. Lu, B. , Ott, M. , Cardie, C. and Tsou, B. K. (2011). Multi-asp ect sentimen t analysis with topic mo dels. In Data Mining Workshops (ICDMW), 2011 IEEE 11th International Confer enc e on 81–88. IEEE. Maalej, W. and Nabil, H. (2015). Bug rep ort, feature request, or simply praise? on automatically classifying app reviews. In R e quir ements Engine ering Confer enc e (RE), 2015 IEEE 23r d International 116–125. IEEE. Mankad, S. and Michailidis, G. (2013). Discov ery of path-imp ortant nodes using structured semi-nonnegative matrix factorization. In Computational A dvanc es in Multi-Sensor A daptive Pr oc essing (CAMSAP), 2013 IEEE 5th International Workshop on 288-291. SINGLE ST AGE PREDICTION WITH MOBILE APP ONLINE REVIEWS 25 Mankad, S. and Michailidis, G. (2015). Analysis of Multiview Legislative Netw ork with Structured Matrix F ac- torization: Do es Twitter Influence T ranslate to the Real W orld? Annals of Applie d Statistics . Mankad, S. , Han, H. J. , Goh, J. and Ga virneni, S. (2016). Understanding Online Hotel Reviews through Auto- mated T ext Analysis. Servic e Scienc e 8 124-138. Mankad, S. , Hu, S. and Gop al, A. (2018). Supplement to “Single Stage Prediction with Em b edded T opic Mo deling of Online Reviews for Mobile App Management”. DOI: COMPLETED BY THE TYPESETTER.. McA uley, J. , Lesko vec, J. and Jurafsky, D. (2012). Learning attitudes and attributes from m ulti-asp ect reviews. In Data Mining (ICDM), 2012 IEEE 12th International Confer enc e on 1020–1025. IEEE. McA uley, J. and Leskovec, J. (2013). Hidden factors and hidden topics: understanding rating dimensions with review text. In Pr o ce e dings of the 7th ACM c onfer enc e on R ec ommender systems 165–172. ACM. Mcauliffe, J. D. and Blei, D. M. (2008). Sup ervised topic mo dels. In A dvanc es in neural information pr o c essing systems 121–128. McCullagh, P. (1980). Regression mo dels for ordinal data. Journal of the r oyal statistic al so ciety. Series B (Metho d- olo gical) 109–142. Mimno, D. , W allach, H. M. , T alley, E. , Leenders, M. and McCallum, A. (2011). Optimizing semantic co- herence in topic mo dels. In Pr o c e e dings of the Confer ence on Empiric al Metho ds in Natur al L anguage Pr o c essing 262–272. Asso ciation for Computational Linguistics. MobileBusinessInsights, (2016). Mobile commerce trends: Retail in 2017, 2018 and b eyond. http: //mobilebusinessinsights.com/2016/12/mobile- commerce- trends- retail- in- 2017- 2018- and- beyond/ Accessed: 2017-04-05. O’Callaghan, D. , Greene, D. , Car thy, J. and Cunningham, P. (2015). An analysis of the coherence of descriptors in topic mo deling. Exp ert Systems with Applic ations 42 5645–5657. P anichella, A. , Dit, B. , Oliveto, R. , Di Pent a, M. , Poshyv anyk, D. and De Lucia, A. (2013). Ho w to Effec- tiv ely Use T opic Mo dels for Softw are Engineering T asks? An Approac h Based on Genetic Algorithms. In Pr o c e e dings of the 2013 International Confer enc e on Software Engine ering . ICSE ’13 522–531. IEEE Press, Piscataw ay , NJ, USA. P anichella, S. , Di Sorbo, A. , Guzman, E. , Visaggio, C. A. , Canfora, G. and Gall, H. C. (2015). How can i improv e my app? classifying user reviews for softw are maintenance and evolution. In Softwar e Maintenanc e and Evolution (ICSME), 2015 IEEE International Confer ence on 281–290. IEEE. P arasuraman, A. , Zeithaml, V. A. and Berr y, L. L. (1988). Servqual. Journal of Retailing 64 12–40. Por teous, I. , Newman, D. , Ihler, A. , Asuncion, A. , Smyth, P. and Welling, M. (2008). F ast Collapsed Gibbs Sampling for Latent Dirichlet Allo cation. In Pr o c e e dings of the 14th ACM SIGKDD International Confer enc e on Know le dge Disc overy and Data Mining . KDD ’08 569–577. ACM, New Y ork, NY, USA. Pressman, R. S. (2005). Softwar e engine ering: a pr actitioner’s appr o ach . Palgra v e Macmillan. R Core Team, (2014). R: A Language and Environmen t for Statistical Computing R F oundation for Statistical Computing, Vienna, Austria. R ober tson, S. (2004). Understanding inv erse document frequency: on theoretical arguments for IDF. Journal of do cumentation 60 503–520. Sal ton, G. and Michael, J. (1983). McGill. Intr o duction to m o dern information r etrieval 24–51. Serrano, N. , Hernantes, J. and Gallardo, G. (2013). Mobile web apps. Softwar e, IEEE 30 22–27. Snyder, B. and Barzila y, R. (2007). Multiple Asp ect Ranking Using the Go o d Grief Algorithm. In HL T-NAACL 300–307. T add y, M. (2013). Multinomial inv erse regression for text analysis. Journal of the Americ an Statistic al Asso ciation 108 755–770. Thomas, S. W. , Nagapp an, M. , Blostein, D. and Hassan, A. E. (2013). The Impact of Classifier Configuration and Classifier Combination on Bug Lo calization. IEEE T r ansactions on Softwar e Engine ering 39 1427-1443. Tibshirani, R. (1996). Regression shrink age and selection via the lasso. Journal of the Royal Statistical So ciety. Series B (Metho dolo gic al) 267–288. Tirunillai, S. and Tellis, G. J. (2014). Mining marketing meaning from online chatter: Strategic brand analysis of big data using latent Dirichlet allocation. Journal of Marketing R ese ar ch 51 463–479. Titov, I. and McDonald, R. T. (2008a). A Joint Mo del of T ext and Asp ect Ratings for Sen timent Summarization. In ACL 8 308–316. Citeseer. Titov, I. and McDonald, R. (2008b). Mo deling online reviews with m ulti-grain topic mo dels. In Pro c e e dings of the 17th international c onfer enc e on World Wide Web 111–120. ACM. W ang, C. and Blei, D. M. (2011). Collaborative topic mo deling for recommending scientific articles. In Pr o ce e dings of the 17th ACM SIGKDD international c onfer enc e on Know ledge disc overy and data mining 448–456. ACM. W ang, H. , Lu, Y. and Zhai, C. (2010). Latent asp ect rating analysis on review text data: a rating regression approac h. In Pr o c e e dings of the 16th A CM SIGKDD international c onfer enc e on Know le dge disc overy and data mining 783–792. ACM. 26 MANKAD, HU, AND GOP AL W asserman, A. I. (2010). Soft w are engineering issues for mobile application developmen t. In Pr o c e e dings of the FSE/SDP workshop on F uture of softwar e engine ering r ese ar ch 397–400. ACM. Wu, Y. and Ester, M. (2015). Flame: A probabilistic mo del com bining aspect based opinion mining and collab orative filtering. In Pr o c e e dings of the Eighth ACM International Confer enc e on Web Se ar ch and Data Mining 199–208. A CM. Xu, W. , Liu, X. and Gong, Y. (2003). Do cument clustering based on non-negative matrix factorization. In Pr o- c ee dings of the 26th annual international ACM SIGIR c onfer enc e on R ese ar ch and development in informaion r etrieval . SIGIR ’03 267–273. ACM, New Y ork, NY, USA. APPENDIX A: ALGORITHM FOR THE SINGLE ST A GE MA TRIX F A CTORIZA TION WITH NORMAL RESPONSES The final algorithm for the SSMF is giv en in Algorithm 1 . Up dating Λ and sp ecifically searc hing for an appropriate γ i when up dating Λ is the most time- consuming task. The ma jor computation when searching for a go o d step size is h ∆ Λ ( i ) , Λ ( i +1) − Λ ( i ) i , where h· , ·i is the sum of element wise pro ducts of t wo matrices. Breaking do wn this sp ecific calculation, w e fo cus on the gradient whic h is defined in ( 2 ). X T X , β β T , and X T Y β T can all b e precomputed b efore en tering into the step size searc h. In fact, X T X and X T Y can b e computed b efore b eginning Algorithm 1 . Due to these precomputations, the cost of searching for the step size is O ( p 2 n ) + O ( pn ) + O ( pm ) + O ( m 2 ) | {z } Precomputed X T X , X T Y , ( X T Y ) β T , and β β T +#sub-iterations × ( O ( p 2 m ) | {z } ( X T X )Λ + O ( pm 2 ) | {z } Λ( β β T ) ) . Adding in the cost of the element-wise sum and estimating β with standard pro cedures ( O (( n + m ) m 2 )), the ov erall cost of the algorithm is O ( p 2 n ) + O ( pn )+ #iterations × O (( n + m ) m 2 ) + O ( pm ) + O ( m 2 ) + #sub-iterations × O ( p 2 m ) + O ( pm 2 ) . As long as the num b er of sub-iterations is small, the algorithm is efficient for the given data, esp ecially since the v o cabulary size is not extremely large. T o this end, w e utilize the heuristic of using α i − 1 as an initial guess for γ i , and set σ = 0 . 01 and γ = 0 . 9. Figure 4 shows the algorithm results in estimates that monotonically impro ve at each iteration and con v erge fairly quic kly . In our exp erimen ts, the relativ e difference b etw een ob jective v alues con v erged to within 10 − 4 t ypically within 15 iterations. APPENDIX B: COMP ARING THE CONSTRAINED AND SA TURA TED CONTINUA TION RA TIO MODELS In this section we ev aluate whether the constrained or saturated mo del is preferred. The results presen ted here use the real data from the app mark etplaces and the final prop osed model that includes regression co efficien ts v arying o v er time and app. In this framework, the constrained model sp ecifies that β tak = β ta for all k . W e compare the nested mo dels using likelihoo d ratio tests. Define the lik eliho o d ratio statistic G = 2 ( l (Saturated Mo del) − l (Constrained Mo del)) , follo wing a Chi-Squared distribution with d f 2 − d f 1 degrees of freedom, where d f 1 = #T opics ∗ #Apps ∗ #Time p oints d f 2 = # T opics ∗ # Apps ∗ #Time p oints ∗ (# Rating categories − 1) . SINGLE ST AGE PREDICTION WITH MOBILE APP ONLINE REVIEWS 27 ● ● ● ● ● ● ● ● ● ● ● ● ● ● ● ● ● ● ● ● ● ● ● ● ● ● ● ● ● ● ● ● ● ● ● ● ● ● ● ● ● ● ● ● ● ● ● ● ● ● 50000 100000 150000 0 10 20 30 40 50 Iteration Number Objective Function Fig 4: One instance of the ob jective function at each iteration of the SSMF estimation. The alter- nating pro jected gradient descent algorithm monotonically improv es the estimates with resp ect to the ob jectiv e function. Algorithm 1 The Alternating Least Squares Algorithm with pro jected gradien t descent for nor- mally distributed Y , where the sup erscript ( i ) denotes the iteration n umber. 1: Set i = 0 2: Initialize ( β ) ( i ) j ∼ N (0 , 1) for all j 3: Initialize γ i = 1 , γ = 0 . 9 4: while δ ≥ and i ≤ max iterations do 5: γ i +1 = γ i 6: if γ i +1 satisfies ( 3 ) then 7: rep eat 8: γ i +1 = γ i +1 γ 9: un til γ i +1 do es not satisfies ( 3 ) 10: else 11: rep eat 12: γ i +1 = γ i +1 γ 13: un til γ i +1 satisfies ( 3 ) 14: end if 15: Set Λ ( i +1) = P Λ ( i ) − γ i +1 ( X T X Λ β β T − X T Y β T ) 16: Set ˜ X = X Λ ( i +1) . 17: Set for β ( i +1) = ( ˜ X T ˜ X ) − 1 ˜ X T Y . 18: Set δ = || Y − X Λ ( i +1) β ( i +1) || 2 2 −|| Y − X Λ ( i ) β ( i ) || 2 2 || Y − X Λ ( i ) β ( i ) || 2 2 19: Set i = i + 1 20: end while 28 MANKAD, HU, AND GOP AL Platform Saturated SSMF SSMF iT unes 0.300 0.299 Go ogle Play 0.337 0.327 T able 7 Out of Sample Misclassific ation Err or R ates of the prop ose d mo del with r e gr ession co efficients that vary over time and app. The Satur ate d SSMF al lows the r e gr ession c o efficients to additional ly vary for e ach c ate gory versus fixe d over r atings c ate gories. On the iT unes data the lik eliho o d ratio statistic G = 12 . 575 has a p-v alue close to 1 . 000 and on Go ogle Play G = 423 . 811 has a p-v alue of 0 . 161. F ailing to reject the null h yp othesis on both platforms indicates that the constrained mo del fits as well as the saturated v ersion. Th us, we prefer the constrained version of the mo del. This decision is confirmed b y the out of sample misclassification error rates on our online reviews data in T able 7 . The constrained mo del p erforms fav orably , esp ecially on the Go ogle Play data, indicating that the more complex, saturated mo del lik ely ov erfits the data. APPENDIX C: ESTIMA TION OF THE DYNAMIC F A CTORIZA TION EMBEDDED CONTINUA TION RA TIO MODEL The log-likelihoo d function for the prop osed mo del is l (Λ , β ta | Y tak , X ta ) = T X t =1 A X a =1 n ta X i =1 K − 1 X k =1 ( Y tak ) i log( p ( k )) + (1 − k X j =1 ( Y taj ) i ) log (1 − p ( k )) = T X t =1 A X a =1 n ta X i =1 K − 1 X k =1 ( Y tak ) i α tak + ( X ta ) i Λ β ta − log (1 + e α tak +( X ta ) i Λ β ta ) − (1 − k X j =1 ( Y taj ) i ) log (1 + e α tak +( X ta ) i Λ β ta ) . When solving for Λ, holding all other parameters fixed, we again utilize the pro jected gradien t descen t algorithm with appropriate up dates for the gradient of Λ and the Armijo rule sho wn b elo w. The gradient of the log-likelihoo d with resp ect to Λ is ∆ Λ = ∂ l ∂ Λ = T X t =1 A X a =1 n ta X i =1 K − 1 X k =1 ( Y tak ) i 1 1 + e α tak +( X ta ) i Λ β ta ( X ta ) T i β T ta + (1 − k X j =1 ( Y taj ) i ) − e α tak +( X ta ) i Λ β ta 1 + e α tak +( X ta ) i Λ β ta ( X ta ) T i β T ta . T o guarantee a sufficien t decrease at each iteration and con vergence to a stationary point, the Armijo rule is used to select appropriate γ i at each iteration l (Λ ( i +1) , β ta | Y ta , X ta ) − l (Λ ( i ) , β ta | Y ta , X ta ) ≤ σ h ∆ Λ ( i ) , Λ ( i +1) − Λ ( i ) i , where σ ∈ (0 , 1) and h· , ·i is the sum of element wise pro ducts of t w o matrices. Sha wn Mankad and Shengli Hu Opera tions, Technology and Informa tion Management Cornell University Ithaca, NY 14850 E-mail: smank ad@cornell.edu E-mail: sh2264@cornell.edu Anandasiv am Gop al Dep ar tment of Decisions, Opera tions & Informa tion Technology University of Mar yland College P ark, MD 20910 E-mail: agopal@rhsmith.umd.edu
Original Paper
Loading high-quality paper...
Comments & Academic Discussion
Loading comments...
Leave a Comment