Crossing Behaviour of Social Groups: Insights from Observations at Non-signalized Intersection
Environmental, demographical and psychological factors have a demonstrated impact on risky crossing behaviour. In this work we focus on the potential influence of social factors on the considered phenomenon (i.e. group crossing decision). We present the results of a video-recorded observation about the crossing behaviour of singles and dyads at non-signalized intersections. Results showed that crossing behaviour is characterized by three distinct phases: (i) approaching, (ii) appraising (decision making) and (iii) crossing. Dyads walk slower than single pedestrians in all phases. The crossing behaviour of dyads is characterized by the emergence of a leader who takes the decision to cross first, followed by the companion. However, there is no difference between the accepted safety gap of singles and dyads. Understanding factors influencing the crossing decision of social groups represents an important result supporting the development of agent-based simulations of pedestrian-vehicle interactions.
💡 Research Summary
The paper investigates how social factors—specifically the presence of a familiar companion—affect pedestrian crossing behavior at a non‑signalized urban intersection. The authors recorded a 73‑minute video of a high‑risk crossing in Milan, Italy, and used a combination of manual coding (guided by a detailed checklist of locomotion and communication cues) and the open‑source Tracker video‑analysis tool to extract the X‑Y coordinates of pedestrians at 0.4‑second intervals.
From the total of 585 pedestrians observed, 65 % were single walkers, 26 % formed dyads (two‑person groups), 8 % were triples, and 1 % belonged to larger groups. Inter‑rater reliability for group identification was moderate (Cohen’s κ = 0.47). Vehicle traffic comprised 1,379 vehicles (≈19 veh/min), predominantly cars, moving equally in both directions. Level‑of‑Service (LOS) calculations indicated an average driver delay of 3.20 s and pedestrian delay of 1.29 s, corresponding to LOS A (free flow).
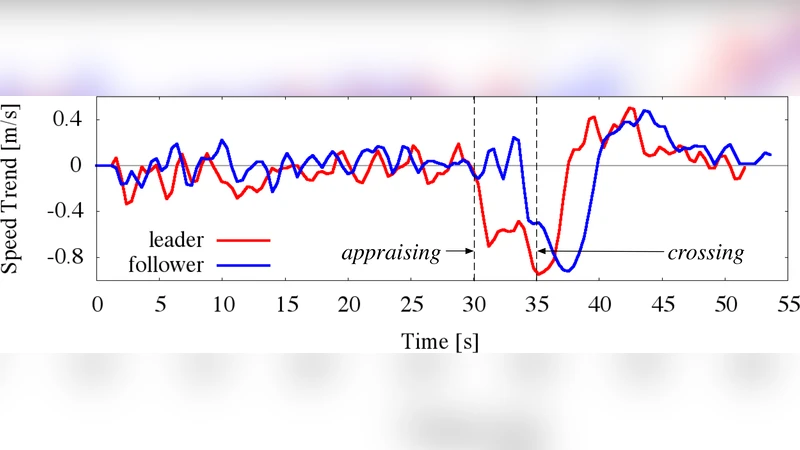
For a detailed kinematic analysis the authors selected 49 adult pedestrians (27 singles, 11 dyads) while avoiding confounding situations such as vehicle platooning or simultaneous crossing of multiple pedestrians. Speed trends were smoothed using a moving average (0.8 s window) and compared to the cumulative average to identify long‑term deceleration or acceleration phases. This methodology revealed three distinct crossing phases:
- Approaching – stable sidewalk speed.
- Appraising – deceleration to evaluate the distance and speed of oncoming vehicles (the “safety gap”).
- Crossing – re‑acceleration to traverse the street.
A two‑way ANOVA showed significant speed differences across phases (F(2,146)=66.98, p < 0.001) and between singles and dyads (F(1,146)=40.65, p < 0.001). Mean speeds (± SD) were:
- Approaching: singles 1.277 ± 0.182 m/s, dyads 1.123 ± 0.155 m/s.
- Appraising: singles 0.943 ± 0.214 m/s, dyads 0.702 ± 0.280 m/s.
- Crossing: singles 1.354 ± 0.181 m/s, dyads 1.127 ± 0.131 m/s.
Thus dyads moved roughly 17 % slower overall and decelerated about 11 % more during the appraising phase. Within dyads a leader‑follower pattern emerged: the leader completed the appraisal first and initiated crossing, while the follower began appraisal on average 1.055 s later and crossed 0.691 s later. However, speed differences between leaders and followers were not statistically significant (p > 0.05).
Safety‑gap analysis (time between the pedestrian’s decision to cross and the arrival of the nearest vehicle) yielded mean values of 3.982 s for singles, 4.355 s for leaders, and 4.242 s for followers, with no significant differences (p > 0.05). Likewise, the duration of the appraising phase did not differ significantly among the three groups. These findings suggest that, despite moving more slowly, dyads assess risk using the same temporal criteria as individuals.
The authors discuss the implications for agent‑based pedestrian‑vehicle interaction models. Incorporating a leader‑follower mechanism and distinct speed profiles for dyads can improve the realism of simulations, especially for non‑signalized crossings where group dynamics subtly influence flow. The lack of safety‑gap differences indicates that risk perception remains an individual‑level process even within small familiar groups.
Limitations include the modest sample size, focus solely on familiar dyads, and the exclusion of larger or unfamiliar groups. Future work is proposed to enlarge the dataset, examine non‑familiar groups, and explore how social imitation may lead to risky behaviors such as jaywalking outside marked crossings.
In conclusion, the study provides empirical evidence that at unsignalized intersections, pedestrians in dyads exhibit slower speeds across all crossing phases and display a clear leader‑follower structure, yet they adopt the same safety‑gap thresholds as solitary walkers. These insights are valuable for urban planners, traffic safety policymakers, and developers of pedestrian‑vehicle interaction simulators seeking to model heterogeneous pedestrian behavior more accurately.
Comments & Academic Discussion
Loading comments...
Leave a Comment