60 GHz Blockage Study Using Phased Arrays
The millimeter wave (mmWave) frequencies offer the potential for enormous capacity wireless links. However, designing robust communication systems at these frequencies requires that we understand the channel dynamics over both time and space: mmWave …
Authors: Christopher Slezak, Aditya Dhananjay, Sundeep Rangan
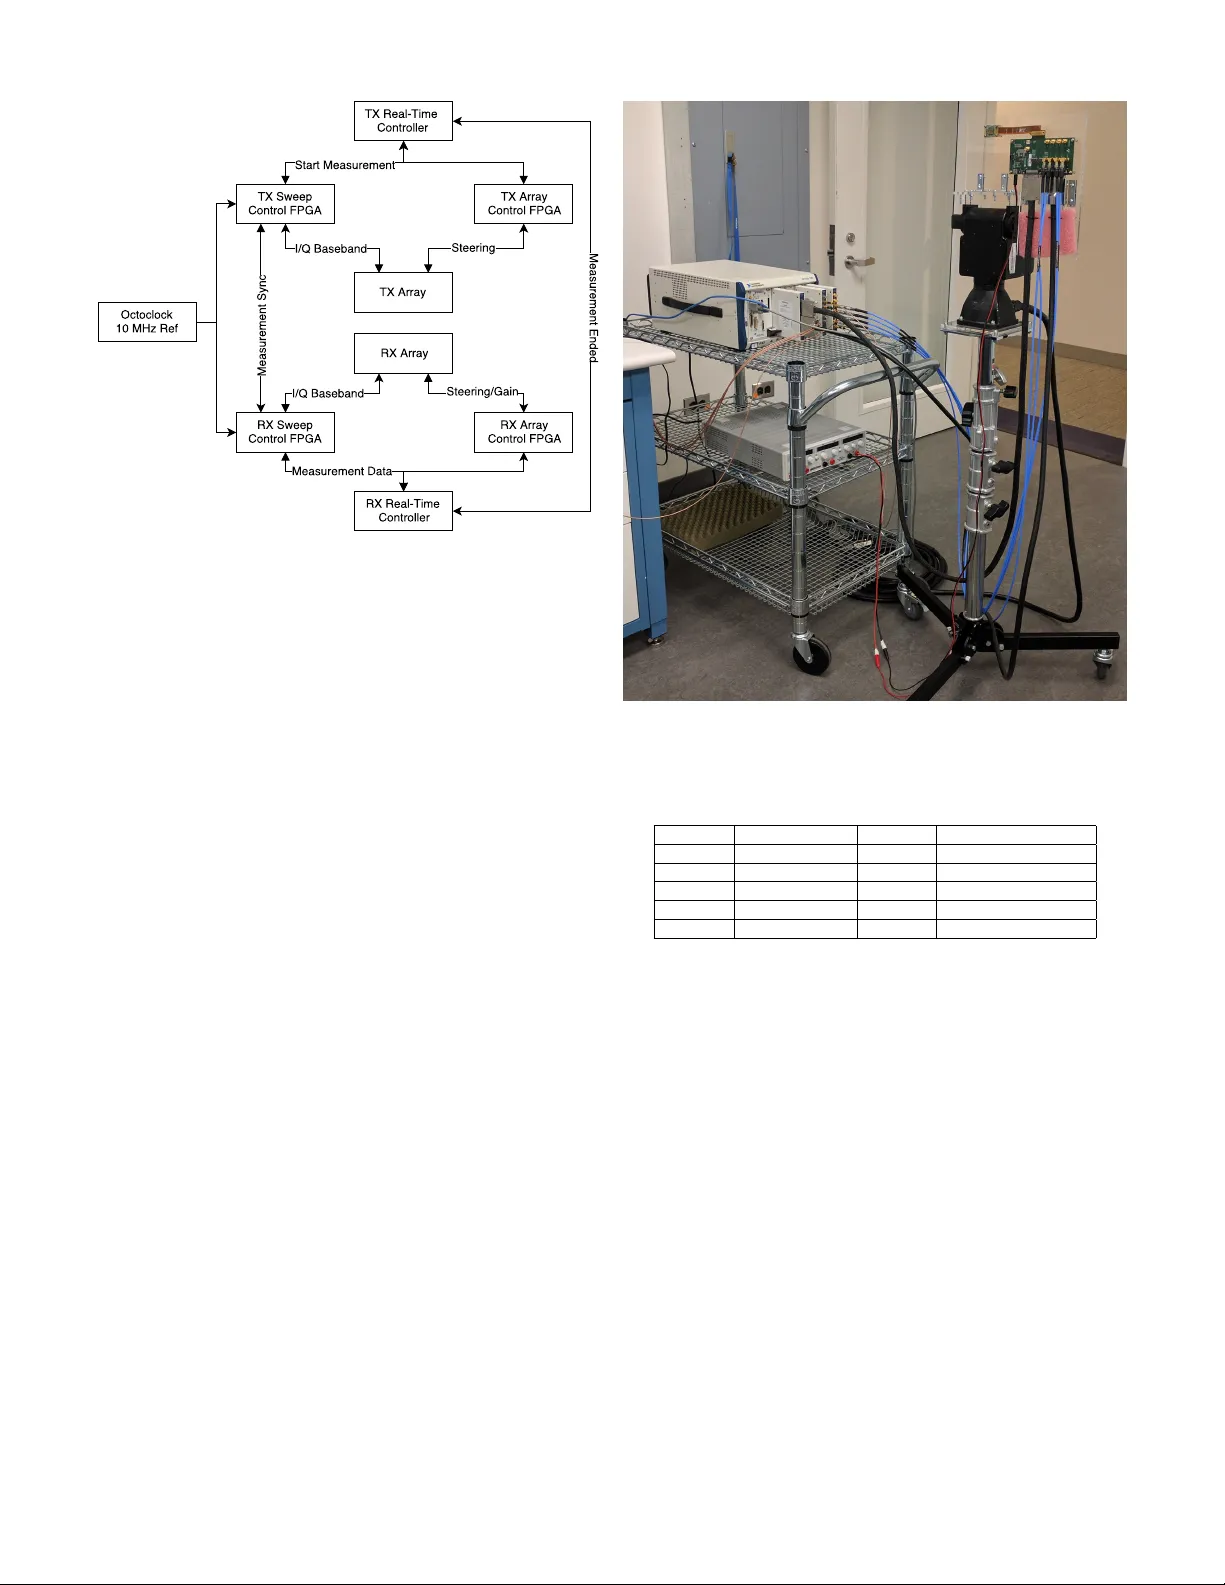
60 GHz Blockage Study Using Phased Arrays Christopher Slezak, Aditya Dhananjay , and Sundeep Rangan NYU T andon School of Engineering chris.slezak@nyu.edu, aditya@courant.n yu.edu, srangan@nyu.edu Abstract —The millimeter wav e (mmW av e) frequencies offer the potential for enormous capacity wir eless links. Howe ver , designing rob ust communication systems at these frequencies requir es that we understand the channel dynamics over both time and space: mmW ave signals ar e extremely vulnerable to blocking and the channel can thus rapidly appear and disappear with small movement of obstacles and r eflectors. In rich scattering en vironments, different paths may experience differ ent blocking trajectories and understanding these multi-path blocking dynam- ics is essential for developing and assessing beamforming and beam-tracking algorithms. This paper pr esents the design and experimental r esults of a novel measur ement system which uses phased arrays to perform mmW ave dynamic channel measure- ments. Specifically , human blockage and its effects acr oss multiple paths are in vestigated with only several microseconds between successive measurements. Fr om these measurements we develop a modeling technique which uses low-rank tensor factorization to separate the a vailable paths so that their joint statistics can be understood. Index T erms —Blockage, mmW ave, Dynamics, Phased Array , Parafac, Principal Component Analysis, T ensor Decomposition I . I N T RO D U C T I O N Millimeter wa ve (mmW a v e) frequencies (roughly abov e 10 GHz) have shown tremendous promise as an enabling technology for 5G [1], [2]. Ho wev er , unlike con ventional cellular communications below 6 GHz, mmW ave signals are highly susceptible to blockage from objects present in the en vironment such as metal shelves, brick walls, and ev en people. Hence, small movements of these objects can cause rapid v ariations in receiv ed po wer . These rapid variations can complicate the operation of the entire protocol stack, and designers of 5G systems will need models which accurately characterize these effects. Numerous procedures including channel estimation, channel quality tracking, beamforming, rate adaptation, handover and even congestion control all depend critically on the precise dynamics of these channels [3], [4]. W ith the growing interest in mmW av e, a number of studies hav e been performed to understand these dynamics better . These studies include models based on ray tracing [5], [6], SISO measurements with fixed antennas [7], [8], measure- ments from MIMO systems with a small number of antennas [9], and measurements using omnidirectional antennas [10]. A limitation of these previous measurement-based results is that they hav e been restricted to looking at a limited number of directions at a time since the y are based on small numbers of This work was supported in part by NSF grants 1302336, 1564142, and 1547332, NSA, NIST , and the af filiate members of NYU WIRELESS. Fig. 1. SiBeam 60 GHz phased array . T welve elements are activ e at a time. fixed antennas. In a rich scattering en vironment, it is possible that when one path is blocked, others may still be av ailable. Understanding the statistics ov er multiple spatial paths during blocking e vents is thus necessary to fully assess path di versity algorithms. In this paper , we present a novel measurement system that is capable of performing channel measurements over a large number of pointing angles almost simultaneously . These measurements allow us to jointly e xamine blockage across multiple paths that are present in the channel. T o aid in the modeling and interpretation of the measurement data, we propose an analysis technique which uses parallel factor analysis (P ARAF A C) to identify the distinct blockage trajectories that these multiple paths experience. I I . H A R D W A R E S E T U P The critical pieces of hardware enabling this system to be built are two SiBeam 60 GHz phased arrays shown in Fig. 1. These arrays hav e 12 steerable elements activ e when trans- mitting or receiving, and allo w the user to select an arbitrary steering vector which defines the direction of arriv al/departure of the array . The antennas are designed for a narrow fixed vertical beam of approximately ± 10 ◦ and steerable horizontal range of approximately ± 45 ◦ . The total antenna gain is 23 dBi. Applying a new steering vector to the array can be done in just a few microseconds which allows for measurements of the channel to be performed across dif ferent combinations of transmitter (TX) and recei ver (RX) pointing angles with very little time between measurements. These arrays are combined with a baseband system imple- mented using two (one each at the TX and RX) National In- struments PCI eXtenstions for Instrumentation (PXIe) chassis. Each chassis has multiple Field Programmable Gate Arrays Fig. 2. Block diagram of the measurement system. (FPGAs), Input/Output (I/O) modules, and a host computer running a real-time operating system. Fig. 2 shows a block diagram of the hardware configuration for the TX and RX. T iming synchronization is done using a common reference that is connected to both the TX and RX via a cable. Separate cables running between the tw o chassis allo w them to send and receiv e control signals during the course of the measurement. These cables limit the total separation that can be achiev ed between the TX and RX, but for indoor measurements this is not critical. A wideband sequence occupying 1 GHz of bandwidth at radio frequency (RF) is continuously generated at the TX chassis and sent to the TX array . The large bandwidth of this sequence gives a timing resolution of one nanosecond, crucial for indoor measurements where reflected copies of the transmitted sequence may be arriving with very small delays. No automatic gain control is implemented at the RX, so amplifier gain remains fixed throughout the measurement. This limits the dynamic range to 40 dB. I I I . M E A S U R E M E N T P RO C E D U R E At the beginning of a measurement, the TX applies one steering vector to its array , and the RX will cycle through its codebook containing 12 predefined steering vectors, acquiring a channel impulse response for each one. The TX will then advance to the next steering v ector in its codebook, and the RX will again acquire a channel impulse response for each of its 12 steering vectors. Follo wing this process, the TX and RX will measure the channel across 144 pointing angle combinations in less than one millisecond. This 144 pointing angle scan is repeated 1750 times with one scan performed e very 3 ms. Thus, a single measurement has a duration of slightly more than 5 seconds and consists of almost 5 million individual data Fig. 3. TX baseband and RF hardware. T ABLE I S U MM A RY O F M E A S UR E M E NT S CE NA R I O S Scenario Num. Blockers Rotation Num. Measurements 0 0 No 4 1 1 No 11 2 3 No 10 3 0 Y es 5 4 2 Y es 5 points. There is a buf fer period of 40 seconds as the data from this measurement is copied from FPGA memory to the hard disk of the chassis controller, and then the entire 5 second measurement process is repeated for se veral minutes until the desired number of measurements hav e been taken. The measurements were performed in a typical laboratory en vironment. Furniture included metal and wooden work- benches, office chairs, and metal shelving. A large metallic re- flector was also present in the en vironment to ensure sufficient path div ersity when validating the measurement system and associated analysis techniques. Blockage was studied under four different scenarios. In the first, a single person followed a random path through the room at a typical walking speed. In the second, three people walked through the lab follo wing similarly random paths. In the third scenario, the TX array was rotated ov er a range of ± 45 ◦ in the azimuth plane while there were no blockers present in the room. The angular velocity was not precisely controlled but care was taken to move approximately 90 ◦ ov er the course of a single measurement. 0.75 1.5 2.25 3 3.75 4.5 5.25 Time (s) 20 40 60 80 100 120 140 Pointing Angle Combination -18 -16 -14 -12 -10 -8 -6 -4 -2 0 Fig. 4. Receiv ed power over time with two blockage e vents. (Scenario 1) For the last scenario, the TX was rotated in the same way as before while two human blockers walked randomly through- out the room. This represents a very challenging situation to perform beam tracking/search. Measurements were also taken with no blockers present in order to understand the propagation en vironment of the room. T able I summarizes the four scenarios and lists the number of measurements done for each. I V . A N A L Y S I S T E C H N I Q U E S A N D R E S U L T S A. V isualizing Blocking Events The output of a single measurement can be thought of as a three-way tensor X where the element x τ j k represents delay τ of the complex channel impulse response (CIR) measured for pointing angle combination j during scan k . As described in Section III each CIR is N dly = 192 samples long, there are N dir = 144 point angle combinations per scan and each scan is performed N scan = 1750 times. This yields a tensor of size N dly × N dir × N scan . The rather large size of this tensor presents a challenge when analyzing and interpreting the results of the measurement. T o visualize the data, we can integrate the po wer delay profile (PDP) ov er τ to extract the receiv ed power po wer at pointing angle combination j and scan index k . This reduces X to a N dir × N scan matrix P with entry p j k giv en by p j k = N dly X τ =1 x τ j k 2 . (1) Fig. 4 shows an example of one such matrix taken from scenario 1 where two distinct blocking ev ents can be identified. The first blocking ev ent begins 3 seconds into the measurement with a duration of approximately 500 ms. The second blocking ev ent begins sev eral milliseconds later and lasts about 350 ms. Although this representation is con v enient for visual inspection of blocking events, it is not clear ho w this information can be used to dev elop a statistical model. 3 3.75 Time (s) 40 48 56 64 72 Delay (ns) -40 -35 -30 -25 -20 -15 -10 -5 0 Fig. 5. T ime Evolution of PDP for a fixed pointing angle combination. It is apparent that a single blocking e vent has an observ able effect on sev eral different pointing angle combinations. This is due to the presence of sidelobes in the array pattern and the relatively large beamwidth. Further , some pointing angle combinations have contributions from multiple paths present in the channel due to these effects. For example, Fig. 5 shows one second of PDPs acquired for a single pointing angle combination taken from the same measurement shown in Fig. 4. There are two large peaks present, the earlier peak is the line-of-sight (LOS) path and the second arriving peak is a strong reflected path. This highlights the fact that is not possible to select a single pointing angle combination, examine its receiv ed power over time and conclude that it describes blockage across a single path. Instead we propose a technique which decomposes the tensor X into a low-rank representation that identifies blockage on the dominant paths in the channel. B. Low-Rank Decomposition with T wo-W ay PCA A key observation about the measured data is that the underlying structure should be low-rank due to the small number of paths that are present in the channel [11]. One possible technique for identifying these dominant paths is principal component analysis (PCA). PCA is a data analysis method which has seen widespread use in a v ariety of fields. Mathematically , PCA is performed by taking the singular v alue decomposition (SVD) of a data matrix X . The SVD of a matrix is giv en by X = USV ∗ , (2) where U and V are unitary matrices and S is a diago- nal matrix whose diagonal entries are nonnegati ve quantities called the singular values of X [12]. Existence of the SVD is guaranteed and it is easily computed using standard linear algebra software packages. Use of this technique for our data is complicated by the fact that it is only defined for matrices but in this case the measurement data is in the form of a three- way tensor X . In this case we perform PCA by interleaving 0 10 20 30 40 50 Component -35 -30 -25 -20 -15 -10 -5 0 Power (dB) Fig. 6. Scree plot of the 50 largest principal components of X . all CIRs from a single scan together . This transforms X from a N dly × N dir × N scan three-way tensor to a N dly N dir × N scan matrix X (or equiv alently a two-way tensor). This analysis was performed for the same measurement shown in Fig. 4. A scree plot can be obtained by plotting the relati ve magnitudes of the diagonal elements of S and is shown in Fig. 6. As expected due to the low-rank nature of the channel, the scree plot is dominated by a fe w components which capture most of the variance in X . The gain trajectory of principal component k can be ob- tained from this f actorized form by multiplying the k th column of V by the k th element on the diagonal of S . Fig. 7 shows the gain trajectories of the three strongest principal components that were identified by this analysis, again done for the measurement sho wn in Fig. 4. It is clear from this plot that two-way PCA failed to achieve the desired result. Component 1 is much stronger than the others throughout the duration of the measurement, and in this single component it is possible to see drops in received power which correspond to both blocking ev ents that are visible in Fig. 4. An analysis technique which can properly exploit the underlying structure of the tensor X is needed. C. Low-Rank T ensor Decomposition with P ARAF A C The failure of the more well-known PCA technique moti- vates the use of a less widely used but powerful method called parallel factor analysis (P ARAF A C). P ARAF A C is a tensor decomposition technique which can be thought of as a gen- eralization of PCA and the SVD [13]. It has seen widespread use in fields such as psychometrics and chemometrics, as well as some use in the context of wireless communications [14] and array processing [15]. In this particular work we wish to represent X as a sum of rank-one tensors, with each of these rank-one tensors corresponding to a single path present in the channel. Each of these paths is described by a delay signature, spatial signature, and a gain trajectory over time. This maps very well to the P ARAF A C model, 0 0.75 1.5 2.25 3 3.75 4.5 5.25 Time (s) -35 -30 -25 -20 -15 -10 -5 0 5 Power (dB) Fig. 7. Gain trajectories obtained from two-way PCA. Fig. 8. Illustration of the P ARAF A C model [16]. X = L X ` =1 d ` ⊗ s ` ⊗ g ` + E , (3) where d ` , s ` , g ` are vectors which represent the delay sig- nature, spatial signature, and gain trajectory of the ` th path, respectiv ely , and E is a three-way tensor representing the residual. Conceptually this is illustrated in Fig. 8 which sho ws a three-way tensor written as the sum of two rank-one tensors. The simplicity of the P ARAF A C model is a major adv antage when compared to two-way PCA. Because the P ARAF AC model is more restricti ve than the two-way PCA model, it is able to more closely match the underlying structure of this data. In general for an I × J × K tensor , the L -component PCA solution will ha ve L ( I + J K ) free parameters when the tensor is unraveled into a matrix suitable for PCA. The P ARAF A C model on the other hand will have L ( I + J + K ) free parameters. If this simpler model is sufficient then the extra degrees of freedom in PCA will simply lead to modeling noise or redundancies in the data [16]. One drawback of P ARAF AC is the fact that it is computationally more in volv ed than two-way PCA. Computing the solution requires solving an optimization problem, typically using alternating least squares. For this work the implementation of P ARAF A C described in [17] was downloaded from the MA TLAB File Exchange and used to perform the decomposition. 0 0.75 1.5 2.25 3 3.75 4.5 5.25 Time (s) -35 -30 -25 -20 -15 -10 -5 0 5 Power (dB) Fig. 9. Gain trajectories obtained from P ARAF AC. Fig. 9 shows the gain trajectories for the P ARAF AC model ( L = 2 ) computed for the measurement data shown in Fig. 4. The P ARAF AC model performed substantially better than two-way PCA, and has succeeded in extracting blockage trajectories suitable for the development of a statistical model. V . C O N C L U S I O N S A N D F U RT H E R W O R K In this work we present the design of a system able to jointly measure blockage across multiple paths by rapidly and exhausti vely scanning across 144 pointing angle com- binations between the TX and RX. T o extract the blockage trajectories from the large three-way tensors produced by these measurements, we develop an analysis technique which uses P ARAF AC to construct a low-rank approximation of the measurement data. One av enue of future work is to further explore using this technique for more complicated scenarios, such as Fig. 10 which has blockage as well as rotation of the TX. Currently planned is a measurement campaign which will be done in a room that is more representative of a real- world scenario, rather than a laboratory environment as in this work. With the data from this campaign and the P ARAF A C techniques described in this paper, it is possible to move on to the second stage of modeling. In this second stage, we can decompose the trajectory powers of each path into small scale and large scale components and fit a piecewise linear model to the large scale components. From this model we can assign on a per-path basis states of unblocked, entering blocking, blocked, and exiting blocking. This data can then be used to create a statistical description of 60 GHz blockage. R E F E R E N C E S [1] T . S. Rappaport, S. Sun, R. Mayzus, H. Zhao, Y . Azar , K. W ang, G. N. W ong, J. K. Schulz, M. Samimi, and F . Gutierrez, “Millimeter wa ve mobile communications for 5G cellular: it will work!” IEEE Access , vol. 1, pp. 335–349, 2013. [2] S. Rangan, T . S. Rappaport, and E. Erkip, “Millimeter-wav e cellular wireless networks: potentials and challenges, ” Proc. IEEE , vol. 102, no. 3, pp. 366–385, 2014. 0.75 1.5 2.25 3 3.75 4.5 5.25 Time (s) 20 40 60 80 100 120 140 Pointing Angle Combination -20 -18 -16 -14 -12 -10 -8 -6 -4 -2 0 Fig. 10. Receiv ed power over time with human blockage and TX rotation. [3] M. Zhang, M. Mezzavilla, R. Ford, S. Rangan, S. Panwar , E. Mellios, D. Kong, A. Nix, and M. Zorzi, “T ransport layer performance in 5G mmW a ve cellular, ” in Pr oc. 2016 IEEE Conf. Comp. Commun. W orkshops (INFOCOM WKSHPS) , Apr. 2016, pp. 730–735. [4] M. Giordani, M. Mezzavilla, A. Dhananjay , S. Rangan, and M. Zorzi, “Channel dynamics and SNR tracking in millimeter wave cellular systems, ” in Pr oc. 2016 Eur . W ir eless Conf. , May 2016, pp. 1–8. [5] M. Jacob, S. Priebe, A. Maltse v , A. Lomayev , V . Erceg, and T . Kuerner , “ A ray tracing based stochastic human blockage model for the IEEE 802.11ad 60 GHz channel model, ” in Pr oc. 5th Eur . Conf. Antennas and Propa gation (EUCAP) , Apr. 2011, pp. 3084–3088. [6] P . A. Eliasi and S. Rangan, “Stochastic dynamic channel models for millimeter cellular systems, ” in Proc. IEEE Computational Advances in Multi-Sensor Adaptive Processing (CAMSAP) , 2015, pp. 209–212. [7] S. Collonge, G. Zaharia, and G. E. Zein, “Influence of the human acti vity on wide-band characteristics of the 60 GHz indoor radio channel, ” IEEE T r ans. W ir eless Commun. , v ol. 3, no. 6, pp. 2396–2406, Nov . 2004. [8] G. R. MacCartney , S. Deng, S. Sun, and T . S. Rappaport, “Millimeter- wav e human blockage at 73 GHz with a simple double knife-edge diffraction model and extension for directional antennas, ” in Pr oc. 2016 IEEE 84th V eh. T echnol. Conf. (VTC) , Sept. 2016, pp. 1–6. [9] M. Peter, M. W isotzki, M. Raceala-Motoc, W . Keusgen, R. Felbeck er , M. Jacob, S. Priebe, and T . Kuerner , “ Analyzing human body shadowing at 60 GHz: Systematic wideband MIMO measurements and modeling approaches, ” in Pr oc. 2012 6th Eur . Conf. Antennas and Propagation (EUCAP) , Mar . 2012, pp. 468–472. [10] R. J. W eiler, M. Peter, W . Keusgen, and M. Wisotzki, “Measuring the busy urban 60 GHz outdoor access radio channel, ” in Pr oc. 2014 IEEE Int. Conf. Ultra-W ideBand (ICUWB) , Sept. 2014, pp. 166–170. [11] P . A. Eliasi, S. Rangan, and T . S. Rappaport, “Low-rank spatial channel estimation for millimeter wav e cellular systems, ” IEEE T r ans. W ir eless Commun. , vol. 16, no. 5, pp. 2748–2759, May 2017. [12] J. Shlens, “ A tutorial on principal component analysis, ” CoRR , vol. abs/1404.1100, 2014. [13] T . G. Kolda and B. W . Bader, “T ensor decompositions and applications, ” SIAM Review , vol. 51, no. 3, pp. 455–500, 2009. [14] A. L. F . de Almeida, G. Favier , and J. a. C. M. Mota, “Parafac- based unified tensor modeling for wireless communication systems with application to blind multiuser equalization, ” Signal Pr ocess. , vol. 87, no. 2, pp. 337–351, Feb. 2007. [15] N. D. Sidiropoulos, R. Bro, and G. B. Giannakis, “Parallel factor analysis in sensor array processing, ” IEEE T rans. Sig. Pr ocess. , vol. 48, no. 8, pp. 2377–2388, Aug 2000. [16] R. Bro, “P ARAF A C. tutorial and applications, ” Chemometrics and Intelligent Laboratory Systems , vol. 38, no. 2, pp. 149 – 171, 1997. [17] C. A. Andersson and R. Bro, “The N-way toolbox for MA TLAB, ” Chemometrics and Intelligent Laboratory Systems , vol. 52, no. 1, pp. 1 – 4, 2000.
Original Paper
Loading high-quality paper...
Comments & Academic Discussion
Loading comments...
Leave a Comment