Data-driven generation of spatio-temporal routines in human mobility
The generation of realistic spatio-temporal trajectories of human mobility is of fundamental importance in a wide range of applications, such as the developing of protocols for mobile ad-hoc networks or what-if analysis in urban ecosystems. Current g…
Authors: Luca Pappalardo, Filippo Simini
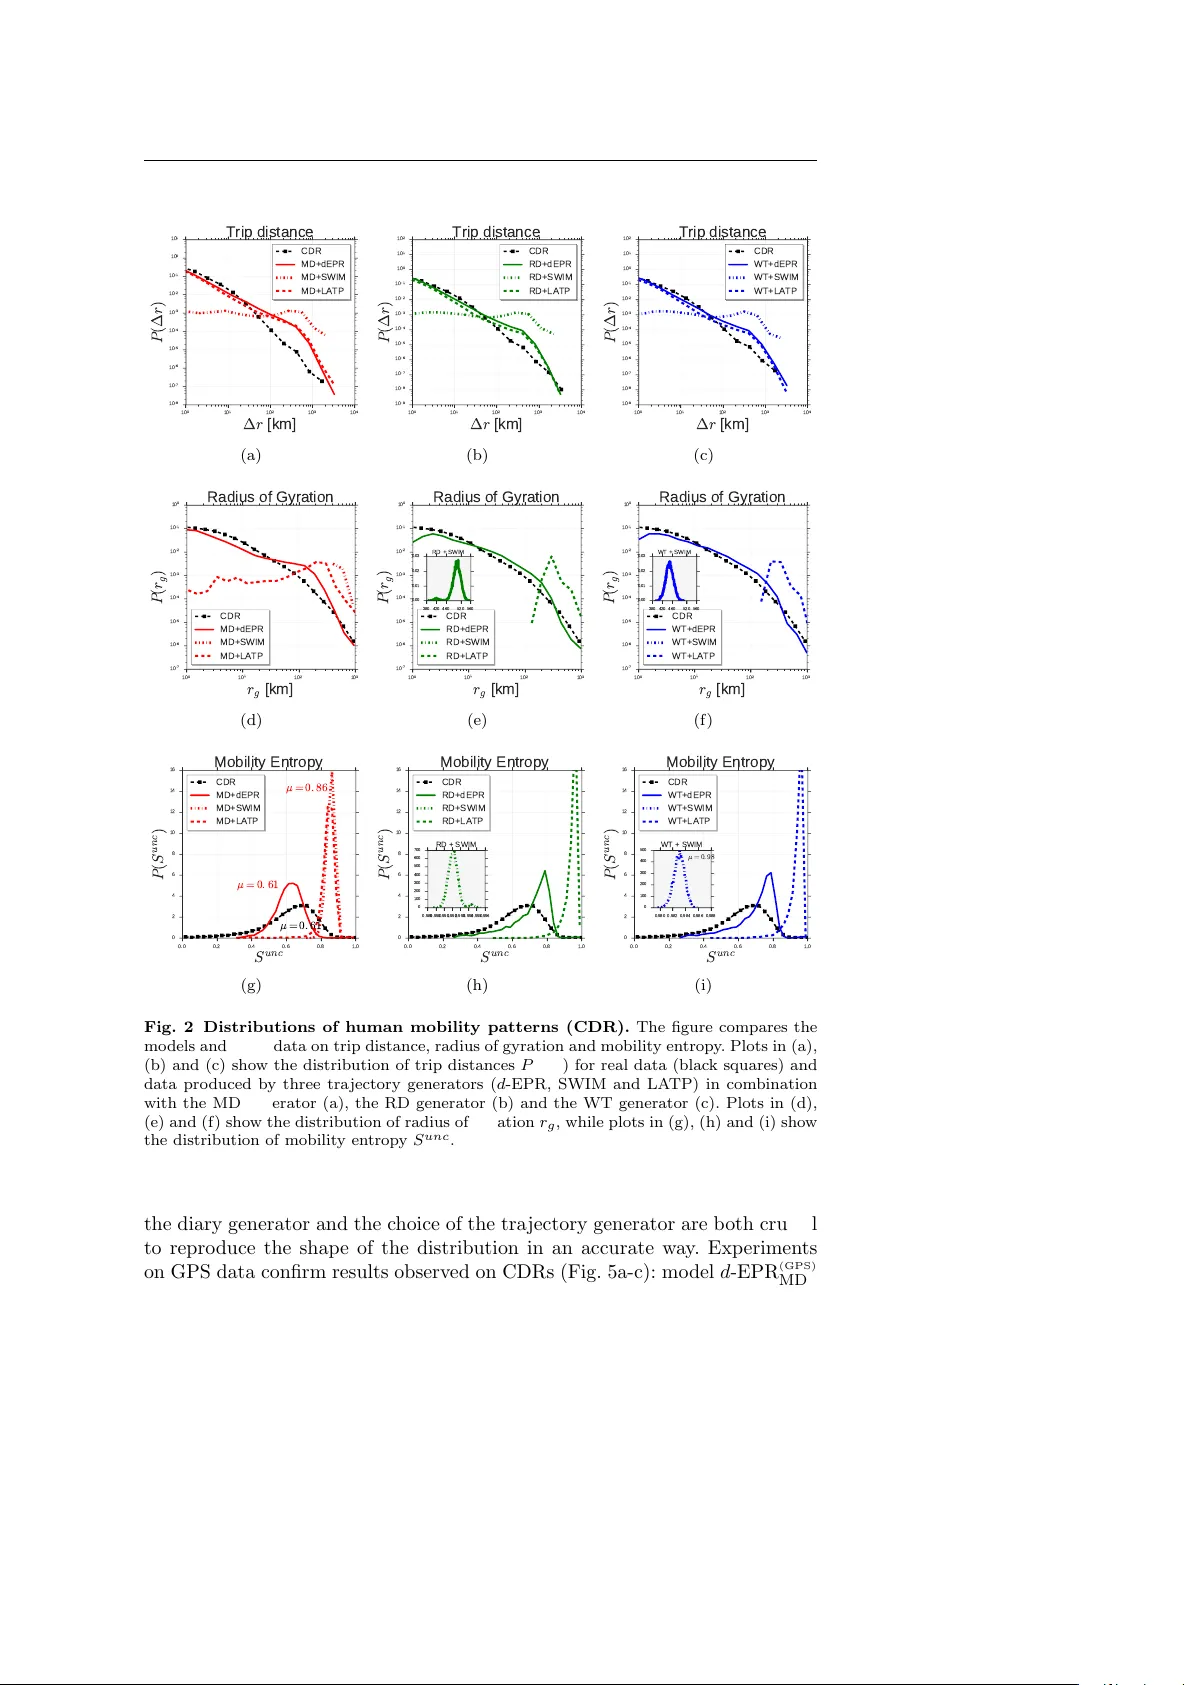
Data-driv en generation of spatio-temp oral routines in h uman mobilit y Luca P appalardo and Filipp o Simini Abstract The generation of realistic spatio-temp oral tra jectories of human mobilit y is of fundamen tal imp ortance in a wide range of applications, such as the dev eloping of proto cols for mobile ad-ho c net w orks or what-if analysis in urban ecosystems. Curren t generative algorithms fail in accurately reproduc- ing the individuals’ recurrent sc hedules and at the same time in accounting for the p ossibilit y that individuals may break the routine during p erio ds of v ariable duration. In this article w e present Ditras (DIary-based TRAjectory Sim ulator), a framework to simulate the spatio-temp oral patterns of h uman mobilit y . Ditras operates in tw o steps: the generation of a mobility diary and the translation of the mobility diary in to a mobilit y tra jectory . W e prop ose a data-driven algorithm which constructs a diary generator from real data, capturing the tendency of individuals to follow or break their routine. W e also prop ose a tra jectory generator based on the concept of preferen tial exploration and preferential return. W e instantiate Ditras with the prop osed diary and tra jectory generators and compare the resulting algorithm with real data and syn thetic data pro duced by other generativ e algorithms, built by instan tiating Ditras with sev eral com binations of diary and tra jectory generators. W e show that the prop osed algorithm repro duces the statistical prop erties of real tra- jectories in the most accurate wa y , making a step forw ard the understanding of the origin of the spatio-temp oral patterns of human mobilit y . Keyw ords Data Science · Human Mobility · Complex Systems · Mathemat- ical mo delling · Big Data · Spatiotemp oral data · Human dynamics · Urban dynamics · mobile phone data · GPS data · Smart Cities Luca P appalardo Department of Computer Science, Universit y of Pisa, Italy Institute of Information Sciences and T ec hnologies (ISTI), CNR, Italy E-mail: lpappalardo@di.unipi.it, luca.pappalardo@isti.cnr.it Filippo Simini Department of Engineering Mathematics, Universit y of Bristol, UK Institute of Information Sciences and T ec hnologies (ISTI), CNR, Italy E-mail: f.simini@bristol.ac.uk 2 Luca P appalardo and Filipp o Simini 1 Introduction Understanding the c omplex mechanisms gov erning human mobility is of fun- damen tal imp ortance in different contexts, from public health (Colizza et al., 2007; Lenormand et al., 2015) to official statistics (Marchetti et al., 2015; P appalardo et al., 2016b), urban planning (W ang et al., 2012; De Nadai et al., 2016) and transp ortation engineering (Janssens, 2013). In particular, human mobilit y mo delling has attracted a lot of interest in recen t y ears for tw o main reasons. On one side, it is crucial in the p erformance analysis of netw orking proto cols suc h as mobile ad ho c net works, where the displacemen ts of netw ork users are exploited to route and deliver the messages (Karamshuk et al., 2011; Hess et al., 2015). On the other side human mobility mo delling is crucial for urban simulation and what-if analysis (Meloni et al., 2011; Kopp et al., 2014), e.g., simulating changes in urban mobility after the construction of a new in- frastructure or when traumatic ev ents o ccur like epidemic diffusion, terrorist attac ks or international even ts. In b oth scenarios the developing of generative algorithms that repro duce human mobilit y patterns in an accurate wa y is fun- damen tal to design more efficient and suitable proto cols, as w ell as to design smarter and more sustainable infrastructures, economies, services and cities (Batt y et al., 2012; Kitchin, 2013). Clearly , the first step in hu man mobility mo delling is to understand how p eople mo ve. The a v ailability of big mobility data, such as massive traces from GPS devices (Pappalardo et al., 2013b), mobile phone net works (Gonz´ alez et al., 2008) and so cial media records (Spinsanti et al., 2013), offers now adays the p ossibilit y to observ e human mov emen ts at large scales and in great de- tail (Barb osa-Filho et al., 2017). Man y studies relied on this opportunity to pro vide a series of nov el insights on the quantitativ e spatio-temp oral patterns c haracterizing human mobilit y . These studies observe that human mobilit y is c haracterized by a stunning heterogeneit y of trav el patterns, i.e., a heavy tail distribution in trip distances (Bro c kmann et al., 2006; Gonz´ alez et al., 2008) and the characteristic distance trav eled by individuals, the so-called radius of gyration (Gonz´ alez et al., 2008; Pappalardo et al., 2015b). Moreov er h uman mobilit y is c haracterized by a high degree of predictability (Eagle and Pen t- land, 2009; Song et al., 2010b), a strong tendency to sp end most of the time in a few lo cations (Song et al., 2010a), and a prop ensity to visit specific lo cations at sp ecific times (Jiang et al., 2012; Rinzivillo et al., 2014). Building up on the ab o ve findings, man y generativ e algorithms of human mobilit y ha ve b een prop osed whic h try to repro duce the characteristic prop- erties of human mobilit y tra jectories (Karamshuk et al., 2011; Barb osa-Filho et al., 2017). The goal of generative algorithms of human mobility is to cre- ate a p opulation of agents whose mobility patterns are statistically indistin- guishable from those of real individuals. Typically each generative algorithm fo cuses on just a few prop erties of human mobility . A class of algorithms aims to realistically represen t spatial prop erties: they are mainly concerned with repro ducing the trip distance distribution (Bro ckmann et al., 2006; Gonz´ alez et al., 2008) or the visitation frequency to a set of preferred lo cations (Song Data-driven generation of spatio-temporal routines in h uman mobilit y 3 et al., 2010a; Pappalardo et al., 2015b). Another class of algorithms fo cus on the accurate representation of the time-v arying b eha vior of individuals, rely- ing on detailed sc hedules of h uman activities (Jiang et al., 2012; Rinzivillo et al., 2014). How ever, the ma jor challenge for generative algorithms lies in the creation of realistic temp oral patterns, in which v arious temporal statistics observ ed empirically are simultaneously repro duced, including the n um b er and sequence of visited lo cations together with the time and duration of the visits. In particular, the biggest h urdle consists in the simultaneous description of an individual’s routine and sp oradic mobility patterns. Curren tly there is no algorithm able to repro duce the individuals’ recurrent or quasi-p eriodic daily sc hedules, and at the same time to allow for the possibility that individuals ma y break the routine and mo dify their habits during perio ds of unpredictabil- it y of v ariable duration. In this w ork w e presen t Ditras (DIary-based TRAjectory Simulator), a framew ork to simulate the spatio-temp oral patterns of human mobility . The k ey idea of Ditras is to separate the temp oral c haracteristics of human mobil- it y from its spatial characteristics. In order to do that, Ditras operates in t wo steps. First, it generates a mobilit y diary using a diary generator. A mobility diary captures the temp oral patterns of human mobility b y sp ecifying the ar- riv al time and the time sp ent in each lo cation visited b y the individual. A diary generator is an algorithm which generates a mobility diary for an individual giv en a diary length. In this pap er we prop ose a data-driven algorithm called MDL (Mobility Diary Learner) which is able to infer from real mobility data a diary generator, MD, represented as a Marko v model. The Marko v mo del captures the prop ensit y of individuals to follow quasi-p eriodic daily schedules as well as to break the routine and mo dify their mobilit y habits. Second, Ditras transforms the mobilit y diary into a mobility tra jectory b y using prop er mechanisms for the exploration of lo cations on the mobility space, so capturing the spatial patterns of human mo vemen ts. The tra jectory generator w e prop ose, d -EPR, is based on previous research by the authors (P appalardo et al., 2015b, 2016a) and embeds mec hanisms to explore new lo cations and return to already visited lo cations. The exploration phase takes in to account b oth the distance b etw een lo cations and their relev ance on the mobilit y space, though taking into account the underlying urb an structure and the distribution of p opulation density . W e instantiate Ditras with the prop osed diary and tra jectory generators and compare it with nation-wide mobile phone data, region-wide GPS vehicu- lar data and syn thetic tra jectories produced by other generative algorithms on a set of nine different standard mobility measures. W e show that d -EPR MD , a generativ e algorithm created b y com bining diary generator MD with tra jectory generator d -EPR, simulates the spatio-temp oral prop erties of human mobility in a realistic manner, typically repro ducing the mobilit y patterns of real indi- viduals b etter than the other considered algorithms. Moreov er, we show that the distribution of standard mobility measures can b e accurately repro duced only by mo delling b oth the spatial and the temp oral asp ects of h uman mobil- it y . In other w ords, the spatial mec hanisms and the temporal mechanisms hav e 4 Luca P appalardo and Filipp o Simini to b e mo deled together by prop er diary and tra jectory generators in order to repro duce the observ ed human mobilit y patterns in an accurate w ay . The gen- erativ e algorithm we prop ose, d -EPR MD , captures both the spatial and the temp oral dimensions of human mobility and is a useful tool to develop more reliable protocols for ad ho c net works as w ell as to p erform realistic simulation and what-if scenarios in urban contexts. In summary this pap er pro vides the follo wing nov el contributions: – the mo deling framework Ditras whic h allo ws for the com binations of dif- feren t spatial and temp oral mechanisms of h uman mobilit y and whose code is freely av ailable ( https://github.com/jonpappalord/DITRAS ); – the data-driv en algorithm MDL to construct from real mobilit y data a diary generator (MD) which is realistic in repro ducing the temp oral patterns of h uman mobility; – a comparison of existing algorithms as w ell as algorithms resulting from no vel combinations of temp oral and spatial mec hanisms, on a set of nine mobilit y measures and t wo large-scale mobility datasets. Our mo deling framew ork go es tow ards a comprehensive approach whic h com- bines a netw ork science p erspective and a data mining p ersp ectiv e to improv e the accuracy and the realism of h uman mobility mo dels. This pap er is organized as follows. Section 2 revises the relev ant literature on human mobility modelling. In Section 3 w e present the structure of the Ditras framework. Section 4 describ es the first step of Ditras , the generation of the mobility diary , and in Section 4.1 we describe the mobility diary learner MDL and the Marko v mo del. Section 5 describ es the second step of Ditras , the generation of the mobility tra jectory , and in Section 5.1 w e prop ose a tra jectory generator called d -EPR. Section 6 shows the comparison b et w een an instan tiation of Ditras with the prop osed diary and tra jectory generators with real tra jectory data and the tra jectories pro duced b y other generative algorithms. In Section 6.4 we discuss the obtained results and, finally , Section 7 concludes the pap er. 2 Related W ork All the main studies in h uman mobilit y do cumen t a stunning heterogeneity of human trav el patterns that co exists with a high degree of predictabilit y: individuals exhibit a broad sp ectrum of mobilit y ranges while rep eating daily sc hedules dictated by routine (Giannotti et al., 2013). Bro c kmann et al. study the scaling laws of human mobility by observing the circulation of bank notes in United States, finding that trav el distances of bank notes follo w a p o wer- la w b eha vior (Bro ckmann et al., 2006). Gonz´ alez et al. analyze a nation-wide mobile phone dataset and find a large heterogeneity in human mobilit y ranges (Gonz´ alez et al., 2008): (i) trav el distances of individuals follow a p o wer-la w b eha vior, confirming the results b y Brockmann et al.; (ii) the radius of gyration of individuals, i.e., their characteristic trav eled distance, follows a pow er-law Data-driven generation of spatio-temporal routines in h uman mobilit y 5 b eha vior with an exp onen tial cutoff. Song et al. observe on mobile phone data that individuals are characterized by a p ow er-la w b eha vior in waiting times, i.e., the time b etw een a displacemen t and the next displacement b y an individ- ual (Song et al., 2010a). Pappalardo et al. find the same mobility patterns on a dataset storing the GPS traces of 150,000 priv ate vehicles trav eling during one month in T uscany , Italy (Pappalardo et al., 2013b). Song et al. study the en tropy of individuals’ mo v ements and find a high predictabilit y in h uman mobilit y , with a distribution of users’ predictability p eaked at appro ximately 93% and having a low er cutoff at 80% (Song et al., 2010b). Pappalardo et al. analyze mobile phone data and GPS tracks from priv ate vehicles and discov er that individuals split into tw o profiles, returners and explorers, with distinct mobilit y and geographical patterns (Pappalardo et al., 2015b). Sev eral stud- ies fo cus on the prediction of the kind of activit y asso ciated to individuals’ trips on the only basis of the observed displacements (Liao et al., 2007; Jiang et al., 2012; Rinzivillo et al., 2014), and to discov er geographic borders ac- cording to recurrent trips of priv ate vehicles (Rinzivillo et al., 2012; Thiemann et al., 2010), or to predict the formation of so cial ties (Cho et al., 2011; W ang et al., 2011). Other works demonstrate the connection b et ween human mobil- it y and so cial netw orks, highlighting that friendships and other types of so cial relations are significant drivers of human mov ements (Bro wn et al., 2013b; Hristo v a et al., 2016; W ang et al., 2011; V olk ovic h et al., 2012; Brown et al., 2013a; Hossmann et al., 2011a,b). Ho w to combine the discov ered patterns to create a generative algorithm that repro duces the salient asp ects of human mobility is an op en task. This task is particularly c hallenging b ecause generativ e algorithms should b e as simple, scalable and flexible as p ossible, since they are generally purp osed to large-scale simulation and what-if analysis. In the literature many generative algorithms hav e b een prop osed so far to mo del individual human mobilit y patterns (Karamshuk et al., 2011; Barb osa-Filho et al., 2017). Some algorithms try to repro duce the heterogeneity of individual human mobilit y and simu late how individuals visits lo cations. ORBIT (Ghosh et al., 2005) is an example of such algorithms. It splits in to t wo phases: (i) at the b eginning of the sim ulation it generates a predefined set of locations on a bi-dimensional space; (ii) then every synthetic individual selects a subset of these lo cations and mov es b etw een them according to a Marko v chain. In the Mark ov chain every state represen ts a sp ecific location in the scenario and prop er probability of transitions guaran tee a realistic distribution of lo cation frequencies. SLA W (Self-similar Least-Action W alk) pro duces mobility traces ha ving sp ecific statistical features observ ed on human mobilit y data, namely p o w er-law waiting times and tra vel distances with a heavy-tail distribution (Lee et al., 2012, 2009). In a first step SLA W generates a set of lo cations on a bi-dimensional space so that the distance among them features a heavy-tailed distribution. Then, a synthetic individual starts a trip by randomly choosing a lo cation as starting p oin t and making mo vemen t decisions based on the LA TP (Least-Action T rip Planning) algorithm. In LA TP ev ery lo cation has a probabilit y to b e chosen as next lo cation that decreases with the p o w er-law of 6 Luca P appalardo and Filipp o Simini the distance to the syn thetic individual’s curren t location. SLA W is used in sev eral studies of net working and h uman mobilit y modelling and is the base for other generative algorithms for h uman mobilit y , such as SMOOTH (Munjal et al., 2011), MSLA W (Sch w amborn and Aschen bruck, 2013) and TP (Solmaz et al., 2015, 2012). SWIM (Small W orld In Motion) is based on the concept of lo cation prefer- ence (Kosta et al., 2010). First, eac h syn thetic individual is assigned to a home lo cation, which is chosen uniformly at random on a bi-dimensional space. Then the synthetic individual selects a destination for the next mo ve dep ending of the w eight of each lo cation, which grows with the p opularit y of the lo cation and decreases with the distance from the home lo cation. The p opularit y of a lo cation dep ends on a collective preference calculated as the n umber of other p eople encountered the last time the synthetic individual visited the lo cation. Another category of generative algorithms combine notions ab out th e so cialit y of individuals with mobility patterns to define so cio-mobilit y mo dels, demon- strating how they can b e exploited to design more realistic proto cols for ad ho c and opp ortunistic netw orks (Borrel et al., 2009; Y ang et al., 2010; Fischer et al., 2010; Boldrini and Passarella, 2010; Musolesi and Mascolo, 2007). In contrast with man y generative algorithms of human mobilit y , the Ex- ploration and Preferential Return (EPR) model do es not fix in adv ance the n umber of visited lo cations on a bi-dimensional space but let them emerge sp on taneously (Song et al., 2010a). The mo del exploits tw o basic mechanisms that together describe human mobility: exploration and preferen tial return. Exploration is a random walk pro cess with a truncated p ow er-law jump size distribution (Song et al., 2010a). Preferential return repro duces the prop ensit y of humans to return to the lo cations they visited frequently b efore (Gonz´ alez et al., 2008). A synthetic individual in the mo del selects betw een these t wo mec hanisms: with a giv en probability the syn thetic individual returns to one of the previously visited places, with the preference for a location prop ortional to the frequency of the individual’s previous visits. With complemen tary prob- abilit y the synthetic individual mov es to a new lo cation, whose distance from the current one is chosen from the truncated p ow er-law distribution of trav el distances as measured on empirical data (Gonz´ alez et al., 2008). The proba- bilit y to explore decreases as the n umber of visited lo cations increases and, as a result, the mo del has a w armup p eriod of greedy exploration, while in the long run individuals mainly mov e around a set of previously visited places. Recen tly the EPR mo del has b een improv ed in different directions, such as b y adding information ab out the recency of lo cation visits during the preferential return step (Barb osa et al., 2015), or adding a preferential exploration step to accoun t for the collective preference for locations and the returners and ex- plorers dichotom y , as the authors of this pap er hav e done in previous research b y defining the d -EPR mo del (Pappalardo et al., 2015b, 2016a). It is worth noting that although the algorithms described abov e are able to repro duce accurately the heterogeneity of mobility patterns, none of them can repro duce realistic temp oral patterns of human mov ements. Data-driven generation of spatio-temporal routines in h uman mobilit y 7 Recen t research on h uman mobilit y show that individuals are character- ized b y a high regularit y and the tendency to come bac k to the same few lo cations ov er and o ver at sp ecific times (Gonz´ alez et al., 2008; Pappalardo et al., 2013b). T emp oral mo dels fo cus on these temp oral patterns and try to repro duce accurately h uman daily activities, sc hedules and regularities. Zheng et al. (Zheng et al., 2010) use data from a national surv ey in the US to ex- tract realistic distribution of address type, activity t yp e, visiting time and p opulation heterogeneity in terms of o ccupation. They first describe streets and a ven ues on a bi-dimensional space as horizontal and vertical lines with random length, and then use the Dijkstra’s algorithm to find the shortest path b et ween t wo activities taking into accoun t different speed limits assigned to each street. WDM (W orking Day Mov ement) distinguishes b et ween inter- building and in tra-building mo vemen ts (Ekman et al., 2008). It consists of sev eral submo dels to describ e mobility in home, office, evening and different transp ortation means. F or example a home mo del repro duces a so journ in a particular p oin t of a home lo cation while an office mo del repro duces a star- lik e tra jectory pattern around the desk of an individual at sp ecific co ordinates inside an office building. Although Zheng et al.’s algorithm and WDM provide an extremely thorough representations of human mo v ements in particular sce- narios, they suffer t wo main dra wbacks: (i) they represent sp ecific scenarios and their applicability to other scenarios is not guaranteed; (ii) they are to o complex for analytical tractability; (iii) they generally fail in capturing some global mobility patterns observed in individual h uman mobilit y , e.g., the distri- bution of radius of gyration. A recent study (McInerney et al., 2013) prop oses metho ds to identify and predict departures from routine in individual mo- bilit y using information-theoretic metrics, such as the instantaneous entrop y , and developing a Bay esian framew ork that explicitly mo dels the tendency of individuals to break from routine. Position of our work. F rom the literature it clearly emerges that existing gen- erativ e algorithms for human mobilit y are not able to accurately capture at the same time the heterogeneity of human trav el patterns and the temp oral regularit y of human mov emen ts. On the one hand exploration mo dels accu- rately repro duce the heterogeneity of human mobility but do not account for regularities in human temp oral patterns. On the other hand temp oral mo dels accurately repro duce h uman mobility schedules pa ying the price in complex- it y , but fail in capturing some imp ortan t global mobilit y patterns observ ed in h uman mobility . In this pap er w e try to fill this gap and prop ose d -EPR MD , a scalable generative algorithm that creates syn thetic individual tra jectories able to capture b oth the heterogeneit y of h uman mobility and the regular- it y of human mov ements. Despite its great flexibility , d -EPR MD is to a large exten t analytically tractable and several statistics ab out the visits to routine and non-routine lo cations can b e derived mathematically . In fact, since the temp oral mec hanism of d -EPR MD is based on a Marko v c hain, using standard results in probabilit y theory one can compute v arious quan tities, including the probability to go b et ween any tw o states in a given num b er of steps, the 8 Luca P appalardo and Filipp o Simini a verage num b er of visits to a state b efore visiting another state, the av erage time to go from one state to another and the probabilit y to visit one state b efore another. Moreo ver the spatial mechanism of d -EPR MD is based on the EPR mo del for which v arious analytical results, such as the distributions of the radii of gyration and of the lo cation frequencies, hav e b een derived (Song et al., 2010a). The data-driven algorithm MDL (Mobilit y Diary Learner), is another nov el contribution of this pap er. MDL infers from real mobility data a diary generator for realistic mobility diaries. It is highly adaptive and can b e applied to differen t geographic areas and different types of mobility data. The mo delling framew ork w e prop ose, Ditras , can generate syn thetic mo- bilit y tra jectories and can b e easily integrated in transp ortation forecast mo d- els to infer trip demand. Our approach has some similarit y with activit y-based mo dels (Bellemans et al., 2010), as they b oth aim to estimate trip demand by repro ducing realistic individual temp oral patterns, how ev er there are imp or- tan t differences betw een the tw o approac hes. In fact, while the goal of activity- based mo dels is to pro duce detailed agendas filled with activities performed b y the agen ts and are calibrated on surv eys with a limited n umber of par- ticipan ts, our framew ork produces mobilit y diaries con taining the time and duration of the visits in the v arious lo cations without explicitly sp ecifying the t yp e of activit y p erformed there, and is calibrated on a large population of mobile phone users. A recent pap er introduces TimeGeo, a mo delling framework to generate a p opulation of synthetic agents with realistic spatio-temp oral tra jectories (Y ang et al., 2016). Similarly to the mo delling framework presented here, TimeGeo com bines a Marko v mo del to generate temp oral patterns with the correct p e- rio dicit y and duration of visits, with a model to reproduce spatial patterns with the characteristic num b er of visits and distribution of distances. Alb eit ha ving similar aims, there are imp ortan t differences b etw een our modelling ap- proac h and TimeGeo’s. In fact, while TimeGeo prop oses a parsimonious mo del whic h is based on few tunable parameters and is to some extent analytically tractable, the approach prop osed in this pap er is mark edly data driven and parameter-free, with a greater level of complexit y which ensures the necessary flexibilit y to repro duce realistic temp oral patterns. 3 The DITRAS mo delling framew ork Ditras is a mo delling framework to simulate the spatio-temp oral patterns of h uman mobility in a realistic wa y . 1 The key idea of Ditras is to separate the temp oral characteristics of human mobility from its spatial characteristics. F or this reason, Ditras consists of tw o main phases (Fig. 1): first, it generates a mobilit y diary which captures the temp oral patterns of human mobility; second it transforms the mobilit y diary in to a sampled mobilit y tra jectory 1 The Python code of Ditras is freely a v ailable for do wnload on a public GitHub rep osi- tory: https://github.com/jonpappalord/DITRAS Data-driven generation of spatio-temporal routines in h uman mobilit y 9 whic h captures the spatial patterns of human mov emen ts. In this section w e define the main concepts which constitute the mechanism of Ditras . d -EPR% MD%% % D " L% W% mobility%diary %% weighted%spa:al% tessella:on% typical %% mobility%diary% sampled% mobility %% trajectory% S" 1|00|11|00|0|1 … (x 1 , y 1 ), (x 2 , y 2 ) … S = <(x 2 , y 2, t 1 ), (x 3 , y 3, t 2 ), (x 1 , y 1, t 3 ), (x 1 , y 1, t 4 ), … > (t)% (t)% 1 2 diary %generator% traj .%generator% Fig. 1 Outline of the DITRAS framework. Ditras com bines t wo probabilistic models: a diary generator (e.g., MD ( t ) ) and tra jectory generator (e.g., d -EPR). The diary generator uses a t ypical diary W ( t ) to pro duce a mobilit y diary D . The mobility diary D is the input of the tra jectory generator together with a weigh ted spatial tessellation of the territory L . F rom D and L the tra jectory generator produces a sampled mobility tra jectory S . The output of a Ditras sim ulation is a sampled mobility tra jectory for a synthetic individual. A mobilit y tra jectory describ es the mo vemen t of an ob ject as a sequence of time-stamp ed lo cations. The lo cation is describ ed by t wo co ordinates, usually a latitude-longitude pair or ordinary Cartesian co or- dinates, as formally stated by the following definition: Definition 1 (Mobilit y tra jectory) A mobilit y tra jectory is a sequence of triples T = h ( x 1 , y 1 , t 1 ) , . . . , ( x n , y n , t n ) i , where t i ( i = 1 , . . . , n ) is a times- tamp, ∀ 1 ≤ i f ( C ), i.e., B has the highest ov erall visitation frequency . It is w orth noting that the c hoice of the duration of the time slot, t , is crucial and depends on the sp ecific kind of mobilit y tra jectory data used. GPS data from priv ate vehicles, for example, generally pro vide accurate information ab out the location of the vehicle every few seconds. In this scenario, a time slot duration of one minute can b e a reasonable choice. In contrast when dealing with mobile phone data a time slot duration of an hour or half an hour is a more reliable choice, since the ma jorit y of individuals ha ve a lo w call frequency during the day (Pappalardo et al., 2015b). 4.1.2 Markov mo del tr ansition pr ob abilities Let A u = h a ( u ) 0 , . . . , a ( u ) n − 1 i and W u = h w ( u ) 0 , . . . , w ( u ) n − 1 i b e the abstract mobility tra jectory and the typical mobility diary of individual u ∈ U , where U is the set of all individuals in the data – w e omit the superscript ( t ) for clarity . Elements a ( u ) h ∈ A u and w ( u ) h ∈ W u denote the abstract and the typical lo cations visited b y individual u at time slot h with h = 0 , . . . , N − 1. A state in the Mark ov mo del MD is a tuple of tw o elements s = ( h, R ). The state’s first elemen t, h , is the time slot of the time series denoted by an integer b et ween 0 and N − 1. The state’s second element, R , is a bo olean v ariable that is 1 (T rue) if at time slot h the individual is in her t ypical lo cation, w ( u ) h , and 0 (F alse) otherwise – just like in the mobility diary . In total there are N × 2 = 2 N p ossible states in the mo del. The transition matrix, MD, is a 2 N × 2 N sto c hastic matrix whose element MD ss 0 corresp onds to the conditional probabilit y of a transition from state s to state s 0 , MD ss 0 ≡ p ( s 0 | s ). The normalization condition imp oses that the sum o ver all elemen ts of an y ro w s is equal to 1, P s 0 MD ss 0 = 1 , ∀ s . W e consider t wo types of transitions, s → s 0 , dep ending on whether in state s the individual is in typical lo cation or not: 14 Luca P appalardo and Filipp o Simini – if the individual is in the t ypical loc ation at time slot h , i.e., s = ( h, 1), then she can either go to the next t ypical lo cation at time slot h + 1, s = ( h, 1) → s 0 = ( h + 1 , 1), or go to a non-typical lo cation and stay there for τ time slots, s = ( h, 1) → s 0 = ( h + τ , 0); – if instead the individual is not in the typical lo cation at time slot h , i.e., s = ( h, 0), then she can either go to the typical lo cation at time slot h + 1, s = ( h, 0) → s 0 = ( h + 1 , 1), or go to a different non-typical lo cation and sta y there for τ time slots, s = ( h, 0) → s 0 = ( h + τ , 0). The form ulae to compute the empirical frequencies for the four t yp es of transitions are shown in T able 1. In the table, δ u x ( a ) = δ ( a ( u ) x , w ( u ) x ), ˆ δ u x ( a ) = δ ( a ( u ) x , a ( u ) x +1 ), where δ ( i, j ) = 1 if i = j and 0 otherwise, is the Kronec k er delta. By conv ention, the pro duct Q τ − 1 i =1 . . . is equal to 1 if τ = 1. T ransition, s → s 0 F requency , MD ss 0 ( h, 1) → ( h + 1 , 1) P u ∈ U P a ∈ A u δ u h ( a ) δ u h +1 ( a ) P u ∈ U P a ∈ A u δ u h ( a ) ( h, 1) → ( h + τ , 0) P u ∈ U P a ∈ A u δ u h ( a )[1 − δ u h +1 ( a )] Q τ − 1 i =1 ˆ δ u h + i ( a )[1 − ˆ δ u h + τ ( a )] P u ∈ U P a ∈ A u δ u h ( a ) ( h, 0) → ( h + 1 , 1) P u ∈ U P a ∈ A u [1 − δ u h ( a )] δ u h +1 ( a ) P u ∈ U P a ∈ A u [1 − δ u h ( a )] ( h, 0) → ( h + τ , 0) P d ∈ D [1 − δ u h ( a )][1 − δ u h +1 ( a )][1 − ˆ δ u h ( a )] Q τ − 1 i =1 ˆ δ u h + i ( a )[1 − ˆ δ u h + τ ( a )] P u ∈ U P a ∈ A u [1 − δ u h ( a )] T able 1: F ormulae to compute the transition probabilities of the Mark ov chain MD from abstract mobility tra jectories. 5 Step 2: Generation of sampled mobility tra jectory Starting from the mobilit y diary D ( t ) , the sampled mobilit y tra jectory S ( t ) is generated to describ e the mo vemen t of a synthetic individual b et w een a set of discrete locations called weigh ted spatial tessellation. A w eighted spatial tessellation is a partition of a bi-dimensional space into lo cations each having a weigh t corresp onding to its relev ance. Definition 6 (W eigh ted spatial tessellation) A weigh ted spatial tessella- tion is a set of tuples L = { ( l 1 , r 1 ) , . . . , ( l m , r m ) } , where r j ∈ N ( j = 1 , . . . , m ) is the relev ance of a lo cation and the l j are a set of non-ov erlapping p olygons that cov er the bi-dimensional space where individuals can mo ve. The lo cation of each p olygon is iden tified by the co ordinates of its cen troid, ( x j , y j ). The weigh ted spatial tessellation indicates the p ossible physical lo cations on a finite bi-dimensional space a syn thetic individual can visit during the sim ulation. The relev ance of a location measures its p opularit y among real Data-driven generation of spatio-temporal routines in h uman mobilit y 15 individuals: lo cations of high relev ance are the ones most frequen tly visited by the individuals (Pappalardo et al., 2015b, 2016a). The relev ance is in tro duced to generate synthetic tra jectories that take into account the underlying urban structure. An example of weigh ted spatial tessellation is the one defined by a set of mobile phone tow ers, where the relev ance of a tow er can b e estimated as the num b er of calls p erformed by mobile phone users during a p erio d of obser- v ation, and the p olygons corresp ond to the regions obtained from the V oronoi partition induced b y the tow ers. If information ab out location relev ance is not av ailable to the user of the simulator, the distribution of p opulation can b e used to estimate the relev ance of the lo cations. F or example, the websites http://sedac.ciesin.columbia.edu/ and http://www.worldpop.org.uk/ pro vide a fine-grained spatial tessellation for the en tire globe, together with an estimate of p opulation density in every lo cation. First, Ditras assigns to ev ery abstract location in the typical mobility diary W ( t ) a physical lo cation on the weigh ted s patial tessellation L , creating W ( t ) m , a t ypical mobility diary where each abstract lo cation has a sp ecific ge- ographic p osition (Algorithm 1, line 4, pro cedure assignLocationsTo ). The geographic p osition of an abstract lo cation is chosen according to the distri- bution of lo cation relev ance sp ecified in the spatial tessellation, i.e., the more relev ant a location is the more lik ely it is chosen as a geographic p osition of an abstract lo cation. This choice ensures the generation of synthetic data with a realistic distribution of locations across the territory (Pappalardo et al., 2016a). Next, Ditras scans D ( t ) to assign a physical lo cation to every en try . F or ev ery entry D ( t ) ( i ) ∈ D ( t ) w e hav e tw o p ossible scenarios: – D ( t ) ( i ) = 1, the entry indicates a visit to a typical lo cation, i.e., the abstract lo cation in W ( t ) ( i ) (Algorithm 1, line 12). In this scenario the syn thetic individual visits lo cation l = W ( t ) m ( i ) which is added to the sampled tra- jectory at time slot i , i.e. S ( t ) ( i ) = W ( t ) m ( i ) (Algorithm 1, lines 14); – D ( t ) ( i ) = 0, the en try indicates a visit to a non-t ypical location (Algorithm 1, line 17). In this second scenario Ditras calls the tra jectory generator to choose a lo cation l to visit, where l 6 = W ( t ) m ( i ) (Algorithm 1, lines 19). The chosen lo cation l is added to the sampled mobility tra jectory k times, where k is the num b er of consecutive 0 c haracters before the next separator c haracter ‘ | ’ app ears in D ( t ) , i.e., the total num b er of time slots sp en t in lo cation l (Algorithm 1, lines 23-27). Example of tr aje ctory gener ation. T o clarify how the second step of Ditras w orks let us consider the follo wing example. A syn thetic individual is as- signed a mobility diary D ( t ) = h 1 | 00 | 1 i and the chosen typical diary is W ( t ) = h w , w , w , w i , where w denotes the individual’s home. T o generate a synthetic sampled mobility tra jectory S , Ditras op erates as follo ws. First, Ditras assigns a physical location to the individual’s home w , generating W ( t ) m = h ( x 1 , y 1 ) , ( x 1 , y 1 ) , ( x 1 , y 1 ) , ( x 1 , y 1 ) i . Next, Ditras starts from the first en try D ( t ) (1). Since D ( t ) (1) = 1 the syn thetic individual is at home. Therefore, 16 Luca P appalardo and Filipp o Simini tuple ( x 1 , y 1 , 1) is added to tra jectory S . Next, Ditras pro cesses the sec- ond entry D ( t ) (2), sees a separator and then pro ceeds to entry D ( t ) (3). Since D ( t ) (3) = 0, the synthetic individual is not at home in the third time slot. Hence, Ditras calls a tra jectory generator (e.g., d -EPR) whic h chooses to visit physical lo cation ( x 2 , y 2 ). Ditras hence adds the tuples ( x 2 , y 2 , 2) and ( x 2 , y 2 , 3) to tra jectory S , since there tw o 0 c haracters until the next separa- tor in D ( t ) . The last entry D ( t ) (6) = 1 indicates that the synthetic individual returns home in the fourth time slot. So, Ditras adds tuple ( x 1 , y 1 , 4) to tra jectory S . A t the end of the execution, the sampled mobility tra jectory generated by Ditras is S = h ( x 1 , y 1 , 1) , ( x 2 , y 2 , 2) , ( x 2 , y 2 , 3) , ( x 1 , y 1 , 4) i . 5.1 The d -EPR mo del As tra jectory generator we prop ose the d -EPR individual mobility mo del (Pap- palardo et al., 2015b, 2016a) that assigns a lo cation on the bi-dimensional space to an entry in mobility diary D ( t ) . The d -EPR (density-Exploration and Pref- eren tial Return) is based on the evidence that an individual is more likely to visit relev ant lo cations than non-relev an t lo cations (P appalardo et al., 2015b, 2016a). F or this reason d -EPR incorp orates tw o comp eting mec hanisms, one driv en by an individual force (preferen tial return) and the other driv en by a collectiv e force (preferential exploration). The intuition underlying the mo del can b e easily understo od: when an individual returns, she is attracted to pre- viously visited places with a force that depends on the relev ance of suc h places at an individual lev el. In contrast, when an individual explores she is attracted to new places with a force that dep ends on the relev ance of such places at a collectiv e level. In the preferential exploration phase a synthetic individual se- lects a new lo cation to visit dep ending on b oth its distance from the curren t lo cation, as w ell as its relev ance measured as the collective location’s relev ance in the bi-dimensional space. In the mo del, hence, the synthetic individual fol- lo ws a p ersonal preference when returning and a collective preference when exploring. The d -EPR uses the gra vity mo del (Zipf, 1946; Jung et al., 2008; Lenormand et al., 2016) to assign the probabilit y of a trip b etw een an y tw o lo cations in L , which automatically constrains individuals within a territory’s b oundaries. The usage of the gravit y mo del is justified by the accuracy of the gra vity model to estimate origin-destination matrices even at the country level (Erlander and Stewart, 1990; Wilson, 1969; Simini et al., 2012; Balcan et al., 2009; Lenormand et al., 2016). Algorithm 3 describ es how d -EPR assigns a lo cation on the bi-dimensional space defined by a spatial tessellation L for an entry in mobilit y diary D ( t ) . The d -EPR tak es in input tw o v ariables: (i) the current sampled mobilit y tra jectory of the synthetic individual S = h ( x 1 , y 1 , t 1 ) , . . . , ( x n , y n , t n ) i ; (ii) a probabilit y matrix P indicating, for every pair of lo cations i, j ∈ L, i 6 = j the probabilit y of moving from i to j . Every probability p ij is computed as: p ij = 1 Z r i r j d 2 ij , Data-driven generation of spatio-temporal routines in h uman mobilit y 17 where r i ( j ) is the relev ance of location i ( j ) as sp ecified in the weigh ted spa- tial tessellation L , d ij is the geographic distance b et ween i and j , and Z = P i,j 6 = i p ij is a normalization constant. The matrix P is computed b efore the execution of the Ditras mo del by using the spatial tessellation L . With probability p new = ρN − γ where N is the num ber of distinct lo ca- tions in S and ρ = 0 . 6, γ = 0 . 21 are constants (P appalardo et al., 2015b, 2016a; Song et al., 2010a), the individual chooses to explore a new lo cation (Algorithm 3, line 5), otherwise she returns to a previously visited lo cation (Algorithm 3, line 10). If the individual explores and is in lo cation i , the new lo cation j 6 = i is se lected according to the probability p ij ∈ P (Algorithm 3, function PreferentialExploration ). If the individual returns to a previously visited location, it is c hosen with probabilit y proportional to the n umber of her previous visits to that lo cation (Algorithm 3, function preferentialReturn ). The d -EPR mo del hence returns the chosen lo cation j . It is worth highlighting the difference b et ween typical lo cations and pre- ferred lo cations. T ypical lo cations indicate places where individuals repeat- edly return as part of their mobility routine. Examples of typical loc ations are home and w ork lo cations, where individuals regularly return in their ev ery- da y routine. Besides t ypical lo cations, individuals can also return to preferred lo cations, i.e., places whic h are not part of a schematic routine but where p eople return o ccasionally , such as cinemas or restauran ts. The preferential return mechanism of d -EPR mo dels the existence of such preferred lo cations, allo wing the agents to return to previously visited lo cations with a probability dep ending of the past visitation frequency . 6 Results In this section we show the results of simulation exp erimen ts where we in- stan tiate Ditras by using d -EPR as tra jectory generator and MD ( t ) as diary generator. W e construct MD ( t ) from nation-wide mobile phone data cov ering a p eriod of three mon th using MDL. W e refer to the spatio-temp oral mo del as d -EPR (CDR) MD and use it to generate sampled mobility tra jectories of 10,000 agen ts. W e compare the resulting sampled mobilit y tra jectories with: – the tra jectories of 10,000 mobile phone users whose mobilit y is track ed during 3 months in a Europ ean country; – the sampled mobility tra jectories produced by other 8 spatio-temporal mo- bilit y mo dels created through the Ditras framew ork by combining differ- en t diary and tra jectory generators, whose parameters are fitted on the mobile phone data. Similarly we instan tiate Ditras by using d -EPR and MD ( t ) constructed on GPS v ehicular tracks cov ering a p eriod of one mon th. W e refer to the spatio-temp oral model as d -EPR (GPS) MD . W e use this model to generate sam- ple mobilit y tra jectories of 10,000 agents and compare the resulting sample mobilit y tra jectories with: 18 Luca P appalardo and Filipp o Simini – the tra jectories of 10,000 priv ate v ehicles whose mobilit y is trac ked through on-b oard GPS devices during 4 weeks in T uscany; – the sampled mobility tra jectories produced by other 8 spatio-temporal mo- bilit y mo dels created through the Ditras framew ork by combining differ- en t diary and tra jectory generators, whose parameters are fitted on the GPS vehicular data. In Section 6.1 and in Section 6.2 we describe resp ectively the mobile phone data and the GPS vehicular data we use in our exp eriments to describ e the mobilit y of real individuals and the pre-pro cessing op erations we carry out on the data. In Section 6.3 w e provide a comparison on a set of spatio-temp oral mobilit y patterns of d -EPR (CDR) MD ’s tra jectories, mobile phone data’s tra jecto- ries, and the tra jectories pro duced by the other mo dels. These simulati ons are p erformed by using a weigh ted spatial tessellation induced by the mobile phone to wers. Analogously , we pro vide a comparison on a set of spatio-temp oral mo- bilit y patterns of d -EPR (GPS) MD ’s tra jectories, GPS data’s tra jectories, and the tra jectories pro duced by the other mo dels. These sim ulations are p erformed b y using a weigh ted spatial tessellation induced by the census cells in T uscan y . All the simulations are p erformed using a time slot duration t = 3600s = 1h. 6.1 CDR data W e ha ve access to a set of Call Detail Records (CDRs) gathered by a European carrier for billing and op erational purp oses. The dataset records all the calls made during 11 weeks by ≈ 1 million anonymized mobile phone users. CDRs collect geographical, temp oral and interaction information on mobile phone use and show an enormous p oten tial to empirically inv estigate the structure and dynamics of human mobilit y on a so ciety wide scale (Reades et al., 2007; Hidalgo and Ro driguez-Sic k ert, 2008; Gonz´ alez et al., 2008; Jiang et al., 2012; Calabrese et al., 2011; Pappalardo et al., 2015b,a). Eac h time an individual mak es a call the mobile phone op erator registers the connection b et w een the caller and the callee, the duration of the call and the co ordinates of the phone to wer communicating with the phone, allo wing to reconstruct the user’s ap- pro ximate p osition. T able 2 illustrates an example of the structure of CDRs. Data-driven generation of spatio-temporal routines in h uman mobilit y 19 (a) timestamp to wer caller callee 2007/09/10 23:34 36 4F80460 4F80331 2007/10/10 01:12 36 2B01359 9H80125 2007/10/10 01:43 38 2B19935 6W1199 . . . . . . . . . . . . (b) to wer latitude longitude 36 49.54 3.64 37 48.28 1.258 38 48.22 -1.52 . . . . . . . . . T able 2 Example of Call Detail Records (CDRs). Every time a user makes a call, a record is created with timestamp, the phone tow er serving the call, the caller identifier and the callee iden tifier (a). F or each to w er, the latitude and longitude co ordinates are av ailable to map the tow er on the territory (b). CDRs hav e b een extensively used in literature to study different asp ects of h uman mobilit y , due to several adv antages: they provide a means of sampling user lo cations at large population scales; they can b e retrieved for different coun tries and geographic scales given their w orldwide diffusion; they provide an ob jectiv e concept of lo cation, i.e., the phone tow er. Nev ertheless, CDR data suffer different t yp es of bias (Ranjan et al., 2012; Io v an et al., 2013), such as: (i) the p osition of an individual is known at the granularit y level of phone to wers; (ii) the p osition of an individual is known only when she makes a phone call; (iii) phone calls are sparse in time, i.e., the time betw een consecutiv e calls follo ws a hea vy tail distribution (Gonz´ alez et al., 2008; Barab´ asi, 2005). In other words, since individuals are inactive most of their time, CDRs allo w to reconstruct only a subset of an individual’s mobilit y . Several works in literature study the bias in CDRs by comparing the mobilit y patterns observ ed on CDRs to the same patterns observed on GPS data (Pappalardo et al., 2013b, 2015b, 2013a,c) or handov er data (data capturing the lo cation of mobile phone users recorded ev ery hour or so) (Gonz´ alez et al., 2008). The studies agree that the bias in CDRs do es not affect significantly the study of h uman mobilit y patterns. Data pr epr o c essing. In order to cop e with sparsit y in time of CDRs and fo- cus on individuals with reliable call statistics, w e carry out some prepro cessing steps. Firstly , for each individual u w e discard all the lo cations with a visita- tion frequency f = n i / N ≤ 0 . 005, where n i is the num b er of calls p erformed b y u in lo cation i and N the total num ber of calls p erformed by u during the p eriod of observ ation (Schneider et al., 2013; Pappalardo et al., 2015b). This condition chec ks whether the lo cation is relev ant with resp ect to the sp ecific 20 Luca P appalardo and Filipp o Simini call v olume of the individual. Since it is meaningless to analyze the mobility of individuals who do not mov e, all the individuals with only one lo cation after the previous filter are discarded. W e select only activ e individuals with a call frequency threshold of f = N / ( h ∗ d ) ≥ 0 . 5 calls per hour, where N is the total n umber of calls made b y u , h = 24 is the hours in a da y and d = 77 the days in our p eriod of observ ation. Starting from ≈ 1 millions users, the filtering results in 50 , 000 active mobile phone users. Weighte d Sp atial T essel lation. The w eighted spatial tessellation L we use in the exp eriments is defined by the mobile phone tow ers in the CDR data. The relev ance of a phone tow er is estimated as the total num b er of calls served by that to wer b y the 50,000 active mobile phone users during the 3 months. Every lo cation’s position on the space is identified b y the latitude and longitude co ordinates of a phone tow er. 6.2 GPS data The GPS dataset stores information of appro ximately 9.8 Million differen t trips from 159,000 priv ate v ehicles trac ked during one month (May 2011) which passed through T uscan y (cen tral Italy). The GPS traces are provided b y Octo T elematics Italia Srl, 2 a company that provides a data collection service for insurance companies. The GPS device is embedded in the priv ate v ehicles’ engine and automatically turns on when the vehicle starts. The sequence of GPS points that the device transmits ev ery 30 seconds to the serv er via a GPRS connection forms the global tra jectory of a vehicle. When the v ehicle stops no p oin ts are logged nor sen t. W e exploit these stops to split the global tra jectory into several sub- tra jectories, corresp onding to the trips p erformed by the v ehicle. Clearly , the v ehicle ma y ha ve stops of differen t duration, corresp onding to differen t ac- tivities. T o ignore small stops like gas stations, traffic lights, bring and get activities and so on, we choose a stop duration threshold of at least 20 min- utes: if the time in terv al b etw een t wo consecutiv e observ ations of the v ehicle is larger than 20 min utes, the first observ ation is considered as the end of a trip and the second observ ation is considered as the start of another trip. W e also p erformed the extraction of the trips by using different stop duration thresh- olds (5, 10, 15, 20, 30, 40 minutes), without finding significant differences in the sample of short trips and in the statistical analysis w e presen t in the paper. Since GPS data do not provide explicit information ab out visited locations, w e assign each origin and destination point of the obtained sub-tra jectories to the corresp onding census cell, according to the information pro vided b y the Italian National Institute of Statistics (IST A T). 3 W e hence obtain a data format similar to CDR data, where w e describ e the mo vemen ts of a vehicle b y the time-ordered list of census cells where the vehicle stopp ed. W e filter the data by discarding all the vehicles with only one visited lo cation or with 2 http://www.octotelematics.com/ 3 www.istat.it Data-driven generation of spatio-temporal routines in h uman mobilit y 21 less than one trip p er da y on a verage during the p erio d of observ ation. This filtering results in a dataset of 46,121 vehicles. Weighte d Sp atial T essel lation. The w eighted spatial tessellation L w e use in the experiments is defined b y the census cells in T uscan y . The relev ance of a lo cation is estimated as the total num b er of stops in the corresp onding cell by the 159,000 priv ate vehicles during the mon th of observ ation. Every lo cation’s p osition on the space is iden tified by the latitude and longitude co ordinates of the census cell. 6.3 Mo dels comparison and v alidation W e use the Ditras framework to build 18 mo dels (9 mo dels fitted on CDRs and 9 mo dels fitted on GPS data) which use different com binations for the di- ary generator and the tra jectory generator. In particular, we consider three di- ary generators – MD, RD and WT – and three tra jectory generators – d -EPR, SWIM and LA TP . F or ev ery mo del we simulate the mobility of 10,000 agents for a p erio d of N = 1 , 848 hours (3 months) and N = 744 hours (1 month) for mo dels fitted on CDRs and GPS data resp ectively . T able 3 and T able 4 sho w the ability of every mo del in repro ducing a set of characteristic statistical dis- tributions deriv ed from the CDR and the GPS data respectively , quantified b y t wo measures: (i) the Ro ot Mean Square Error, RMSE( y , ˆ y ) = q P n i =1 ( ˆ y i − y i ) 2 n where ˆ y i ∈ ˆ y indicates a p oint of the synthetic distribution ˆ y , y i ∈ y the corresp onding p oint in the empirical distribution y and n the num ber of ob- serv ations; (ii) the Kullback-Leibler div ergence, KL( y || ˆ y ) = H ( y , ˆ y ) − H ( y ), where H ( y , ˆ y ) is the cross entrop y b et ween the real distribution and the em- pirical distribution and H ( y ) is the entrop y of the real distribution. Here we use the notation TG DG to specify that tra jectory generator TG is used in com bination with diary generator DG. F or example, d -EPR MD indicates the mo del using diary generator MD in combination with tra jectory generator d -EPR. Notation TG { DG 1 ,..., DG k } indicates the set of mo dels { TG DG 1 , . . . , TG DG k } . Similarly , notation { TG 1 , . . . , TG k } DG indicates the set of mo dels { TG 1 DG , . . . , TG k DG } . 22 Luca P appalardo and Filipp o Simini CDR ∆r r g S unc T D ∆t V N f ( L ) MD d -EPR .0001 .0026 .9643 .0061 .0659 .0014 2 . 6 e − 5 .0218 .0122 .0006 .0247 29.34 .0101 .0682 .1915 .0016 .5449 .1200 SWIM .0005 - 3.6069 .0062 .0683 .0029 5 . 6 e − 5 - .0669 .0067 60.97 .0101 .0808 .4996 .0451 1.2892 LA TP .0001 .0061 3.2236 .0062 .0684 .0027 6 . 3 e − 5 - .0625 .0008 .3223 258.46 .0101 .0802 .3282 .0600 .9353 RD d -EPR .0004 .0027 1.1745 .0232 .2098 .0024 4 . 1 e − 5 .0235 .0521 .0029 .0161 20.8015 .197 4.3558 .2048 .0191 1.1773 .3876 SWIM .0041 - - .0232 - .0033 7 . 2 e − 5 - .0947 .1501 .1974 .3773 .0460 4.4057 LA TP .0002 - - .0232 - .0033 4 . 6 e − 5 - .0874 .0014 .1974 .6967 .0321 2.2051 WT d -EPR .0003 .0024 1.1666 .0232 .1790 .0023 4 . 0 e − 5 .0224 .0502 .0019 .0130 20.00 .1970 3.9769 .1946 .0189 1.0395 .3537 SWIM .0033 - - .0232 .2036 .0033 1 . 9 e − 5 - .0943 .0601 .1975 4.3806 .1146 .0070 3.9605 LA TP .0001 - - .0232 .2037 .0033 7 . 2 e − 5 - .0866 .0010 .1975 4.5672 .6322 .0309 2.1015 best model d -EPR d -EPR d -EPR d -EPR d -EPR d -EPR SWIM d -EPR d -EPR MD WT MD MD MD MD WT MD MD T able 3 Error of fit b et ween CDR data and synthetic data. Every ro w i is a mo del and every column j a mobility measure. A cell ( i, j ) indicates the RMSE (first row) and the KL divergence (second ro w) of a syn thetic distribution w.r.t. the real distribution. The best RMSE values are in blue. Symbol - indicates that the synthetic distribution is not comparable with the real distribution. W e highligh t in blue the cells with the b est v alues of RMSE and KL div ergence. W e color in red the com bination of temp oral and spatial model leading to the highest num b er of blue cells. Diary gener ators. In the Random Diary (RD) generator a synthetic individual is in p erp etuum motion: in ev ery time slot of the simulation she c ho oses a new lo cation to visit. W e use RD to highligh t the difference b et w een the diary generator we prop ose, MD (Section 4.1), and the temp oral patterns of a non- realistic diary generator. In the W aiting Time (WT) diary generator a synthetic individual c ho oses a w aiting time ∆t b etw een a trip and the next one from the empirical distribu- tion P ( ∆t ) ∼ ∆t − 1 − β exp − ∆t/τ , with β = 0 . 8 and τ = 17 hours as measured on CDR data (Song et al., 2010a). WT is the temp oral mechanism usually used in combination with mobility mo dels like EPR (Song et al., 2010a) and SWIM (Kosta et al., 2010). It repro duces in a realistic wa y the distribution of the time b etw een t w o consecutive trips (Song et al., 2010a; Pappalardo et al., 2013b) but do es not mo del the circadian rhythm and the tendency of individuals to b e in certain places and sp ecific times. W e construct t wo diary generators, MD (CDR) and MD (GPS) , b y applying algorithm MDL (Section 4.1) on CDR data and GPS data resp ectiv ely . These diary generators are based on Marko v mo dels and can repro duce the circadian rh ythm of individuals and their tendency to follow or break the routine. T r aje ctory gener ators. The tra jectory generator SWIM (Kosta et al., 2010) is a mo delling approach based on lo cation preference. The mo del initially assigns to each syn thetic individual a home lo cation L h c hosen randomly from the Data-driven generation of spatio-temporal routines in h uman mobilit y 23 spatial tessellation. The synthetic individual then selects a destination for the next mo vemen ts depending on the weigh t of eac h lo cation (Kosta et al., 2010): w ( L ) swim = α ∗ d ( L h , L ) + (1 − α ) ∗ r ( L ) , α = 0 . 75 (1) whic h gro ws with the relev ance r ( L ) of the location and decreases with the distance from the home (Kosta et al., 2010): d ( L h , L ) = 1 (1 + distance ( L h , L )) 2 . SWIM tries to mo del both the preference for short trips and the preference for relev ant lo cations, though it do es not mo del the preferential return mechanism. The tra jectory generator LA TP (Least Action T rip Planning) (Lee et al., 2012, 2009) is a trip planning algorithm used as exploration mechanism in sev eral mobility mo dels, such as SLA W (Lee et al., 2012, 2009), SMOOTH (Munjal et al., 2011), MSLA W (Sch wam b orn and Aschen bruck, 2013) and TP (Solmaz et al., 2015, 2012). In LA TP a syn thetic individual selects the next lo cation to visit according to a weigh t function (Lee et al., 2012, 2009): w ( L ) latp = 1 distance ( c, L ) 1 . 5 . (2) LA TP only models the preference for short distances and do es not consider the relev ance of a lo cation nor mo del the preferential return mechanism. W e compare the synthetic mobility tra jectories of the nine models with CDR tra jectories and GPS tra jectories on the distributions of several measures capturing salien t characteristics of human mobility . T able 3 and T able 4 display the mobilit y measures we consider, which are: trip distance ∆r (Gonz´ alez et al., 2008; Pappalardo et al., 2013b), radius of gyration r g (Gonz´ alez et al., 2008; P appalardo et al., 2013b, 2015b), mobilit y entrop y S unc (Song et al., 2010b; Eagle and Pen tland, 2009; Pappalardo et al., 2016b), lo cation frequency f ( L ) (Song et al., 2010a; Hasan et al., 2013; P appalardo et al., 2013b), visits p er lo cation V (Pappalardo et al., 2016a), lo cations p er user N (Pappalardo et al., 2016a), trips p er hour T (Gonz´ alez et al., 2008; P appalardo et al., 2013b), time of stays ∆t (Song et al., 2010a; Hasan et al., 2013) and trips p er day D . 24 Luca P appalardo and Filipp o Simini GPS ∆r r g S unc T D ∆t V N f ( L ) MD d -EPR .0254 .0148 1.9855 .0053 .1334 .0738 .0123 .0113 .0323 .5346 .2850 156.92 .0156 .2992 .7567 .1415 .0411 .2429 SWIM .0229 - 3.8403 .0054 .1232 .0589 .0123 .0319 .0358 .8970 210.87 .0156 .2634 .7321 .1522 1.6923 .4914 LA TP .0258 .0225 3.7636 .0054 .1233 .0655 .0178 .0315 .0324 .5968 .9508 151.35 .0157 .2636 .7148 .4639 1.9085 .3811 RD d -EPR .0031 .0237 - .0231 .0923 .0349 .0042 .0271 .0560 .0420 .9939 .1906 1.2493 .4221 .0360 3.3216 .5258 SWIM .0274 - - .0231 - .2647 .0102 - .0915 1.6628 .1912 1.4443 .0919 3.6641 LA TP .0169 - - .0231 - .1599 .0168 - .0899 .1381 .1912 1.1524 .3609 2.9663 WT d -EPR .0069 .0223 - .0231 .0923 .0291 .0045 .0270 .0530 .0518 .8217 .1906 1.0593 .4369 .0394 2.132 .4623 SWIM .0180 - - .0231 .0923 .1608 .0095 - .0908 .7278 .1912 .9510 1.0941 .0823 3.2346 LA TP .0190 - - .0231 .0923 .1027 .0166 - .0890 .1840 .1913 1.0398 .9187 .4282 2.6838 best model d -EPR d -EPR d -EPR d -EPR SWIM d -EPR SWIM d -EPR d -EPR RD MD MD MD WT WT WT MD MD T able 4 Error of fit b et ween GPS data and synthetic data. Ev ery ro w i is a model and every column j a mobility measure. A cell ( i, j ) indicates the RMSE (first row) and the KL divergence (second ro w) of a syn thetic distribution w.r.t. the real distribution. The best RMSE values are in blue. Symbol - indicates that the synthetic distribution is not comparable with the real distribution. W e highligh t in blue the cells with the b est v alues of RMSE and KL div ergence. W e color in red the com bination of temp oral and spatial model leading to the highest num b er of blue cells. T rip distanc e. The distance of a trip ∆r is the geographical distance b et ween the trip’s origin and destination lo cations. W e compute the trip distances for ev ery individual and then plot the distribution P ( ∆r ) of trip distances in Fig. 2a-c (CDR data) and Fig. 3a-c (GPS data). Fig. 2a compares the distribution of trip distance of CDR data with the distributions pro duced by d -EPR (CDR) MD , SWIM (CDR) MD and LA TP (CDR) MD . W e observe that d -EPR (CDR) MD and LA TP (CDR) MD are able to repro duce the distribution of P ( ∆r ) although slightly ov erestimating long-distance trips. In contrast SWIM (CDR) MD cannot repro duce the shap e of the empirical distribution resulting in a RMSE(SWIM (CDR) MD ) and KL(SWIM (CDR) MD ) higher than the other t wo mo dels (see T able 3). The shape of the synthetic distributions do not v ary significantly by changing the diary generator (Fig. 2, b-c). In other words, the choice of the diary generator do es not affect the abilit y of the mo del to capture the distribution P ( ∆r ). This is also evident from T able 3 where the RMSEs and the KLs in the first column v ary a little b y changing the diary generator. Mo del d -EPR (CDR) MD pro duces the b est fit with CDR data, as w e notef in Fig. 2c and T able 3. This suggests that mo delling preferen tial return and lo cation preference is crucial to repro duce P ( ∆r ) as w ell as the preference for short-distance trips. Although SWIM embeds a pref- erence for short-distance trips (Equation 1) the distance is chosen with resp ect to the home lo cation L h leading to an underestimation of short-distance trips (Fig. 2a-c). Fig. 3a-c compares the distribution of trip distance of GPS data with the distributions pro duced b y the generativ e algorithms. Results on GPS Data-driven generation of spatio-temporal routines in h uman mobilit y 25 data confirm the observ ations on CDRs: in contrast with SWIM, d -EPR and LA TP are able to repro duce the distribution of P ( ∆r ), regardless the diary generator. Also in this case, d -EPR (GPS) RD is the model generating the most realistic synthetic data (T able 4). R adius of gyr ation. The radius of gyration r g is the characteristic distance tra veled by an individual during the perio d of observ ation (Gonz´ alez et al., 2008; Pappalardo et al., 2013b, 2015b). In detail, r g c haracterizes the spatial spread of the lo cations visited by an individual u from the tra jectories’ center of mass (i.e., the weigh ted mean p oin t of the lo cations visited by an individual), defined as: r g = s X i ∈ L ( u ) p i ( l i − l cm ) 2 , (3) where l i and l cm are the vectors of co ordinates of lo cation i and center of mass, resp ectiv ely (Gonz´ alez et al., 2008; P appalardo et al., 2013b, 2015b), L ( u ) ⊆ L is the set of lo cations visited b y individual u , p i = n i / | L ( u ) | is the individual’s visitation frequency of location l i , equal to the n um b er of visits to l i divided by the total num b er of visits to all lo cations. In Fig. 2a we observ e that d -EPR (CDR) MD is the only mo del capable of reproducing the shape of P ( r g ) of CDR data, though o verestimating the presence of large radii (see Fig. 2d). RMSE( d -EPR (CDR) MD ) for r g is indeed low er than RMSE(SWIM (CDR) MD ) and RMSE(LA TP (CDR) MD ) as shown in T able 3. SWIM (CDR) MD and LA TP (CDR) MD cannot repro duce the shap e of P ( r g ) because r g also depends on the preferential return mechanism (Song et al., 2010a; Pappalardo et al., 2015b) which is not mo deled in SWIM and LA TP . In a previous work (Pappalardo et al., 2016a) w e also show that P ( r g ) dep ends on the preferen tial exploration mechanism of d -EPR since a version of d -EPR without preferential exploration – the s - EPR model – is not able to repro duce the shap e of P ( r g ). W e also observ e that while d -EPR (CDR) { MD, RD, WT } pro duce similar distributions of r g , SWIM and LA TP pro duce different distributions of r g with different choices of the diary generator (Fig. 2e, f ). The shap e of P ( r g ) for GPS data is slightly different from the same distribution of CDR data, since short radii are l ess lik ely in GPS due to the nature of car trav els (Pappalardo et al., 2013c,b,a). Also for GPS w e observe that, in contrast with LA TP and SWIM, d -EPR is the only mo del that can repro duce the shap e of P ( r g ). In particular d -EPR (GPS) MD pro duces the b est fitting with GPS data in terms of b oth RMSE and KL (T able 4). Mobility entr opy. The mobilit y entrop y S unc of an individual u is defined as the Shannon entrop y of her visited lo cations (Song et al., 2010b; Eagle and P entland, 2009; Pappalardo et al., 2016b): S unc ( u ) = P i ∈ L ( u ) p i log( p i ) log | L ( u ) | , (4) where p i is the probability that individual u visits lo cation i during the perio d of observ ation and log | L ( u ) | is a normalization factor. The mobilit y entrop y 26 Luca P appalardo and Filipp o Simini of an individual quantifies the p ossibility to predict individual’s future where- ab outs. Individuals ha ving a very regular mo v ement pattern possess a mobilit y en tropy close to zero and their whereab outs are rather predictable. Conv ersely , individuals with a high mobility entrop y are less predictable. W e observ e that the a v erage S unc pro duced by d -EPR (CDR) MD data equals the av erage S unc =0 . 61 in CDR data, although d -EPR (CDR) MD underestimates the v ariance of distribution P ( S unc ) (Fig. 2g). In con trast, SWIM (CDR) MD and LA TP (CDR) MD largely ov erestimate S unc and underestimate the v ariance of P ( S unc ), resulting in RMSE and KL muc h higher than RMSE( d -EPR (CDR) MD ) and KL( d - EPR (CDR) MD ), as sho wn in T able 3. This is b ecause SWIM and LA TP do not mo del the preferential return mechanism, whic h increases the predictability of individuals since they tend to come back to already visited lo cations. P ( S unc ) is not robust to the choice of diary generator: diary generator RD and WT mak e the models to largely ov erestimate S unc (Figures 2h, i). In particular SWIM (CDR) { RD, WT } and LA TP (CDR) { RD, WT } pro duce distributions with ¯ S unc ≈ 1, in- dicating that the t ypical synthetic individual is muc h more unpredictable than a typical individual in CDR data. This makes those distributions not compa- rable with the distribution of MD mo dels. Hence, distribution P ( S unc ) highly dep ends on b oth the choice of the tra jectory generator and the choice of the diary generator. W e observe similar results for GPS data, where only { d -EPR, SWIM, LA TP } (GPS) MD can repro duce P ( S unc ) in reasonable agreement with real data. All the other models pro duce distributions that are not comparable with the entropies of priv ate v ehicles (Fig. 3g-i). L o c ation fr e quency. Another important characteristic of an individual’s mobil- it y is the probability of visiting a lo cation given the lo cation’s rank. The rank of a lo cation dep ends on the n um b er of times the individual visits the locations o ver the p erio d of observ ation. F or instance, rank 1 represents the most visited lo cation (generally home place); rank 2 the second most visited lo cation (e.g., w ork place) and so on. W e compute the frequency of eac h of these rank ed loca- tions for every individual and plot the distribution of frequencies f ( L i ) in Fig. 4a-c (CDR) and Fig. 5a-c (GPS). F or CDR data, we observe that d -EPR (CDR) MD repro duces the shap e of f ( L i ) (with RMSE=0.0122 and KL=0.12) b etter than SWIM (CDR) MD and LA TP (CDR) MD (whic h ha ve RMSE=0.0669, KL=1.2892 and RMSE=0.0626, KL=0.9353 resp ectiv ely). If w e change the diary generator in the model, d -EPR (CDR) { RD, WT } underestimate the frequency of the top-ranked lo cation and sligh tly o v erestimate the frequency of the less visited lo cations with resp ect to CDR data (Fig. 4b-c). A reason for this discrepancy is that RD and WT do not tak e into account the circadian rh ythm of individuals, hence underestimating the num b er of returns to the most frequent location (usually the home place). In SWIM (CDR) MD and LA TP (CDR) MD , the absence of a preferen tial return mec hanism pro duce a more uniform distribution of location frequencies (Fig. 4b-c), which is further exacerbated for SWIM (CDR) { RD, WT } and LA TP (CDR) { RD, WT } . Lo cation frequency f ( L i ) is another case where the choice of Data-driven generation of spatio-temporal routines in h uman mobilit y 27 CDR 1 0 0 1 0 1 1 0 2 1 0 3 1 0 4 ∆ r [ k m ] 1 0 8 1 0 7 1 0 6 1 0 5 1 0 4 1 0 3 1 0 2 1 0 1 1 0 0 1 0 1 P ( ∆ r ) Trip distance CDR MD+dEPR MD+SWIM MD+LATP (a) 1 0 0 1 0 1 1 0 2 1 0 3 1 0 4 ∆ r [ k m ] 1 0 9 1 0 8 1 0 7 1 0 6 1 0 5 1 0 4 1 0 3 1 0 2 1 0 1 1 0 0 1 0 1 1 0 2 P ( ∆ r ) Trip distance CDR RD+dEPR RD+SWIM RD+LATP (b) 1 0 0 1 0 1 1 0 2 1 0 3 1 0 4 ∆ r [ k m ] 1 0 9 1 0 8 1 0 7 1 0 6 1 0 5 1 0 4 1 0 3 1 0 2 1 0 1 1 0 0 1 0 1 1 0 2 P ( ∆ r ) Trip distance CDR WT+dEPR WT+SWIM WT+LATP (c) 1 0 0 1 0 1 1 0 2 1 0 3 r g [ k m ] 1 0 7 1 0 6 1 0 5 1 0 4 1 0 3 1 0 2 1 0 1 1 0 0 P ( r g ) Radius of Gyration CDR MD+dEPR MD+SWIM MD+LATP (d) 1 0 0 1 0 1 1 0 2 1 0 3 r g [ k m ] 1 0 7 1 0 6 1 0 5 1 0 4 1 0 3 1 0 2 1 0 1 1 0 0 P ( r g ) Radius of Gyration CDR RD+dEPR RD+SWIM RD+LATP 380 420 460 520 560 0.00 0.01 0.02 0.03 RD + SWIM (e) 1 0 0 1 0 1 1 0 2 1 0 3 r g [ k m ] 1 0 7 1 0 6 1 0 5 1 0 4 1 0 3 1 0 2 1 0 1 1 0 0 P ( r g ) Radius of Gyration CDR WT+dEPR WT+SWIM WT+LATP 380 420 460 520 560 0.00 0.01 0.02 0.03 WT + SWIM (f ) 0.0 0.2 0.4 0.6 0.8 1.0 S u n c 0 2 4 6 8 10 12 14 16 P ( S u n c ) µ = 0 . 6 1 µ = 0 . 8 6 µ = 0 . 6 1 Mobility Entropy CDR MD+dEPR MD+SWIM MD+LATP (g) 0.0 0.2 0.4 0.6 0.8 1.0 S u n c 0 2 4 6 8 10 12 14 16 P ( S u n c ) Mobility Entropy CDR RD+dEPR RD+SWIM RD+LATP 0.989 0.990 0.991 0.992 0.993 0.994 0.995 0.996 0 100 200 300 400 500 600 700 RD + SWIM (h) 0.0 0.2 0.4 0.6 0.8 1.0 S u n c 0 2 4 6 8 10 12 14 16 P ( S u n c ) Mobility Entropy CDR WT+dEPR WT+SWIM WT+LATP 0.980 0.982 0.984 0.986 0.988 0 100 200 300 400 500 µ = 0 . 9 8 WT + SWIM (i) Fig. 2 Distributions of h uman mobility patterns (CDR). The figure compares the models and CDR data on trip distance, radius of gyration and mobilit y entrop y . Plots in (a), (b) and (c) show the distribution of trip distances P ( ∆r ) for real data (black squares) and data pro duced by three tra jectory generators ( d -EPR, SWIM and LA TP) in combination with the MD generator (a), the RD generator (b) and the WT generator (c). Plots in (d), (e) and (f ) sho w the distribution of radius of gyration r g , while plots in (g), (h) and (i) show the distribution of mobilit y en tropy S unc . the diary generator and the choice of the tra jectory generator are b oth crucial to repro duce the shap e of the distribution in an accurate w ay . Experiments on GPS data confirm results observed on CDRs (Fig. 5a-c): mo del d -EPR (GPS) MD 28 Luca P appalardo and Filipp o Simini GPS 1 0 0 1 0 1 1 0 2 1 0 3 ∆ r [ k m ] 1 0 6 1 0 5 1 0 4 1 0 3 1 0 2 1 0 1 1 0 0 1 0 1 P ( ∆ r ) Trip distance GPS MD+dEPR MD+SWIM MD+LATP (a) 1 0 0 1 0 1 1 0 2 1 0 3 ∆ r [ k m ] 1 0 6 1 0 5 1 0 4 1 0 3 1 0 2 1 0 1 1 0 0 1 0 1 P ( ∆ r ) Trip distance GPS RD+dEPR RD+SWIM RD+LATP (b) 1 0 0 1 0 1 1 0 2 1 0 3 ∆ r [ k m ] 1 0 6 1 0 5 1 0 4 1 0 3 1 0 2 1 0 1 1 0 0 1 0 1 P ( ∆ r ) Trip distance GPS WT+dEPR WT+SWIM WT+LATP (c) 1 0 0 1 0 1 1 0 2 r g [ k m ] 1 0 5 1 0 4 1 0 3 1 0 2 1 0 1 1 0 0 P ( r g ) Radius of Gyration GPS MD+dEPR MD+SWIM MD+LATP (d) 1 0 0 1 0 1 1 0 2 r g [ k m ] 1 0 5 1 0 4 1 0 3 1 0 2 1 0 1 1 0 0 P ( r g ) Radius of Gyration GPS RD+dEPR RD+SWIM RD+LATP 54 55 56 57 58 59 60 61 0.00 0.05 0.10 0.15 0.20 0.25 0.30 0.35 0.40 RD + SWIM (e) 1 0 0 1 0 1 1 0 2 r g [ k m ] 1 0 5 1 0 4 1 0 3 1 0 2 1 0 1 1 0 0 P ( r g ) Radius of Gyration GPS WT+dEPR WT+SWIM WT+LATP 52 54 56 58 60 62 64 0.00 0.05 0.10 0.15 0.20 0.25 0.30 0.35 WT + SWIM (f ) 0.0 0.2 0.4 0.6 0.8 1.0 S u n c 0 2 4 6 8 10 12 14 P ( S u n c ) Mobility Entropy GPS MD+dEPR MD+SWIM MD+LATP (g) 0.0 0.2 0.4 0.6 0.8 1.0 S u n c 0 5 10 15 20 25 30 35 40 P ( S u n c ) Mobility Entropy GPS RD+dEPR RD+SWIM RD+LATP 0.991 0.992 0.993 0.994 0.995 0.996 0.997 0.998 0 100 200 300 400 500 600 RD + SWIM (h) 0.0 0.2 0.4 0.6 0.8 1.0 S u n c 0 5 10 15 20 25 30 P ( S u n c ) Mobility Entropy GPS WT+dEPR WT+SWIM WT+LATP 0.978 0.980 0.982 0.984 0.986 0.988 0.990 0 50 100 150 200 250 300 350 WT + SWIM (i) Fig. 3 Distributions of human mobility patterns (GPS). The figure compares the models and GPS data on trip distance, radius of gyration and mobilit y en tropy . pro duces the b est fit with real data, while changing either the diary or the tra jectory generators pro duces worse fits. Visits p er lo c ation. A useful measure to understand how a set of individuals exploit the mobility space is the num b er V of ov erall visits p er lo cation, i.e., the total n umber of visits b y all the individuals in every location during the perio d of observ ation. F or every dataset, we compute the n umber of visits for ev ery lo cation of the weigh ted spatial tessellation and plot the distribution P ( V ) in Data-driven generation of spatio-temporal routines in h uman mobilit y 29 Fig. 6d-f (CDR) and Fig. 7d-f (GPS). As for CDR data, d -EPR (CDR) MD pro duces a P ( V ) which follows a heavy tail distribution: the ma jorit y of lo cations hav e just one visit while a minority of lo cations hav e up to several thousands visits during the 11 weeks. The v alue of V of a location depends on t wo factors: (i) its relev ance in the weigh ted spatial tessellation; (ii) its p osition in the weigh ted spatial tessellation. The higher the relev ance of a location in the weigh ted spatial tessellation, the higher is the probability for the lo cation to b e visited in the exploration mechanisms of d -EPR and SWIM. Indeed, from Fig. 6e-f w e observe that d -EPR and SWIM are the mo dels which b etter fit P ( V ). In con trast LA TP do es not take into account the relev ance of a lo cation during the exploration b eing unable to capture the shap e of P ( V ). Exp erimen ts on GPS data substantially confirm these results (Fig. 7d-f ): d -EPR and SWIM generates the most realistic distributions of P ( V ). L o c ations p er user. The num ber N u of distinct locations visited by an individ- ual during the p eriod of observ ation describ es the degree of exploration of an individual, i.e., ho w the single individuals exploit the mobility space. In Fig. 4g w e observe that the MD mo dels do not capture the shap e of P ( N u ) in CDR data: the av erage num b er of distinct lo cations N according to d -EPR (CDR) MD is ab out t wice N in CDR data, while SWIM (CDR) MD and LA TP (CDR) MD pro duce distri- butions whose N is more than ten times N in CDR data. By changing diary generator (Fig. 4h-i) the difference with CDR data becomes even larger: d - EPR (CDR) { RD, WT } pro duce a muc h broader v ariance of P ( N u ), SWIM (CDR) { RD, WT } and LA TP (CDR) { RD, WT } predict a n umber of distinct visited locations very far from CDR data. These results suggest that the considered mo dels ov eresti- mate the degree of exploration of individuals. In the case of d -EPR (CDR) MD the o verestimation may dep end on the distribution of time of stays, as the distri- bution of time sta ys P ( ∆t ) produced by d -EPR (CDR) MD o verestimates the n umber of short stay times, leading to a larger total num b er of visited lo cations (Fig. 6g). F or GPS data, mo del d -EPR (GPS) MD pro duces a P ( N ) that is more realistic than the other mo dels, as it is evident from Fig. 7g and from T able 4. T rips p er hour. Human mov ements follow the circadian rhythm, i.e., they are prev alently stationary during the night and mov e preferably at sp ecific times of the day (Gonz´ alez et al., 2008; P appalardo et al., 2013b). T o v erify whether the considered mo dels are able to capture this c haracteristic of h uman mobility , w e compute the n um b er of trips T made b y the individuals at every hour of the p eriod of observ ation. Fig. 6a-c and Fig. 7a-c show how T distribute across the 24 hours of the day , for CDRs and GPS data resp ectiv ely . W e observ e that, regardless the tra jectory generator used, diary generator MD pro duces a distribution of trips p er hour very similar to real data (Fig. 6a and Fig. 7a). The mobility diary generator MD prop osed in Section 4 is hence able to create mobilit y diaries which repro duce the circadian rhythm of individuals in an accurate wa y . In contrast, diary generators RD and WT are not able to capture this distribution, regardless the tra jectory generator used (Fig. 6b-c 30 Luca P appalardo and Filipp o Simini CDR 1 0 0 1 0 1 L i 1 0 3 1 0 2 1 0 1 1 0 0 f ( L i ) Location Frequency CDR MD+dEPR MD+SWIM MD+LATP (a) 1 0 0 1 0 1 L i 1 0 3 1 0 2 1 0 1 1 0 0 f ( L i ) Location Frequency CDR RD+dEPR RD+SWIM RD+LATP (b) 1 0 0 1 0 1 L i 1 0 3 1 0 2 1 0 1 1 0 0 f ( L i ) Location Frequency CDR WT+dEPR WT+SWIM WT+LATP (c) 1 0 0 1 0 1 1 0 2 1 0 3 1 0 4 1 0 5 V l 1 0 1 0 1 0 9 1 0 8 1 0 7 1 0 6 1 0 5 1 0 4 1 0 3 1 0 2 1 0 1 P ( V l ) Visits per location CDR MD+dEPR MD+SWIM MD+LATP (d) 1 0 0 1 0 1 1 0 2 1 0 3 1 0 4 1 0 5 V l 1 0 1 0 1 0 9 1 0 8 1 0 7 1 0 6 1 0 5 1 0 4 1 0 3 1 0 2 1 0 1 P ( V l ) Visits per location CDR RD+dEPR RD+SWIM RD+LATP (e) 1 0 0 1 0 1 1 0 2 1 0 3 1 0 4 1 0 5 V l 1 0 1 0 1 0 9 1 0 8 1 0 7 1 0 6 1 0 5 1 0 4 1 0 3 1 0 2 1 0 1 P ( V l ) Visits per location CDR WT+dEPR WT+SWIM WT+LATP (f ) 0 50 100 150 200 250 300 N u 0.000 0.005 0.010 0.015 0.020 0.025 0.030 0.035 0.040 P ( N u ) Locations per user CDR MD+dEPR MD+SWIM MD+LATP (g) 0 50 100 150 200 250 300 N u 0.000 0.005 0.010 0.015 0.020 0.025 0.030 0.035 0.040 P ( N u ) Locations per user CDR RD+dEPR RD+SWIM RD+LATP 600 800 1000 1200 1400 0.000 0.005 0.010 0.015 0.020 (h) 0 50 100 150 200 250 300 N u 0.000 0.005 0.010 0.015 0.020 0.025 0.030 0.035 0.040 P ( N u ) Locations per user CDR WT+dEPR WT+SWIM WT+LATP 600 800 1000 1200 1400 0.000 0.005 0.010 0.015 0.020 (i) Fig. 4 Distributions of human mobility patterns (CDR) . The figure compares the models and CDR data on location frequency , visits p er lo cation and lo cations p er users. Plots in (a), (b) and (c) sho w the distribution of lo cation frequency f ( L ) for d -EPR, SWIM and LA TP used in combination with MD, RD and WT resp ectively . Plots in (d), (e) and (f ) show the distribution of the n umber V of visits p er location and plots in (g), (h), (i) show the distribution of the num b er N of distinct visited locations per user. and Fig. 7b-c). This is because: (i) in RD individuals are alwa ys in motion; (ii) WT takes into accoun t the waiting times but not the preference of individuals to mov e at sp ecific times of the day . Data-driven generation of spatio-temporal routines in h uman mobilit y 31 GPS 1 0 0 1 0 1 L i 1 0 3 1 0 2 1 0 1 1 0 0 f ( L i ) Location Frequency GPS MD+dEPR MD+SWIM MD+LATP (a) 1 0 0 1 0 1 L i 1 0 3 1 0 2 1 0 1 1 0 0 f ( L i ) Location Frequency GPS RD+dEPR RD+SWIM RD+LATP (b) 1 0 0 1 0 1 L i 1 0 3 1 0 2 1 0 1 1 0 0 f ( L i ) Location Frequency GPS WT+dEPR WT+SWIM WT+LATP (c) 1 0 0 1 0 1 1 0 2 1 0 3 1 0 4 1 0 5 V l 1 0 9 1 0 8 1 0 7 1 0 6 1 0 5 1 0 4 1 0 3 1 0 2 1 0 1 P ( V l ) Visits per location GPS MD+dEPR MD+SWIM MD+LATP (d) 1 0 0 1 0 1 1 0 2 1 0 3 1 0 4 1 0 5 V l 1 0 9 1 0 8 1 0 7 1 0 6 1 0 5 1 0 4 1 0 3 1 0 2 1 0 1 P ( V l ) Visits per location GPS RD+dEPR RD+SWIM RD+LATP (e) 1 0 0 1 0 1 1 0 2 1 0 3 1 0 4 1 0 5 V l 1 0 9 1 0 8 1 0 7 1 0 6 1 0 5 1 0 4 1 0 3 1 0 2 1 0 1 P ( V l ) Visits per location GPS WT+dEPR WT+SWIM WT+LATP (f ) 0 20 40 60 80 100 120 N u 0.00 0.01 0.02 0.03 0.04 0.05 0.06 0.07 0.08 P ( N u ) Locations per user GPS MD+dEPR MD+SWIM MD+LATP (g) 0 20 40 60 80 100 120 N u 0.00 0.01 0.02 0.03 0.04 0.05 0.06 0.07 P ( N u ) Locations per user GPS RD+dEPR RD+SWIM RD+LATP 0 100 200 300 400 500 600 700 800 0.00 0.01 0.02 0.03 0.04 0.05 0.06 (h) 0 20 40 60 80 100 120 N u 0.00 0.01 0.02 0.03 0.04 0.05 0.06 0.07 P ( N u ) Locations per user GPS WT+dEPR WT+SWIM WT+LATP 0 100 200 300 400 500 600 0.000 0.005 0.010 0.015 0.020 0.025 0.030 0.035 0.040 (i) Fig. 5 Distributions of human mobility patterns (GPS) . The figure compares the models and GPS data on lo cation frequency , visits per location and lo cations p er users. T rips p er day. The num b er of trips per day D indicates the tendency of in- dividuals to trav el in their every-da y life. F or every dataset, we compute the n umber of trips p er day made b y eac h individual during the p erio d of observ a- tion and plot the distribution P ( D ) in Fig. 6d-f (CDR) and Fig. 7d-f (GPS). W e observe that d -EPR (CDR, GPS) MD , SWIM (CDR, GPS) MD and LA TP (CDR, GPS) MD are able to capture the shape of P ( D ) but o v erestimate the v ariance of the distribution (Fig. 6d). The other diary generators, RD and WT, are not able to repro duce 32 Luca P appalardo and Filipp o Simini the CDR distribution since the a verage num ber D of trips p er da y is muc h higher than CDR data (Fig. 6e-f ). Again, this is b ecause in RD individuals are alw ays in motion and b ecause WT does not take into accoun t the circadian rh ythm of individuals. Time of stays. The distribution of stay times ∆t is another imp ortant tem- p oral features observed in h uman mobility . Stay time is the amoun t of time an individual sp ends at a particular lo cation. In our exp eriments w e compute the stay time as the num b er of hours every individual sp ends in her visited lo cations and plot the distribution P ( ∆t ) in Fig. 4g-i (CDR) and Fig. 5g-i (GPS). W e observe that, for b oth CDRs and GPS data, d -EPR (CDR, GPS) { MD, RD, WT } capture the shap e of the distribution while the other mo dels do not, though o verestimating the presence of short time stays. 6.4 Discussion of results Tw o main results emerge from our exp eriments. First, mo del d -EPR MD pro- duces sampled mobility tra jectories having in general the best fit to b oth CDR data and GPS data (i.e., having the low est RMSE and KL for most of the measures), as evident in T able 3 and T able 4. Diary generator MD, in- deed, simulates in a realistic wa y temp oral human mobility patterns suc h as the distribution of lo cation frequency (Fig. 4a) and the distribution of trips p er hour (Fig. 6a and Fig. 7a). This is mainly b ecause MD reproduces the circadian rhythm of individuals, while RD and WT do not. Moreov er, tra jec- tory generator d -EPR embeds tw o mobility mec hanisms: preferential return and preferen tial exploration. The preferential return mec hanism – absen t in SWIM and LA TP – allows for a realistic simulation of, for example, the distri- bution of radius of gyration (Fig. 2d and Fig. 3d) and the distribution of stay times (Fig. 6g). The preferential exploration mec hanism, which is mo deled by b oth d -EPR and SWIM but it is absent in LA TP , allows for a realistic descrip- tion of the territory exploitation by individuals, in terms of the distribution of the num b er of visits p er lo cation (Fig. 4d and Fig. 5d). Also, mo del d -EPR MD pro duces realistic distributions for b oth CDR and GPS data, suggesting that it can b e used in different simulation scenarios where its parameters are fitted on different types of data and different spatio-temp oral resolutions. Second in teresting result is that the temp oral and the spatial mechanisms ha ve different roles in shaping the distribution of standard mobility measures. Some measures, such as trip distance (Fig. 2a-c and Fig. 3a-c), radius of gy- ration (Fig. 2d-f and Fig. 3d-f ), visits p er lo cation (Fig. 4d-f and Fig. 5d-f ) and time of sta ys (Fig. 2g-i) mainly dep end on the choice of the tra jectory generator, i.e., on the spatial mechanism of the mo del. Indeed, by changing the underlying diary generator the shape of these distribution, the RMSE and the KL div ergence w.r.t. real data do not c hange in a significant wa y . Other measures, such as trips p er hour (Fig. 6a-c and Fig. 7a-c) and trips p er da y (Fig. 6d-f ) mainly dep end on the choice of the diary generator, i.e., on Data-driven generation of spatio-temporal routines in h uman mobilit y 33 CDR 0 5 10 15 20 t [ h ] 0.00 0.01 0.02 0.03 0.04 0.05 0.06 0.07 T ( t ) Trips per hour CDR MD + dEPR MD + SWIM MD + LATP (a) 0 5 10 15 20 t [ h ] 0.00 0.01 0.02 0.03 0.04 0.05 0.06 0.07 T ( t ) Trips per hour CDR RD + dEPR RD + SWIM RD + LATP (b) 0 5 10 15 20 t [ h ] 0.00 0.01 0.02 0.03 0.04 0.05 0.06 0.07 T ( t ) Trips per hour CDR WT + dEPR WT + SWIM WT + LATP (c) 0 5 10 15 20 25 T 0.00 0.05 0.10 0.15 0.20 0.25 P ( T ) Trips per day CDR MD+dEPR MD+SWIM MD+LATP (d) 0 5 10 15 20 25 T 0.00 0.05 0.10 0.15 0.20 0.25 P ( T ) Trips per day CDR RD+dEPR RD+SWIM RD+LATP (e) 0 5 10 15 20 25 T 0.00 0.05 0.10 0.15 0.20 0.25 P ( T ) Trips per day CDR WT+dEPR WT+SWIM WT+LATP (f ) 1 0 0 1 0 1 1 0 2 1 0 3 1 0 4 ∆ t [ h ] 1 0 9 1 0 8 1 0 7 1 0 6 1 0 5 1 0 4 1 0 3 1 0 2 1 0 1 1 0 0 p ( ∆ t ) Time of stays CDR MD+dEPR MD+SWIM MD+LATP (g) 1 0 0 1 0 1 1 0 2 1 0 3 1 0 4 ∆ t [ h ] 1 0 9 1 0 8 1 0 7 1 0 6 1 0 5 1 0 4 1 0 3 1 0 2 1 0 1 1 0 0 p ( ∆ t ) Time of stays CDR RD+dEPR RD+SWIM RD+LATP (h) 1 0 0 1 0 1 1 0 2 1 0 3 1 0 4 ∆ t [ h ] 1 0 9 1 0 8 1 0 7 1 0 6 1 0 5 1 0 4 1 0 3 1 0 2 1 0 1 1 0 0 p ( ∆ t ) Time of stays CDR WT+dEPR WT+SWIM WT+LATP (i) Fig. 6 Distributions of human mobility patterns (CDR) . The figure compares the models and CDR data on trips per hour, trips p er da y and time of stays. Plots in (a), (b) and (c) sho w the distribution of the n umber T of trips per hour of the da y for d -EPR, SWIM and LA TP used in combination with MD, RD and WT resp ectiv ely . Plots in (d), (e) and (f ) show the distribution of the num b er D of trips p er day , plots in (g), (h), (i) show the distribution of time of stays ∆t . the temp oral mechanism of the mo del. Conv ersely , b oth the spatial and the temp oral mechanism are determinant in repro ducing the distribution of some other measures like mobility entrop y (Fig. 2g-i and Fig. 3g-i) and lo cations p er user (Fig. 4g-i and Fig. 5g-i). Moreov er the right combination of diary 34 Luca P appalardo and Filipp o Simini GPS 0 5 10 15 20 t [ h ] 0.00 0.01 0.02 0.03 0.04 0.05 0.06 0.07 0.08 0.09 T ( t ) Trips per hour GPS MD + dEPR MD + SWIM MD + LATP (a) 0 5 10 15 20 t [ h ] 0.00 0.01 0.02 0.03 0.04 0.05 0.06 0.07 0.08 T ( t ) Trips per hour GPS RD + dEPR RD + SWIM RD + LATP (b) 0 5 10 15 20 t [ h ] 0.00 0.01 0.02 0.03 0.04 0.05 0.06 0.07 0.08 T ( t ) Trips per hour GPS WT + dEPR WT + SWIM WT + LATP (c) 0 5 10 15 20 25 T 0.0 0.1 0.2 0.3 0.4 0.5 0.6 0.7 0.8 P ( T ) Trips per day GPS MD+dEPR MD+SWIM MD+LATP (d) 0 5 10 15 20 25 T 0.0 0.1 0.2 0.3 0.4 0.5 0.6 0.7 0.8 P ( T ) Trips per day GPS RD+dEPR RD+SWIM RD+LATP (e) 0 5 10 15 20 25 T 0.0 0.1 0.2 0.3 0.4 0.5 0.6 0.7 0.8 P ( T ) Trips per day GPS WT+dEPR WT+SWIM WT+LATP (f ) 1 0 0 1 0 1 1 0 2 1 0 3 1 0 4 ∆ t [ h ] 1 0 7 1 0 6 1 0 5 1 0 4 1 0 3 1 0 2 1 0 1 1 0 0 1 0 1 p ( ∆ t ) Time of stays GPS MD+dEPR MD+SWIM MD+LATP (g) 1 0 0 1 0 1 1 0 2 1 0 3 1 0 4 ∆ t [ h ] 1 0 8 1 0 7 1 0 6 1 0 5 1 0 4 1 0 3 1 0 2 1 0 1 1 0 0 1 0 1 p ( ∆ t ) Time of stays GPS RD+dEPR RD+SWIM RD+LATP (h) 1 0 0 1 0 1 1 0 2 1 0 3 1 0 4 ∆ t [ h ] 1 0 8 1 0 7 1 0 6 1 0 5 1 0 4 1 0 3 1 0 2 1 0 1 1 0 0 1 0 1 p ( ∆ t ) Time of stays GPS WT+dEPR WT+SWIM WT+LATP (i) Fig. 7 Distributions of human mobility patterns (GPS) . The figure compares the models and GPS data on trips per hour, trips p er day and time of stays. and tra jectory generator, d -EPR MD , leads to more accurate fits w.r.t. b oth CDR data and GPS data for the ma jority of measures (T able 3 and T able 4). Human mobility patterns dep end on b oth where p eople go and when p eople mo ve: our results sho w that to repro duce them in an accurate wa y we need prop er choices for the spatial and the temporal generative mo dels to use in the Ditras framework. Data-driven generation of spatio-temporal routines in h uman mobilit y 35 7 Conclusion and future work In this pap er w e prop ose Ditras , a framework for the generation of individ- ual human mobility tra jectories with realistic spatio-temporal patterns. The framew ork consists of t wo steps: (i) the generation of a mobilit y diary b y using a diary generator; (ii) the generation of a mobilit y tra jectory by using a tra jec- tory generator. In the pap er we prop ose a nov el diary generator MD together with MDL, a data-driven algorithm to build it from real mobility data. W e instan tiate Ditras b y using MD and the state-of-the-art tra jectory generator d -EPR and obtain a nov el generative algorithm, d -EPR MD . W e use it to generate the spatio-temp oral tra jectories of thousands of agents visit- ing the lo cations on a large Europ ean coun try and a region in Italy . The generated sampled mobility tra jectories are compared with CDR data, GPS v ehicular data, and the tra jectories pro duced by other generative algorithms, eac h obtained by using a different combination of diary generator and tra jec- tory generator in the Ditras framew ork. Among the considered algorithms, d -EPR MD pro duces the b est fit with respect to both CDR data and GPS data. W e also observe that different combinations of diary and tra jectory genera- tors show different abilities to repro duce the distribution of standard mobility measures. This result highligh ts the imp ortance of considering both the spatial and temp oral dimensions in human mobility mo delling. The prop osed mo del d -EPR MD has a limited num b er of parameters to fit. The generation of the mobility diary is parameter-free as the Marko v chain is a non-parametric mo del where eac h elemen t of the transition matrix MD is estimated using the empirical frequencies observed in the data. The generation of the mobility tra jectory is based on the d -EPR mo del. The details on how to fit the d -EPR parameters are explained in detail in (Pappalardo et al., 2015b, 2016a). Here, for the tw o parameters of the exploration probability p new , we c ho ose the v alues ρ = 0 . 6 and γ = 0 . 21 that hav e b een estimated in previous w ork (Song et al., 2010a). F or the gra vity model used in the exploration phase, w e use a p o wer law deterrence function of the distance with exp onen t − 2, although other t yp es of gra vity or in terv ening opportunities models can b e used. Given that the mo del is non-parametric or dep ends on a v ery small n umber of parameters, it does not suffer from training/test issues and its calibration is quite robust to changes in the size of the training set. Applic ations. Given its flexibility , Ditras can b e used in a wide range of applications. Here we provide three examples where Ditras and d -EPR MD can b e particularly useful and profitably applied. In urban science, the generation of what-if scenarios to imagine the new mobilit y that could emerge from the construction of new infrastructures re- quires the generation of realistic mobility data and hence the presence of an accurate generative algorithm (Barb osa-Filho et al., 2017; Kopp et al., 2014). d -EPR MD could b e used to generate synthetic data given the tessellation of the territory that emerges from the construction of the new infrastructure, 36 Luca P appalardo and Filipp o Simini allo wing urban planners and managers to quantify changes in urban mobility and visualize preferred path that could emerge from the simulation. Computational epidemiology has attracted particular attention in the last decade, as the arriv al of the 2009 flu pandemic prompted scientists to develop realistic mobility models to simulate the spread of viruses on a territory (Mer- ler et al., 2013; Ajelli et al., 2010; V enk atramanan et al., 2017). The p ossibilit y to use Ditras to com bine differen t temporal and spatial mec hanisms is partic- ularly v aluable for this type of studies, as generative algorithms for individual h uman mobility are the basic mechanism used in computational epidemiology to generate synthetic p opulation mimicking at an individual level the realistic asp ects related to disease propagation. Opp ortunistic Netw orks (OppNets) enable communications in disconnected en vironments in the absence of an end-to-end path b et w een the sender and the receiver. In OppNets, the mobility of no des (e.g., mobile devices suc h as smartphones and tables) help the delivery of messages by connecting, asyn- c hronously in time, otherwise disconnected subnetw orks. This means that the net work proto cols resp onsible for finding a route b et ween t wo disconnected devices must embed patterns in human mov emen ts and mak e prediction of future encounters. Realistic generativ e algorithms for human mobilit y are fun- damen tal for testing the efficiency of OppNets proto col, as real data about the functioning of the net work is obviously not av ailable during the proto col design (T omasini et al., 2017). Ditras can be used to instantiate many generative algorithms and then generate realistic mobility routines to test the efficiency of a given netw ork proto col for OppNets. Given its accuracy in repro ducing h uman mobilit y patterns, d -EPR MD can be used to unco v er the characteristics of the netw ork proto col in real-life, suc h as the sp eed of message deliv ery . A possible application of Ditras and d -EPR MD in data mining is anomaly detection. The prop osed model can be used to detect individuals with an anomalous mobility b eha vior with respect to the typical mobility patterns of the ma jorit y of the individuals. In particular, within our framew ork an individual is anomalous if her tra jectory is not a likely outcome of the mo del, i.e., if the probability that the model would generate such tra jectory is b elow a giv en threshold. T o this end, the log-likelihoo d of eac h individual’s tra jectory can b e computed and the individuals can b e ranked according to their log- lik eliho o d v alues: individuals with a low rank and a very high log-likelihoo d v alues would b e the most t ypical, whereas individuals with the highest ranks and low log-likelihoo d v alues would b e the most anomalous. Impr ovements. The instantiation of Ditras we propose, d -EPR MD , can b e further impro ved in several directions. First, in this work the construction of the diary generator MD ( t ) through the mobilit y diary learner MDL is based on the simplest p ossible t ypical diary W ( t ) , where the most lik ely lo cation where a synthetic individual can b e found at any time is her home lo cation. More complex t ypical diaries can b e used sp ecifying, for example, the t ypical times where an individual can b e found at work, sc ho ol, friends’ home and so on. Suc h a comp osition of W ( t ) can b e constructed by using surv eys or generative Data-driven generation of spatio-temporal routines in h uman mobilit y 37 algorithms describing the daily schedule of human activities (Rinzivillo et al., 2014; Jiang et al., 2012; Liao et al., 2007) as a wa y to enric h an individual’s tra jectory with information about the t yp e of activit y associated to a location. Second, in d -EPR the preference for short-distance trips is em b edded in the preferential exploration phase only . A preference for short-distance trips can b e introduced during the preferential return mechanisms as well, in order to eliminate the ov erestimation of long-distance trips and long-distance radii observ ed in Figures 2a and 2d. Third, in d -EPR MD w e mak e the simplifying assumption that the trav el time is of negligible duration. This may not b e a go o d assumption esp ecially when the duration of the time slot is one hour or less. The prop osed algorithm can b e mo dified to explicitly include realistic information on the trav el time b et w een lo cations, which imp oses constraints on the lo cations that are reach- able in a given time window and on the time that can b e sp ent in a lo cation giv en the trav el time needed to reach the next lo cation in the mobility diary . Moreo ver, another in teresting improv emen t can b e to map the sampled mobil- it y tra jectories to a road netw ork sp ecifying sp ecific road routes with sp ecific v elo cities. This mapping would be of great help, for example, in what-if analy- sis where w e wan t to study ho w h uman mobilit y c hanges with the construction of a new infrastructure in an urban context. Finally , there is a large num b er of studies that demonstrate the connection b et w een human mobilit y and s ocial netw orks (Brown et al., 2013b; Hristo v a et al., 2016; W ang et al., 2011; V olko vic h et al., 2012; Bro wn et al., 2013a; Hossmann et al., 2011a,b), as well as several approaches that include informa- tion on so cial connections in h uman mobility models (Borrel et al., 2009; Y ang et al., 2010; Fischer et al., 2010; Boldrini and Passarella, 2010; Musolesi and Mascolo, 2007). A mec hanism to accoun t for the influence of so cial connections on human mobility can b e introduced in DITRAS as a third phase, b etw een the mobility diary generation and the sampled tra jectory construction. W e lea ve these improv ements of DITRAS for future work. A Homogeneity of typical mobility diaries W e investigate to what extent the typical mobility diaries of real individuals are homoge- neous by p erforming a clustering exp erimen t. F or every individual in the GPS dataset we compute her typical week, i.e. a time series of length 168 hours. Every time slot is the most frequent location of the individual in that hour of the week. W e then apply the DBSCAN clustering algorithm (Ester et al., 1996) to group the typical weeks in dense clusters. W e use the Levensh tein metric (Nav arro, 2001) to measure the similarity b etw een tw o typical weeks. DBSCAN takes t wo input parameters: minP ts and eps (Ester et al., 1996). W e set minP ts = 4 and eps = 70. W e estimate the v alue of these parameters using the pro cedure suggested in (T an et al., 2005): (i) w e fix minP ts = 4 and compute for every t ypical week the distance d to its 4th nearest neigh bor; (ii) we sort the typical weeks in increasing order with resp ect to d and set eps to the distance corresp onding to an elbow in the curve of Figure 8a. W e observe no significant differences in the clustering results by v arying minP ts in the range [2 , 5]. DBSCAN pro duces tw o clusters, one of them consisting of ≈ 90% of the typical weeks (Figure 8b). The silhouette coefficient of the clustering (Rousseeu w, 1987), a measure of ho w 38 Luca P appalardo and Filipp o Simini similar a t ypical diary is to its own cluster compared to other clusters, is s = 0 . 50 (in general, s ∈ [ − 1 , 1]). The typical weeks in the biggest cluster hav e typically one or tw o lo cations, while the representativ e typical week (i.e., the medoid of the cluster) consists of just one location, the most frequent location of the individual (Figure 8c-d). This result supp orts the v alidity of the simplifying assumption to consider one typical diary with a single lo cation for all agents. 0 20 40 60 80 100 typical weeks 0 20 40 60 80 100 120 140 160 70 k d i s t a n c e ( k = 4 ) (a) clusters 0.0 0.2 0.4 0.6 0.8 1.0 relative size of cluster 0.88 0.05 0.07 e p s = 7 0 m i n P t s = 4 cluster1 cluster2 noise (b) 0 1 2 3 4 5 6 7 8 9 10 11 12 13 14 15 16 17 18 19 20 21 22 23 hour individuals cluster1 (c) 0.0 0.2 0.4 0.6 0.8 1.0 entropy cluster1 0 5 10 15 20 25 30 35 40 45 % individuals 0 1 2 3 4 5 6 7 8 9 10 locs (d) Fig. 8 First Row : (a) Typical weeks sorted b y distance to the 4th nearest neighbor, the elbow suggests to use eps = 70; (b) Relative size of the clusters resulting from DBSCAN algorithm with minP ts = 4 and eps = 70 and their relative size. Second Row : (c) Visu- alization of a day of the typical weeks of 100 individuals in the GPS dataset for the first cluster. Every color represen ts a different abstract location in the typical diary . (d) Distri- bution of abstract lo cation en trop y and num b er of distinct abstract locations of time series of individuals in cluster 1. Data-driven generation of spatio-temporal routines in h uman mobilit y 39 B Computational Complexity of d -EPR MD L e arning phase. In the learning phase, tw o main tasks are performed: (1) the construction of the MD mo del by the MDL algorithm (Algorithm 2). The pro cedure UpdateMarkovChain has computational complexit y O ( N ), where N is the n umber of slots in the perio d of observ ation. As w e repeat the pro cedure for all the n individuals in the dataset, the computational complexit y of Algorithm 2 is O ( N n ). When n N , (e.g., when the p erio d of observ ation is short and the dataset contains hundreds of thousands of individuals), the factor N is negligible and the computational complexit y of Algorithm 2 can b e appro ximated to O ( n ). (2) the construction of the probability matrix P in the d -EPR mo del, which has complexity O ( L 2 ) where L is the n umber of lo cations in the spatial tessellation. Gener ation phase. In the generation phase, the generation of the mobility diary with MD has complexity O ( N ). The generation of the tra jectory from the mobility diary has complexity O ( LN n ) (Algorithm 3): in the worst case, for each individual w e assign a spatial location in each time slot, and the assignment of a spatial location requires a call to pro cedure weightedRandom whic h has complexit y O ( L ). When n N , the computational complexity can be appro ximated to O ( Ln ). The total complexity of the generation phase is hence O ( L 2 + Ln ) when the probability matrix has to be constructed for the first time. In this case, when L ∼ n the computational complexity can b e approximated to O ( L 2 ). If the probability matrix is already av ailable or has b een already computed, the computational complexity of the generation phase is O ( LN n ), whic h can b e approximated to O ( Ln ) when n N . Ac knowledgemen ts W e thank Paolo Cintia, Gianni Barlacchi and Salv atore Rinzivillo for their in v aluable suggestions. This work has b een partially funded by the EU under the H2020 Program b y pro ject Cimplex gran t n. 641191. Filipp o Simini has b een supp orted by EPSRC First Grant EP/P012906/1. References Marco Ajelli, Bruno Gon¸ calves, Duygu Balcan, Vittoria Colizza, Hao Hu, Jos ´ e J. Ra- masco, Stefano Merler, and Alessandro V espignani. Comparing large-scale computa- tional approac hes to epidemic mo deling: Agent-based v ersus structured metap opula- tion mo dels. BMC Infe ctious Dise ases , 10(1):190, Jun 2010. ISSN 1471-2334. doi: 10.1186/1471- 2334- 10- 190. URL https://doi.org/10.1186/1471- 2334- 10- 190 . D. Balcan, V. Colizza, B. Gon¸ calves, H. Hu, J. J. Ramasco, and A. V espignani. Multiscale mobility net works and the spatial spreading of infectious diseases. Pr o c e edings of the Na- tional A c ademy of Scienc es , 106(51):21484–21489, 2009. doi: 10.1073/pnas.0906910106. Albert-L´ aszl´ o Barab´ asi. The origin of bursts and heavy tails in h uman dynamics. Natur e , 435(7039):207–211, 2005. doi: 10.1038/nature03459. Hugo Barb osa, F ernando B. de Lima-Neto, Alexandre Evsukoff, and Ronaldo Menezes. The effect of recency to human mobility . EPJ Data Scienc e , 4(1):1–14, 2015. ISSN 2193- 1127. doi: 10.1140/ep jds/s13688- 015- 0059- 8. URL http://dx.doi.org/10.1140/epjds/ s13688- 015- 0059- 8 . H. Barb osa-Filho, M. Barthelemy, G. Ghoshal, C. R. James, M. Lenormand, T. Louail, R. Menezes, J. J. Ramasco, F. Simini, and M. T omasini. Human Mobility: Models and Applications. ArXiv e-prints , Septem ber 2017. M. Batty , K. W. Axhausen, F. Giannotti, A. Pozdnoukho v, A. Bazzani, M. W acho wicz, G. Ouzounis, and Y. P ortugali. Smart cities of the future. The Europ e an Physical Journal Sp e cial T opics , 214(1):481–518, 2012. ISSN 1951-6401. doi: 10.1140/ep jst/e2012- 01703- 3. 40 Luca P appalardo and Filipp o Simini T om Bellemans, Bruno Kochan, Da vy Janssens, Geert W ets, Theo Arentze, and Harry Tim- mermans. Implemen tation framework and developmen t tra jectory of feathers activity- based sim ulation platform. T r ansp ortation R ese ar ch R e c or d: Journal of the T r ansp orta- tion R ese ar ch Bo ar d , (2175):111–119, 2010. Chiara Boldrini and Andrea Passarella. Hcmm: Mo delling spatial and temp oral prop er- ties of human mobilit y driven by users’ so cial relationships. Computer Communica- tions , 33(9):1056 – 1074, June 2010. ISSN 0140-3664. doi: DOI:10.1016/j.comcom. 2010.01.013. URL http://www.sciencedirect.com/science /article/B6TYP- 4Y7P6WV- 1/ 2/77bb5e9181a33d1698dffd5cfc253e4f . V. Borrel, F. Legendre, M. Dias de Amorim, and S. Fdida. Simps: Using so ciology for personal mobility . IEEE/ACM T ransactions on Networking , 17(3):831–842, June 2009. ISSN 1063-6692. doi: 10.1109/TNET.2008.2003337. D. Brockmann, L. Hufnagel, and T. Geisel. The scaling laws of human trav el. Natur e , 439 (7075):462–465, 01 2006. URL http://dx.doi.org/10.1038/nature04292 . Chlo¨ e Brown, Vincenzo Nicosia, Salv atore Scellato, Anastasios Noulas, and Cecilia Mas- colo. Social and place-fo cused communities in lo cation-based online so cial netw orks. The Eur op ean Physical Journal B , 86(6):290, 2013a. ISSN 1434-6036. doi: 10.1140/ep jb/ e2013- 40253- 6. URL http://dx.doi.org/10.1140/epjb/e2013- 40253- 6 . Chloe Brown, Anastasios Noulas, Cecilia Mascolo, and Vincent Blondel. A place-fo cused model for social net works in cities. 2013 International Confer enc e on Social Computing (So cialCom) , 00:75–80, 2013b. doi: doi.ieeecomputersociety .org/10.1109/So cialCom.2013. 18. F. Calabrese, M. Colonna, P . Lo visolo, D. P arata, and C. Ratti. Real-time urban monitoring using cell phones: A case study in rome. IEEE T ransactions on Intel ligent T ransp ortation Systems , 12(1):141–151, Marc h 2011. ISSN 1524-9050. doi: 10.1109/TITS.2010.2074196. E. Cho, S. A. Myers, and J. Lesko vec. F riendship and mobilit y: user movemen t in lo cation- based so cial netw orks. In Pr o c e e dings of the 17th ACM SIGKDD International Con- fer enc e on Know le dge Disc overy and Data Mining , KDD’11, pages 1082–1090. ACM, 2011. Vittoria Colizza, Alain Barrat, Marc Barthelemy , Alain-Jacques V alleron, and Alessandro V espignani. Mo deling the worldwide spread of pandemic influenza: Baseline case and containmen t interv entions. PL oS Me d , 4(1):1–16, 01 2007. doi: 10.1371/journal.pmed. 0040013. Marco De Nadai, Jacop o Staiano, Rob erto Larcher, Nicu Seb e, Daniele Quercia, and Bruno Lepri. The death and life of great italian cities: A mobile phone data p erspective. In Pr o ce e dings of the 25th International Confer enc e on World Wide Web , WWW ’16, pages 413–423, Republic and Canton of Geneva, Switzerland, 2016. International W orld Wide W eb Conferences Steering Committee. ISBN 978-1-4503-4143-1. doi: 10.1145/2872427. 2883084. URL http://dx.doi.org/10.1145/2872427.2883084 . Natan Eagle and Alex Sandy P entland. Eigenbehaviors: iden tifying structure in rou- tine. Behavior al Ec olo gy and So ciobiolo gy , 63(7):1057–1066, 2009. doi: 10.1007/ s00265- 009- 0830- 6. F rans Ekman, Ari Ker¨ anen, Jouni Karvo, and J¨ org Ott. W orking day mov ement mo del. In Pr o ce e dings of the 1st ACM SIGMOBILE Workshop on Mobility Mo dels , Mobilit yMo dels ’08, pages 33–40, New Y ork, NY, USA, 2008. ACM. ISBN 978-1-60558-111-8. doi: 10. 1145/1374688.1374695. URL http://doi.acm.org/10.1145/1374688.1374695 . Sven Erlander and Neil F. Stewart. The Gr avity mo del in tr ansp ortation analysis : the ory and extensions . T opics in transp ortation. VSP , Utrech t, The Netherlands, 1990. ISBN 90-6764-089-1. URL http://opac.inria.fr/record=b1117869 . Martin Ester, Hans p eter Kriegel, Jorg S, and Xiaow ei Xu. A density-based algorithm for discov ering clusters in large spatial databases with noise. In Pr o c e e dings of the Se c ond International Confer enc e on Know le dge Disc overy and Data Mining (KDD) , pages 226– 231, 1996. Daniel Fischer, Klaus Herrmann, and Kurt Rothermel. Gesomo - a general so cial mobil- ity mo del for delay tolerant netw orks. In MASS , pages 99–108. IEEE Computer So- ciety , 2010. ISBN 978-1-4244-7488-2. URL http://dblp.uni- trier.de/db/conf/mass/ mass2010.html#FischerHR10 . Data-driven generation of spatio-temporal routines in h uman mobilit y 41 J. Ghosh, S. J. Philip, and C. Qiao. So ciological orbit aw are lo cation approximation and routing in manet. In 2nd International Confer enc e on Bro adb and Networks, 2005. , pages 641–650 V ol. 1, Oct 2005. doi: 10.1109/ICBN.2005.1589669. F osca Giannotti, Luca Pappalardo, Dino Pedresc hi, and Dashun W ang. A complexity sci- ence p ersp ectiv e on human mobility . In Mobility Data: Mo deling, Management, and Understanding , pages 297–314. 2013. Marta C. Gonz´ alez, Cesar A. Hidalgo, and Alb ert-Laszlo Barab´ asi. Understanding indi- vidual human mobility patterns. Natur e , 453(7196):779–782, June 2008. doi: 10.1038/ nature06958. Samiul Hasan, ChristianM Schneider, SatishV Ukkusuri, and MartaC Gonz´ alez. Spa- tiotemporal Patterns of Urban Human Mobility . Journal of Statistic al Physics , 151(1- 2):304–318, 2013. doi: 10.1007/s10955- 012- 0645- 0. URL http://dx.doi.org/10.1007/ s10955- 012- 0645- 0 . Andrea Hess, Karin Anna Hummel, Wilfried N. Gansterer, and G ¨ un ter Haring. Data-driven human mobility mo deling: A survey and engineering guidance for mobile netw orking. ACM Comput. Surv. , 48(3):38:1–38:39, December 2015. ISSN 0360-0300. doi: 10.1145/ 2840722. URL http://doi.acm.org/10.1145/2840722 . Cesar A. Hidalgo and C. Ro driguez-Sic kert. The dynamics of a mobile phone net- work. Physic a A: Statistic al Me chanics a nd its Applic ations , 387(12):3017–3024, 2008. ISSN 0378-4371. doi: h ttp://dx.doi.org/10.1016/j.physa.2008.01.073. URL http://www. sciencedirect.com/science/article/pii/S0378437108000976 . T. Hossmann, T. Spyropoulos, and F. Legendre. A complex netw ork analysis of human mo- bility . In 2011 IEEE Confer enc e on Computer Communic ations Workshops (INF OCOM WKSHPS) , pages 876–881, April 2011a. doi: 10.1109/INF COMW.2011.5928936. Theus Hossmann, Thrasyvoulos Spyropoulos, and F ranck Legendre. Putting contacts into context: Mobility mo deling b ey ond inter-contact times. In Pr o ce e dings of the Twelfth ACM International Symp osium on Mobile A d Ho c Networking and Computing , MobiHo c ’11, pages 18:1–18:11, New Y ork, NY, USA, 2011b. ACM. ISBN 978-1-4503-0722-2. doi: 10.1145/2107502.2107526. URL http://doi.acm.org/10.1145/2107502.2107526 . Desislav a Hristo v a, Anastasios Noulas, Chlo¨ e Bro wn, Mirco Musolesi, and Cecilia Mascolo. A m ultilay er approach to multiplexit y and link prediction in online geo-social netw orks. EPJ Data Science , 5(1):24, 2016. ISSN 2193-1127. doi: 10.1140/ep jds/s13688- 016- 0087- z. URL http://dx.doi.org/10.1140/epjds/s13688- 016- 0087- z . C. Iov an, A.-M. Olteanu-Raimond, T. Couronn´ e, and Z. Smoreda. Moving and calling: Mo- bile phone data qualit y measurements and spatiotemporal uncertaint y in human mobility studies. In Springer, editor, 16th International Confer enc e on Ge o gr aphic Information Scienc e (AGILE’13) , pages 247–265, Ma y 2013. doi: 10.1007/978- 3- 319- 00615- 4 14. URL http://dx.doi.org/10.1007/978- 3- 319- 00615- 4_14 . Davy Janssens. Data Scienc e and Simulation in T r ansportation R ese ar ch . IGI Global, Hershey , P A, USA, 1st edition, 2013. ISBN 1466649208, 9781466649200. S. Jiang, J. F erreira Jr, and M.C. Gonz´ alez. Clustering daily patterns of human activities in the city . Data Mining and Know ledge Disc overy , 25(3):478–510, 2012. doi: 10.1007/ s10618- 012- 0264- z. W. S. Jung, F. W ang, and H. E. Stanley . Gra vity mo del in the k orean highw ay . EPL (Eur ophysics L etters) , 81(4):48005, 2008. URL http://stacks.iop.org/0295- 5075/81/ i=4/a=48005 . Dmytro Karamsh uk, Chiara Boldrini, Marco Con ti, and Andrea Passarella. Human mobility models for opp ortunistic networks. IEEE Communic ations Magazine , 49(12):157–165, December 2011. doi: 10.1109/MCOM.2011.6094021. URL http://ieeexplore.ieee. org/xpls/abs_all.jsp?arnumber=6042290&tag=1 . Rob Kitchin. The real-time city? big data and smart urbanism. Ge oJournal , 79(1):1–14, 2013. ISSN 1572-9893. doi: 10.1007/s10708- 013- 9516- 8. Christine Kopp, Bruno Kochan, Mic hael Ma y , Luca Pappalardo, Salv atore Rinzivillo, Daniel Sch ulz, and Filipp o Simini. Ev aluation of spatio–temp oral microsimulation systems. In L. Knapen D. Janssens, A. Y asar, editor, Data on Science and Simulation in T ransp orta- tion R ese ar ch . IGI Global, 2014. Sokol Kosta, Alessandro Mei, and Julinda Stefa. Small world in motion (SWIM): Mo d- eling communities in ad-hoc mobile netw orking. In 2010 7th Annual IEEE Com- 42 Luca P appalardo and Filipp o Simini munic ations So ciety Confer enc e on Sensor, Mesh and Ad Ho c Communic ations and Networks (SECON) , pages 1–9. IEEE, June 2010. ISBN 978-1-4244-7150-8. doi: 10.1109/secon.2010.5508278. URL http://dx.doi.org/10.1109/secon.2010.5508278 . K. Lee, S. Hong, S. J. Kim, I. Rhee, and S. Chong. Slaw: A new mobilit y model for h uman walks. In INFOCOM 2009, IEEE , pages 855–863, April 2009. doi: 10.1109/INFCOM. 2009.5061995. Kyunghan Lee, Seongik Hong, Seong Joon Kim, Injong Rhee, and Song Chong. Slaw: Self- similar least-action human walk. IEEE/A CM T r ans. Netw. , 20(2):515–529, April 2012. ISSN 1063-6692. doi: 10.1109/TNET.2011.2172984. URL http://dx.doi.org/10.1109/ TNET.2011.2172984 . Maxime Lenormand, Bruno Gon¸ calves, Ant` onia T ugores, and Jos´ e J. Ramasco. Human diffusion and city influence. Journal of The Royal So ciety Interface , 12(109), 2015. ISSN 1742-5689. doi: 10.1098/rsif.2015.0473. Maxime Lenormand, Aleix Bassolas, and Jos J. Ramasco. Systematic comparison of trip distribution laws and mo dels. Journal of T ransp ort Ge o gr aphy , 51:158 – 169, 2016. ISSN 0966-6923. doi: 10.1016/j.jtrangeo.2015.12.008. URL http://www.sciencedirect.com/ science/article/pii/S0966692315002422 . Lin Liao, Donald J. Patterson, Dieter F ox, and Henry Kautz. Learning and inferring trans- portation routines. Artif. Intel l. , 171(5-6):311–331, April 2007. doi: 10.1016/j.artin t.2007. 01.006. Stefano Marchetti, Caterina Giusti, Monica Pratesi, Nicola Salv ati, F osca Giannotti, Dino Pedresc hi, Salv atore Rinzivillo, Luca Pappalardo, and Lorenzo Gabrielli. Small area model-based estimators using big data sources. Journal of Official Statistics , 31(2):263– 281, 2015. doi: 10.1515/jos- 2015- 0017. James McInerney , Sebastian Stein, Alex Rogers, and Nicholas R Jennings. Breaking the habit: Measuring and predicting departures from routine in individual human mobility . Pervasive and Mobile Computing , 9(6):808–822, 2013. Sandro Meloni, Nicola Perra, Alex Arenas, Sergio G´ omez, Y amir Moreno, and Alessandro V espignani. Mo deling h uman mobility resp onses to the large-scale spreading of infectious diseases. Scientific R ep orts , 1(62), 08 2011. doi: 10.1038/srep00062. URL http://dx. doi.org/10.1038/srep00062 . Stefano Merler, Marco Ajelli, Laura F umanelli, and Alessandro V espignani. Containing the accidental lab oratory escap e of p oten tial pandemic influenza viruses. BMC Me dicine , 11(1):252, Nov 2013. ISSN 1741-7015. doi: 10.1186/1741- 7015- 11- 252. URL https: //doi.org/10.1186/1741- 7015- 11- 252 . Aarti Munjal, T racy Camp, and William C. Navidi. Smooth: A simple wa y to mo del human mobility . In Pr o c e e dings of the 14th ACM International Confer enc e on Mo deling, Anal- ysis and Simulation of Wir eless and Mobile Systems , MSWiM ’11, pages 351–360, New Y ork, NY, USA, 2011. ACM. ISBN 978-1-4503-0898-4. doi: 10.1145/2068897.2068957. URL http://doi.acm.org/10.1145/2068897.2068957 . Mirco Musolesi and Cecilia Mascolo. Designing mobility mo dels based on social netw ork theory . SIGMOBILE Mob. Comput. Commun. R ev. , 11(3):59–70, July 2007. ISSN 1559-1662. doi: 10.1145/1317425.1317433. URL http://doi.acm.org/10.1145/1317425. 1317433 . Gonzalo Nav arro. A guided tour to approximate string matching. ACM Comput. Surv. , 33(1):31–88, March 2001. ISSN 0360-0300. doi: 10.1145/375360.375365. URL http: //doi.acm.org/10.1145/375360.375365 . Luca P appalardo, Salv atore Rinzivillo, Dino P edreschi, and F osca Giannotti. V alidating gen- eral human mobility patterns on gps data. In Pro c e e dings of the 21th Italian Symp osium on A dvanc e d Datab ase Systems , (SEBD2013), 2013a. Luca P appalardo, Salv atore Rinzivillo, Zehui Qu, Dino Pedresc hi, and F osca Giannotti. Understanding the patterns of car trav el. The Eur op e an Physical Journal Sp e cial T opics , 215(1):61–73, 2013b. doi: 10.1140/ep jst \ %252fe2013- 01715- 5. URL http://dx.doi.org/ 10.1140/epjst%252fe2013- 01715- 5 . Luca P appalardo, Filipp o Simini, Salv atore Rinzivillo, Dino P edresc hi, and F osca Giannotti. Comparing general mobility and mobility by car. In Pr oc e e dings of the 2013 BRICS Congr ess on Computational Intel ligence and 11th Br azilian Congr ess on Computational Intel ligenc e , BRICS-CCI-CBIC ’13, pages 665–668, W ashington, DC, USA, 2013c. IEEE Data-driven generation of spatio-temporal routines in h uman mobilit y 43 Computer So ciet y . ISBN 978-1-4799-3194-1. doi: 10.1109/BRICS- CCI- CBIC.2013.116. URL http://dx.doi.org/10.1109/BRICS- CCI- CBIC.2013.116 . Luca Pappalardo, Dino P edreschi, Zbigniew Smoreda, and F osca Giannotti. Using big data to study the link b etw een h uman mobilit y and so cio-economic dev elopment. In 2015 IEEE International Confer ence on Big Data, Big Data 2015, Santa Clara, CA, USA, Octob er 29 - Novemb er 1, 2015 , pages 871–878, 2015a. doi: 10.1109/BigData.2015.7363835. URL http://dx.doi.org/10.1109/BigData.2015.7363835 . Luca Pappalardo, Filippo Simini, Salv atore Rinzivillo, Dino Pedresc hi, F osca Giannotti, and Alb ert-Laszlo Barabasi. Returners and explorers dic hotomy in h uman mobility . Nat Commun , 6, 09 2015b. doi: 10.1038/ncomms9166. URL http://dx.doi.org/10.1038/ ncomms9166 . Luca P appalardo, Salv atore Rinzivillo, and Filipp o Simini. Human mobility mo delling: Exploration and preferential return meet the gravit y mo del. Pro c e dia Computer Scienc e , 83:934 – 939, 2016a. ISSN 1877-0509. doi: http://dx.doi.org/10.1016/j.procs.2016.04. 188. URL http://www.sciencedirect.com/science/article/pii/S1877050916302216 . The 7th In ternational Conference on Am bient Systems, Net works and T ec hnologies (ANT 2016) / The 6th International Conference on Sustainable Energy Information T echnology (SEIT-2016) / Affiliated W orkshops. Luca Pappalardo, Maarten V anho of, Lorenzo Gabrielli, Zbigniew Smoreda, Dino Pedresc hi, and F osca Giannotti. An analytical framew ork to now cast well-being using mobile phone data. International Journal of Data Scienc e and Analytics , pages 1–18, 2016b. ISSN 2364-4168. doi: 10.1007/s41060- 016- 0013- 2. URL http://dx.doi.org/10.1007/ s41060- 016- 0013- 2 . Gyan Ranjan, Hui Zang, Zhi-Li Zhang, and Jean Bolot. Are call detail records biased for sampling human mobilit y? SIGMOBILE Mob. Comput. Commun. Rev. , 16(3):33–44, December 2012. ISSN 1559-1662. doi: 10.1145/2412096.2412101. URL http://doi.acm. org/10.1145/2412096.2412101 . J. Reades, F. Calabrese, A. Sevtsuk, and C. Ratti. Cellular census: Explorations in urban data collection. IEEE Pervasive Computing , 6(3):30–38, July 2007. ISSN 1536-1268. doi: 10.1109/MPR V.2007.53. S. Rinzivillo, S. Mainardi, F. Pezzoni, M. Coscia, D. Pedresc hi, and F. Giannotti. Disco vering the geographical b orders of human mobility . K¨ unstliche Intelligenz , 26(3):253–260, 2012. doi: 10.1007/s13218- 012- 0181- 8. Salv atore Rinzivillo, Lorenzo Gabrielli, Mirco Nanni, Luca Pappalardo, Dino Pedresc hi, and F osca Giannotti. The purp ose of motion: Learning activities from individual mobility netw orks. In Pr o c e e dings of the 2014 International Confer enc e on Data Scienc e and A dvanc ed A nalytics , DSAA’14, pages 312–318, 2014. doi: 10.1109/DSAA.2014.7058090. Peter J. Rousseeu w. Silhouettes: A graphical aid to the interpretation and v alidation of cluster analysis. Journal of Computational and Applie d Mathematics , 20:53 – 65, 1987. ISSN 0377-0427. doi: http://dx.doi.org/10.1016/0377- 0427(87)90125- 7. URL http:// www.sciencedirect.com/science/article/pii/0377042787901257 . Christian M. Sc hneider, Vitaly Belik, Thomas Couronn´ e, Zbigniew Smoreda, and Marta C. Gonz´ alez. Unrav elling daily human mobilit y motifs. Journal of The R oyal So ciety Interfac e , 10(84), 2013. ISSN 1742-5689. doi: 10.1098/rsif.2013.0246. URL http: //rsif.royalsocietypublishing.org/content/10/84/20130246 . M. Sc h wam b orn and N. Aschen bruck. Introducing geographic restrictions to the sla w h uman mobility model. In 2013 IEEE 21st International Symp osium on Mo del ling, Analysis and Simulation of Computer and T elec ommunic ation Systems , pages 264–272, Aug 2013. doi: 10.1109/MASCOTS.2013.34. F. Simini, M. C. Gonz´ alez, A. Maritan, and A. L. Barab´ asi. A univ ersal mo del for mobilit y and migration patterns. Natur e , 484:96–100, 2012. doi: 10.1038/nature10856. G. Solmaz, M. ˙ I Akba¸ s, and D. T urgut. Mo deling visitor mo v ement in theme parks. In L o c al Computer Networks (LCN), 2012 IEEE 37th Confer enc e on , pages 36–43, Oct 2012. doi: 10.1109/LCN.2012.6423650. G. Solmaz, M. ˙ I Akba¸ s, and D. T urgut. A mobility mo del of theme park visitors. IEEE T r ansactions on Mobile Computing , 14(12):2406–2418, Dec 2015. ISSN 1536-1233. doi: 10.1109/TMC.2015.2400454. 44 Luca P appalardo and Filipp o Simini Chaoming Song, T al Koren, Pu W ang, and Alb ert-L´ aszl´ o Barab´ asi. Mo delling the scaling properties of human mobility. Natur e Physics , 6(10):818–823, September 2010a. ISSN 1745-2473. doi: 10.1038/nphys1760. URL http://dx.doi.org/10.1038/nphys1760 . Chaoming Song, Zehui Qu, Nicholas Blumm, and Alb ert-L´ aszl´ o Barab´ asi. Limits of pre- dictability in human mobility . Scienc e , 327(5968):1018–1021, 2010b. doi: 10.1126/science. 1177170. Laura Spinsanti, Michele Berlingerio, and Luca Pappalardo. Mobilit y and geo-so cial net- works. In Mobility Data: Mo deling, Management, and Understanding , pages 315–333. 2013. Pang-Ning T an, Michael Steinbac h, and Vipin Kumar. Intr o duction to Data Mining, (First Edition) . Addison-W esley Longman Publishing Co., Inc., Boston, MA, USA, 2005. ISBN 0321321367. Christian Thiemann, F abian Theis, Daniel Grady , Rafael Brune, and Dirk Bro c kmann. The structure of b orders in a small world. PloS one , 5(11):e15422, 2010. Marcello T omasini, Basim Mahmo o d, F ranco Zambonelli, Angelo Bra yner, and Ronaldo Menezes. On the effect of human mobility to the design of metrop olitan mobile op- portunistic net works of sensors. Pervasive and Mobile Computing , 38(P art 1):215 – 232, 2017. ISSN 1574-1192. doi: h ttps://doi.org/10.1016/j.pmcj.2016.12.007. URL http://www.sciencedirect.com/science/article/pii/S1574119216301195 . Sriniv asan V enk atramanan, Bryan Lewis, Jiangzhuo Chen, Dav e Higdon, Anil V ullik anti, and Madhav Marathe. Using data-driv en agent-based mo dels for forecasting emerg- ing infectious diseases. Epidemics , 2017. ISSN 1755-4365. doi: https://doi.org/ 10.1016/j.epidem.2017.02.010. URL http://www.sciencedirect.com/science/article/ pii/S1755436517300221 . Y ana V olko vich, Salv atore Scellato, David Laniado, Cecilia Mascolo, and Andreas Kaltenbrunner. The length of bridge ties: Structural and geographic prop erties of on- line so cial interactions. In Pr o c e e dings of the Sixth International Confer ence on Weblo gs and Social Me dia, Dublin, Ir eland, June 4-7, 2012 , 2012. URL http://www.aaai.org/ ocs/index.php/ICWSM/ICWSM12/paper/view/4670 . Dashun W ang, Dino Pedreschi, Chaoming Song, F osca Giannotti, and Alb ert-L´ aszl´ o Barab´ asi. Human mobility , so cial ties, and link prediction. In Pr o c e edings of the 17th ACM SIGKDD International Confer ence on Know le dge Disc overy and Data Mining , KDD ’11, pages 1100–1108, New Y ork, NY, USA, 2011. ACM. ISBN 978-1-4503-0813-7. doi: 10.1145/2020408.2020581. Pu W ang, Timothy Hunter, Alexandre M Bay en, Katja Schec htner, and Marta C Gonz´ alez. Understanding road usage patterns in urban areas. Scientific R ep orts , 2(1001), 2012. doi: 10.1038/srep01001. A. G. Wilson. The use of entropy maximising mo dels, in the theory of trip distribution, mode split and route split. Journal of T ransp ort Ec onomics and Policy , pages 108–126, 1969. doi: 10.2307/20052128. S. Y ang, X. Y ang, C. Zhang, and E. Spyrou. Using so cial netw ork theory for mo deling human mobility . IEEE Network , 24(5):6–13, Septem b er 2010. ISSN 0890-8044. doi: 10.1109/MNET.2010.5578912. Yingxiang Y ang, Shan Jiang, Daniele V eneziano, Shounak A thav ale, and Marta C. Gonza- lez. Timegeo: a spatiotemporal framew ork for modeling urban mobility without surv eys. PNAS , 2016. Qunw ei Zheng, Xiaoy an Hong, Jun Liu, David Cordes, and W an Huang. Agenda driven mobility modelling. IJAHUC , 5(1):22–36, 2010. doi: h ttp://dx.doi.org/10.1504/IJAHUC. 2010.03. G. K. Zipf. The p1p2/d hypothesis: On the in tercity mov emen t of p ersons. Americ an So ciolo gical R eview , 11(6):677–686, 1946. Data-driven generation of spatio-temporal routines in h uman mobilit y 45 The DITRAS framew ork input : L = { ( l 1 , r 1 ) , . . . , ( l n , r n ) } , w eigh ted spatial tessellation G, diary generator N , length of tra jectory to generate W , t ypical diary output: S = h ( x 1 , y 1 , t 1 ) , . . . , ( x n , y n , t n ) i , sampled mobility tra jectory of length N 1 D = generateMobilityDiary (G , N ) // use the diary generator DG to create a mobility diary D of length N 2 S = generateMobilityTrajectory ( D , L, W ) // scan the mobility diary D and create a sample mobility trajectory S of length N 3 return S 1 F unction generateMobilityTrajectory( D, L, W ) 2 S = new List () 3 t = 1 4 W m = assignLocationsTo ( W ) // assign a physical location to every abstract location in typical diary W 5 while d < leng th ( D ) do 6 // scan the mobility diary D 7 if D [ d ] = | then 8 // when it sees a separator ‘|’ 9 d = d + 1 10 con tinue 11 end 12 if D [ d ] = 0 then 13 // the individual follows the routine (i.e., she visits a typical location) 14 S . append (( W m [ t ] , t )) 15 t = t + 1 16 end 17 else 18 // the individual breaks the routine 19 l = TG ( S, P ) // call the trajectory generator TG to obtain the next location to visit 20 S . append (( l, t )) 21 t = t + 1 22 j = d + 1 23 while D [ d ] = D [ j ] do 24 // stay in location l until the next separator appears 25 S. append (( l, t )) 26 t = t + 1 27 j = j + 1 28 end 29 d = j − 1 30 end 31 d = d + 1 32 end 33 return S Algorithm 1: The algorithm describing the Ditras framework. 46 Luca P appalardo and Filipp o Simini MDL (Mobilit y Diary Learner) input : D = { T 1 , . . . , T n } , dataset of real tra jectories of n agents t , time slot length output: G , a Marko v c hain 1 G = emptyMarkovChain () 2 forall i ∈ { 1 , . . . , n } do 3 A i = createTimeSeries ( T i ) // create abstract trajectory of i 4 G = updateMarkovChain ( A i ) // update the Markov chain using A i 5 end 6 return G 1 F unction updateMarkovChain( A, G ) 2 slot = 0 3 while slot < l en ( A ) − 1 do 4 h = slot %24 // hour of the day 5 next h = ( h + 1)%24 // next hour of the day 6 loc h = A [ slot ] // abstract location at the slot 7 loc h +1 = A [ slot + 1] // abstract location at next slot 8 if l oc h == 1 then 9 if l oc h +1 == 1 then 10 // Case 1: l oc h is typical and l oc h +1 is typical 11 G [( h, 1) , ( next h , 1)] = G [( h, 1) , ( next h , 1)] + 1 12 end 13 else 14 // Case 2: l oc h is typical and l oc h +1 is not typical 15 τ = 1 16 for j = slot + 2 to l en ( A ) do 17 loc 2 h = A [ j ] 18 if loc 2 h == loc 2 h +1 then 19 τ = τ + 1 20 end 21 else 22 break 23 end 24 end 25 h τ = ( h + τ )%24 26 G [( h, 1) , ( h τ , 0)] = G [( h, 1) , ( h τ , 0)] + 1 27 slot = j − 1 28 end 29 end 30 else 31 if l oc h +1 == 1 then 32 // Case 3: l oc h is not typical and l oc h +1 is typical 33 G [( h, 0) , ( next h , 1)] = G [( h, 0) , ( next h , 1)] + 1 34 end 35 else 36 // Case 4: both l oc h and loc h +1 are not typical 37 τ = 1 38 for j = slot + 2 to l en ( A ) do 39 loc 2 h = A [ j ] 40 if loc 2 h == loc 2 h +1 then 41 τ = τ + 1 42 end 43 else 44 break 45 end 46 h τ = ( h + τ )%24 47 G [( h, 0) , ( h τ , 0)] = G [( h, 0) , ( h τ , 0)] + 1 48 slot = j − 1 49 end 50 end 51 end 52 slot = sl ot + 1 53 end 54 G = normalizeMarkovChain ( G ) 55 return G Algorithm 2: Algorithm for the construction of MD generator. Data-driven generation of spatio-temporal routines in h uman mobilit y 47 The d -EPR mo del input : S = h ( x 1 , y 1 , t 1 ) , . . . , ( x n , y n , t n ) i , the current sample mobilit y tra jectory of the synthetic individual P , the gravity-probabilit y matrix output: j , the next lo cation to visit ρ = 0 . 6, γ = 0 . 21 // distributions’ constants (Pappalardo et al., 2015b, 2016a; Song et al., 2010a) 1 N = | set ( S ) | // number of distinct visited locations 2 i = last ( S ) // the current location of the synthetic individual 3 p new = getReturnProbability () // generate a probability to return or explore 4 if p new ≤ ρN − γ then 5 j = PreferentialExploration ( i, P ) // explore a new location 7 7 return j 8 end 9 else 10 j = PreferentialReturn ( S ) // return to a previously visited location 12 12 return j 13 end 1 F unction PreferentialExploration( i ) 2 j = weightedRandom ( P [ i ]) // choose j according to prob.s in P [ i ] 4 4 return j 1 F unction PreferentialReturn( S ) 2 j = weightedRandom ( S ) // choose j according to visitation frequency of locations in S 4 4 return j Algorithm 3: The psuedo-co de of the d -EPR tra jectory generator. The function weightedRandom randomly c ho oses an element in a vector ac- cording to its probability .
Original Paper
Loading high-quality paper...
Comments & Academic Discussion
Loading comments...
Leave a Comment