Multi-Resolution Fully Convolutional Neural Networks for Monaural Audio Source Separation
In deep neural networks with convolutional layers, each layer typically has fixed-size/single-resolution receptive field (RF). Convolutional layers with a large RF capture global information from the input features, while layers with small RF size ca…
Authors: Emad M. Grais, Hagen Wierstorf, Dominic Ward
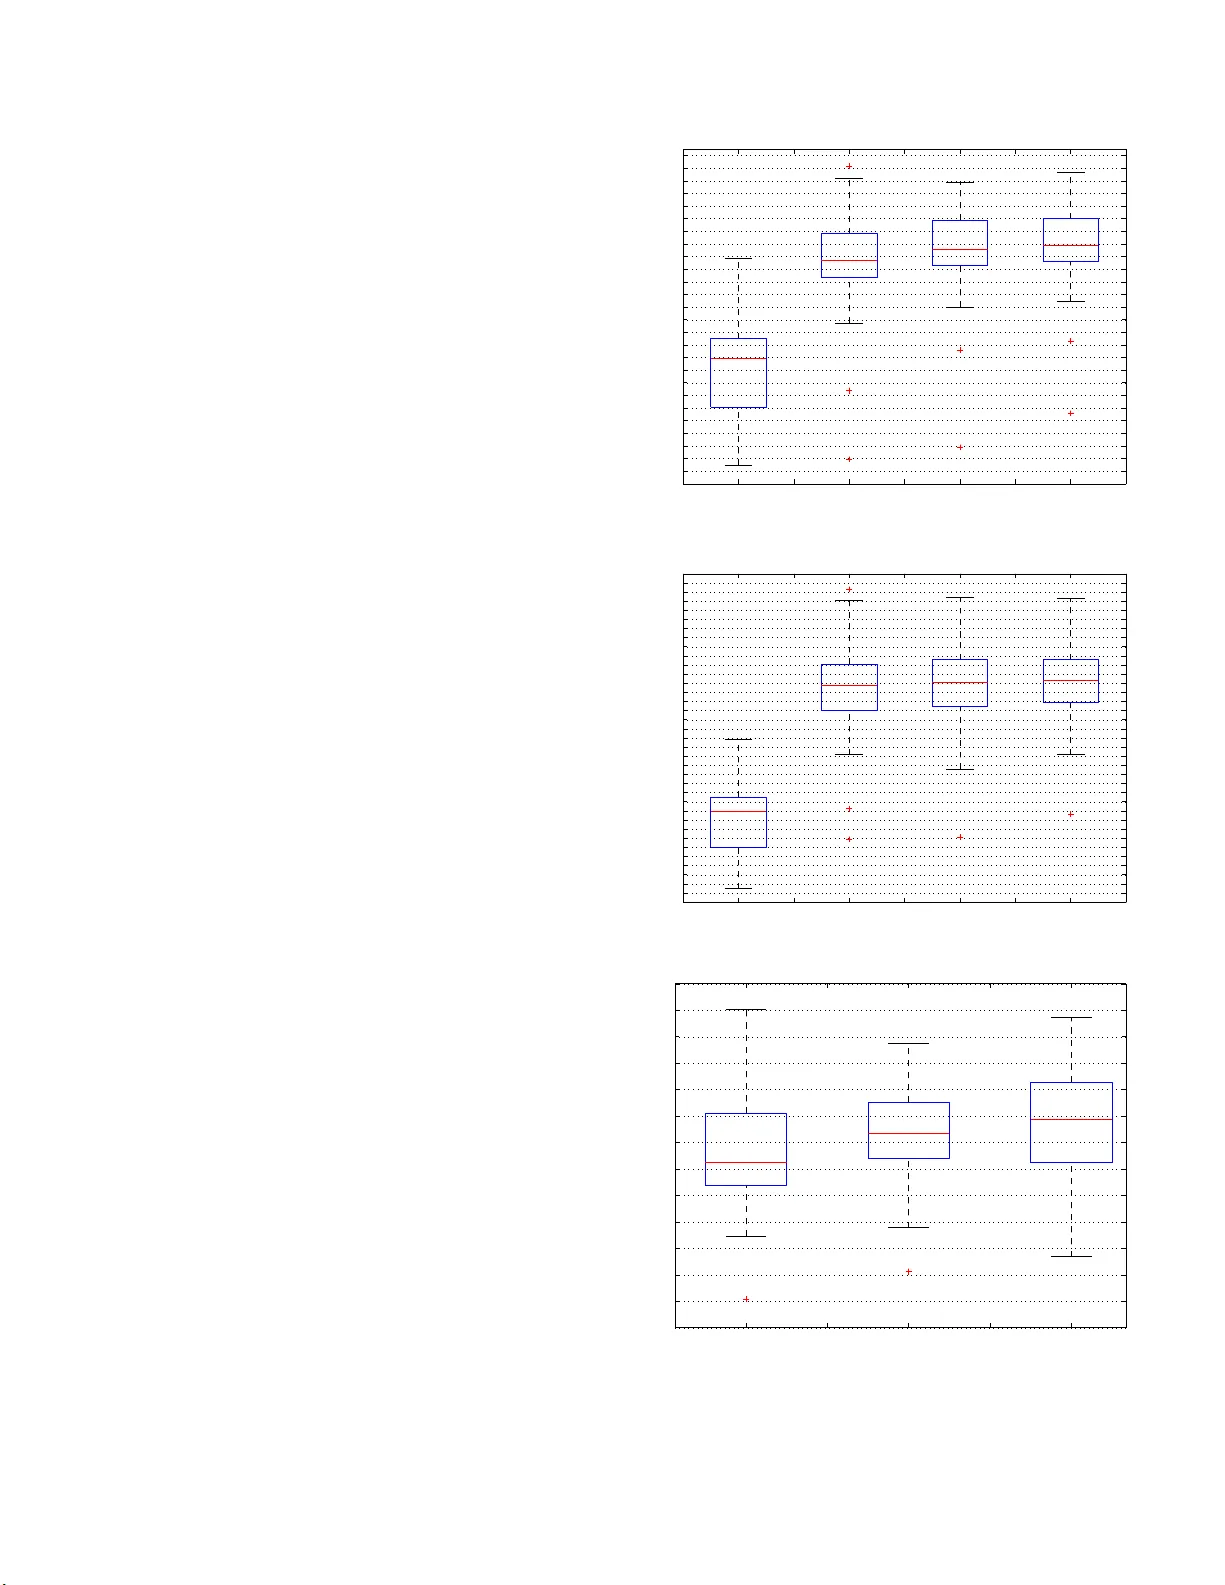
MUL TI-RESOLUTION FULL Y CONV OLUTIONAL NEURAL NETWORKS FOR MON A URAL A UDIO SOURCE SEP ARA TION Emad M. Grais, Hag en W ierstorf, Domini c W ar d, and Mark D. Plumble y Centre for V ision, Speech and Signal Processing Univ ersit y of Surrey , Guildford, UK. ABSTRA CT In deep n eural netw orks with conv olutional layers, each lay er typi- cally has fi xed-size/sing le-resolution recep t ive field (RF ). Con volu- tional layers with a large RF capture global information from t he input features, while l ayers with small RF size capture local details with high resolution from the input features. In this work, we in- troduce no vel deep multi-resolution fully con volutional neural n et- works (MR-FCNN), wh ere each layer ha s dif ferent RF sizes to ex- tract multi-resolution features that capture the global and local de- tails information from it s input features. The proposed MR-FCNN is applied to separate a target audio source from a mixture of many audio sources. Experimental results sho w that using MR-FCNN im- prov es the performance compared to feedforward deep neural net- works (DNNs) and single resolution deep fully con volutional neural networks (FCNNs) on the audio source separation problem. Index T erms — Mu lt i -resolution f eatures extraction, fully con- volution al neural networks, deep learning, audio source separation, audio enhanceme nt 1. INTRODUCTION Monaural audio source separation (MASS) aims to separate audio sources from their mono/single mixture [1–3]. Many deep learning techniques hav e been used before to tackle this problem [4–7]. A v ariety of deep neural netwo rks with con volutional layers have been used recently to tackle the MASS problem [8–14]. One of the main differen ces in those works relies on using either fully con vo- lutional neural networks (FCNN), where all the network layers are con volutiona l layers, or some of the layers are con volutional and oth- ers are fully connected layers. The common aspect in those works is that each con volutional layer composes of a set of filters that have the same r eceptive field (RF) size. The RF is the field of view of a unit (fi lter in the FCNN case) in a certain layer in the netw ork [15]. In the fully connected neural networks (DNN), the output of each unit in a certain layer depends on the entire input to that layer , while the output of a unit in a con volutional layer only depends on a re- gion of t he input, this reg ion in the input is the RF for that unit. T he RF size is a crucial issue in man y audio and visual tasks, as the out- put must respond to areas wit h sizes correspond to the sizes of the differe nt objects/patterns in the input data to extract useful i nforma- tion/features about each object [15]. T he size of the RF equals the size of the filters in a con volution al layer . A large filter size captures the global structure of i t s input features [16, 17]. A small filter size captures the local details with high resolution but it does not cap t ure the global st r ucture of its input features. Intuitiv ely , it might be use- ful to have sets of filters that can extract both the global structures and local details from the input features in each layer . This might be useful in MASS problem, since the input signal is a mixture of dif- ferent audio sources and useful features can be extracted for certain sources in certain time-frequenc y resolutions which may dif fer from one source to another . The concept of extracting multi-resolution features has been pro - posed recently in many applications with different ways of extract- ing and combining the multi-resolution features from t he input data [16, 18–20]. In t his paper , we introduce a nov el multi-resolution fully con volutional neural network (MR-FCNN) model for MASS, where each layer in the MR-FCNN is a con volutional layer that is composed of different sets of filters with dif ferent sizes to extract t he global and local information f r om its input features in each layer in differe nt resolutions. Each set of filt ers has filters wi th the same size which is different than the sizes of the fil ters in the other sets. W e belie ve that, this is the first time that a deep neural netwo rk has been proposed with each layer composed of multi -resolution filters that extract multi-resoltuion features from t he layer before, and it is the first time the concept of extracting multi-resolution features is used for MASS problem. The inputs and outputs of the MR-FCNN are two-dimension al (2D) segments from the magnitude spectrogram of the mixed and t arget source signals respectively . The MR-FCNN in this work is trained t o extract useful spectro-temporal features and patterns in different time-frequenc y resolutions to sepa rate the target source from the input mixture. This paper is organized as follows: Section 2 sho ws a brief in- troduction about the fully con volutional neural networks and the pro- posed MR-FCN N . The proposed approach of using MR-FCNN for MASS is presented in Section 3. The rest of the paper i s for the experimen ts, discussions, and conclusions. 2. MUL TI-RESOLUTION FULL Y CONV OLUTIONAL NEURAL NETWORKS In this section we first give an introduction about the fully con vo- lutional neural network (F CNN) that we use in this study as a core model and then we introduce the proposed MR-FCNN. 2.1. Fully con volutional neural networks The FCNN model that is used here is some what similar to the con volutiona l denoising encoder -decoder (auto-encoder) networks (CDEDs) that was used in [11, 21], but wi thout using eit her down- sampling (pooling) or up-sampling as sho wn in Fi g. 1. The encoder part in the FCNN is composed of repetitions of a con volutional layer and an activ ation layer . Each con volutional layer consists of a set of filters w i th the same si ze to extract features from it s input layer , the activ ation layer is the rectified linear unit (ReLU) that imposes nonlinea ri t y to the feature maps. The FCNN is t r ained fr om corrupted input si gnals and the encoder part is used to extract noise robust features that the decoder can use t o reconstruct a cleaned-up version of the input data [21, 22]. In MASS, the input mixed si gnal can be seen as a sum of the t arget source that needs to be separated and background noise (the other sources i n the mixture). The de- coder part consists of repetitions of a decon volution al (transposed con volution) l ayer and an activ ation layer . The input and ou tput data are 2D signals (magnitude spectrograms) and the filtering is a 2D operator . Fig. 1 : T he ov e rview of the structure of a FCNN that se parates one target source from the mix ed s ignal. Each layer consists of a single set of filters with the same size followed by a rectified linear unit (ReLU) as activation function. The set of filters in the input and output layers hav e large filter sizes and small number of filters. The number of filters increases and the size decreases when getting further from the input and output layers [21]. There is s ymmetric in the filter sizes and numbers of filters between the encoder and decoder sides. 2.2. MR-FCNN Each layer in the FCNN in F ig.1 is composed of one set of filters that have the same RF si ze. The size of t he RF is a very important parameter as the output of each fi l ter must respond to areas with sizes correspond to the sizes of the different objects/patterns in the input to extract useful information/features from the input data [15]. For examp le, if the size of the RF of a fil ter is much bigger than the size of the input pattern, the fi lter will capture blurred features from t he input pa t t erns, while if t he RF of a unit is smaller than the size of the input pattern, the output of the filt er loses the global structure of the input pattern [15]. In audio source separation problems, the spectrogram of the in- put mixed signal usually contains different combinations of differ- ent spectro-temporal patterns from dif ferent audio signals. There are unique set of patterns associated with each source i n the spectro- gram of their mixture and these patterns appear in differen t spectro- temporal sizes and these sizes are source dependent [23]. So, to use the FCNN to ex tr act useful information about the individua l sources in the spectrogram of their mixture, i t might be useful to use filters with different RF sizes i n each l ayer, where the different RF sizes are proportional to the di versity of the spectro-tempo ral si zes of the patterns in t he spectrogram. Bearing these issues in mind, we pro- pose MR-FCNN which is the FCNN sho wn in Fig.1 but with multi- resolution filters (fil t ers with differen t sizes) i n each layer . Thus, each layer in the MR-FCNN has sets of 2 D fi lters. Each set of filters has the same size which is dif ferent than the size of the fil ters in the other sets in t he same layer . Each set of filters generates feature maps with certain time-frequen cy resolution. Fig. 2 sho ws the detail struc- ture for each layer i n the MR-F CNN. Each l ayer in t he MR-FCNN generates multi-resolution features fr om its input features and also combines the multi-resolution features from t he previous layers to generate accurate patterns that compose the structure of the underly- ing data. Fig. 2 : The overview of the proposed s tructure of each layer of the MR-FCNN. K ij denotes the number of filters with size a ij × b ij in set j in layer i . a ij is the dimension in the time direction of the filters and b ij is the dimension in the frequency direction of the filters in set j and layer i . The filters in different s ets have different sizes and the filters within a set hav e the same size. Ea ch s et j in layer i generates K ij feature maps. The number of fea ture maps that each layer i generates equal to the sum of the number of feature maps that all the sets in layer i generate ( P J j =1 K ij ). ReLU denotes a rectified linear unit (ReL U) a s an activation function. 3. MR-FCNN FOR MASS Giv en a mixture of L sources as y ( t ) = P L l =1 s l ( t ) , the aim of MASS is to estimate t he sources s l ( t ) , ∀ l , from the mixed signal y ( t ) [24, 25]. W e work here in the short-time Fourier transform (STFT) domain. Given the STF T of the mixed signal y ( t ) , the main goal is to estimate the STFT of each source in the mixture. In this w ork, we propose to use as many MR-F CNN as t he num- ber of sources to be separated from t he mixed signal. Each MR- FCNN sees the mixed signal as a combination of its target source and background noise. The main aim of each MR-F CNN is to es- timate a clean signal for its corresponding source from the other backgroun d sources that exist in the mixed signal. This is a chal- lenging task for each MR-FCNN since each MR-FCNN deals wi t h highly nonstationary background noise (other sources in the mix- ture). Each MR-FCNN is trained to map the magnitude spectrogram of the mixture i nto the magnitude spectrogram of i ts correspond- ing target source. Each MR-FCNN in t his work is a deep fully 2D multi-resolutional con volutional neural network without any fully connected l ayer , which keeps the number of parameters to be opti- mized for eac h MR-FCNN small. Al so using fully 2D con volutional layers allows neat 2D spectro-temporal representations f or the data through all the layers in the netw ork. The inputs and outputs of the MR-FCNNs are 2D-segments from t he magnitude spectrograms of the mixed and tar get si gnals respecti vely . Therefore, the MR-FCNNs span multiple spectral frames to capture the spectro-temporal char- acteristics of each source. The number of spectral fr ames that each input segment has is N and the number of fr equenc y bins is F . In this work, F i s the dimension of t he whole spectral frame. 3.1. T raining the MR-FCNNs for sour ce separation Let’ s assume we have training data for the mixed signals and their correspondin g clean/target sources. Let Y tr be the magnitude spec- trogram of the mixed signal and S l be the magnitude spectrogram of the clean source l . The subscript “tr” denotes the training data. The MR-FCNN that separates sou rce l from the mixture is tr ained t o minimize the following cost function: C l = X n,f ( Z l ( n, f ) − S l ( n, f )) 2 (1) where Z l is t he actual output of t he last layer of the MR-FCNN of source l , S l is the reference clean output signal for source l , n , and f are the time and frequency indices respecti vely . The input of the MR-FCNNs is the magnitude spectrogram Y tr of the mixed signal. The input and output instants of the MR-F CNN are 2D-segments, where each segment is composed of N consecuti ve spectral frames taken from the magnitude spectrograms. This allows t he MR-FCNN to learn multi-resolution spectro-temporal patterns for each source. 3.2. T estin g the MR-FCNNs fo r source separation Giv en the trained MR-FC N N s, the magnitude spectrogram Y of the mixed signal is passed through the trained MR-FCNNs. The output of the MR-FCNN of source l is the estimate ˜ S l of the spectrogram of source l . 4. EXPERIMENTS W e applied our proposed MASS using MR-F CC approach to sepa- rate the vo i ce/vocal sources from a group of songs from the SiS E C- 2015-MUS-task dataset [26]. The dataset has 100 stereo songs with differe nt genres and instrumentations. T o use the data for the pro- posed MASS approach, we con verted the stereo songs into mono by computing the av erage of the two ch annels for all songs and sources in the data set. Each song is a mixture of vocals, bass, drums, and other musical instruments. W e used our proposed algorithm to sep a- rate the vocal signals from each song. The fi rst 50 songs in the dataset were used as t raining and val- idation datasets to train the MR-FCNN for separation, and the last 50 songs were used for testing. The data were sampled at 44.1kHz. The magnitude spectrograms for the data were calculated using the STFT , a Hanning windo w wit h 20 48 points length and ov erlap inter- v al of 512 was used and the FFT was taken at 2048 points, the first 1025 FFT points only were used as features since the conjugate of the remaining 1024 points are in volved in the first points. For the input and output data for the MR-FCNN, we chose t he number of spectral frames in each 2D-se gment to be 15 frames. This means the dimension of each input and output instant for the MR- FCNN is 15 (time frames) × 1025 (frequenc y bins) as in [11]. Thus, each input and output instant (the 2D-segments from the spectro- grams) spans around 370 msec of the wav eforms of the data. The quality of the separated sources was measured using the signal to distortion ratio (SDR), signal to interference r ati o (SIR) , and signal to art efact ratio (S A R ) [27]. S IR indicates ho w well the sources are separated based on the remaining interference between the sources after separation. SAR indicates the artefacts caused by the separation algorithm in the estimated separated sources. SDR measures the overall distortion (interference and artefacts) of t he separated sources. The SDR v alues are usually considered as t he ov erall performance ev aluation for any source separation approach [27]. Achieving high SDR, S I R, and SAR indicates good separation performance. W e compared the performance of the proposed MR-FCNN model, feedforward deep neural networks (DNNs), and the single FCNN and MR-FCNN model summary The input/output data w i th size 15 fr ames and 10 25 frequ ency bins Layer number FCNN MR-FCNN 1 Con v2D[13,(13,21)] set 1 Con v2D[12,(13,21)] set 2 Con v2D[3,(7,9)] set 3 Con v2D[3,(3,3)] 2 Con v2D[18,(9,13)] set 1 Con v2D[3,(13,21)] set 2 Con v2D[16,(7,9)] set 3 Con v2D[3,(3,3)] 3 Con v2D[24,(7,9)] set 1 Con v2D[3,(13,21)] set 2 Con v2D[12,(7,9)] set 3 Con v2D[7,(3,3)] 4 Con v2D[42,(3,3)] set 1 Con v2D[3,(13,21)] set 2 Con v2D[3,(7,9)] set 3 Con v2D[32,(3,3)] 5 Con v2D[24,(7,9)] set 1 Con v2D[3,(13,21)] set 2 Con v2D[12,(7,9)] set 3 Con v2D[7,(3,3)] 6 Con v2D[18,(9,13)] set 1 Con v2D[3,(13,21)] set 2 Con v2D[16,(7,9)] set 3 Con v2D[3,(3,3)] 7 Con v2D[13,(13,21)] set 1 Con v2D[12,(13,21)] set 2 Con v2D[3,(7,9)] set 3 Con v2D[3,(3,3)] 8 Con v2D[1,(15,1025)] Con v2D[1,(15,1025)] total number of parameters 445,173 558,181 T able 1 : The detail information about the number and sizes of the filters in eac h layer . For e xample “Conv2D[13,(13,21)] ” denotes 2D con volutional laye r with 13 filters a nd the s ize of each filter is 13 × 21 where 13 is the size of the filter in the time-frame direction and 21 in the frequency direction of the spe ctrogram. resolution FCNN in separating t he vocal signals from each song in the test set. The size of each input and output instant is the same in FCNN and MR-F CNN ( 15 × 1025). Each input and output instant of the DNN is a single frame of the magnitude spectrograms of the input and output signals respectiv ely . T able 1 shows the number of layers, the number of filters in each layer , and the size of the filters for the FC NN and MR-FCNN. As in many deep learning models, there are many parameters in the proposed MR-FC N N to be chosen (number of layers, fi lter size, and the number of filters in each set) and usually these choices are data and application depend ent. Choosing the parameters for the FCNN is also not easy . In this work, we follow the same strategy as in [21 ] where t he size of the filter is decreasing and the number of filter is increasing when we go deep in the encoder p art and the oppo- site (the filter size increase s and t he number of the filter dec reases) in the decoder part in t he output direction. For MR-FCNN, the numb er and si ze of the filters in each set in each layer are need to be decided. W e restri cted ourself in this work to use only three sets of filters for the whole network. The first set with size 13 × 21 , the second set with size 7 × 9, and the third set wi th size 3 × 3. Which means each layer has sets of filters with t hree dif ferent resolutions. Also following the same concept in [21] for choosing the number of filters, the layers to wards the input and output layers have more filters with large size than the layers in the middle. T he layers in t he middle have more filters in the set with small fi l ter si ze than the layers to ward the input and output layers. For example, t he first layer in MR-FCNN has a set of 12 filters with size 13 × 21 , a set of 3 filters with size 7 × 9, and a set of 3 filters wit h size 3 × 3. Thus, the fi rst layer generates 18 feature maps with three different resolutions. Each feature mape is 15 × 1025 (the same size of the input and output data). The DNN has three hidden layers wit h ReLU as activ ation f unctions. Each hidden layer has 1025 nodes. The parameters of t he DNN are t uned based on our previous work on the same dataset [28, 29]. T he DNN here has 4,206,600 parameters, the FCNN has 445,173 parameters, and the MR-FCNN has 558,181 parameters. The parameters for all the networks were initialized randomly . All the networks were trained using backpropagation with gradient descent optimization using Adam [30] with parameters: β 1 = 0 . 9 , β 2 = 0 . 999 , ǫ = 1 e − 08 , batch size 100, and a learning rate starts with 0 . 0001 and reduced by a factor of 10 when the valu es of the cost function do not decrease on the validation set for 3 consecutiv e epochs. The maximum number of epochs is 100. W e implemented our proposed algorithm using Keras with T ensorflow back end [31]. T o compare the proposed MR-FCNN model to the FCNN, we tried t o adjust the number of filters and their sizes in each layer of both models to have total number of parameters in both models close to each other as shown in T able 1. Fig.3, sho ws the box-plot of the SDR, SIR, and S AR of the separated vocal sources using three dif- ferent deep learning models, namely DNN, F CNN, and MR-FC N N . The figure also shows the SDR and SIR value s of the target vocal source in the mixed si gnal (denoted as Mix in Fi g.3). W e did not sho w t he SAR of the mixed signal because it is usually very high (around 250 dB) and causes scaling problem in the figure. F rom the figure we can see that the vocal signals in the i nput mixed signal (denoted as Mix in Fig.3) ha ve v ery low SDR and SIR v alues, which sho ws that we are dealing with a very challenging source separation problem. As can be seen from Fig.3, the three methods perform well on t he SDR, SIR, and SAR values of the separated vocal signals. The proposed MR-FCNN model outperforms the two other mod- els in the SDR and SAR v alues. All the models perform similarl y in the SIR. The difference between each pair of models f or al l the sho wn results of SDR and SAR is statisti call y significant with P values as follows. For SDR: P ( DNN , FCNN ) = 2 × 10 − 5 , P ( DNN , MR-FCN N ) = 2 × 10 − 7 , P ( FCNN , MR-F CNN ) = 0 . 0025 . For S AR: P ( DNN , F CNN ) = 7 × 10 − 6 , P ( DNN , MR-FCNN ) = 9 × 10 − 7 , P ( FCNN , MR-FCNN ) = 3 × 10 − 5 . W e con sider the dif- ference between a pair of models statist ically significant if p < 0 . 05 , W ilcoxon signed-rank test [32] and Bonferroni corrected [33]. 5. CONCLUSIONS In this work we propo sed a new approach for monaural audio source separation (MASS). The new approach i s based on using deep multi-resolution fully con volutional neural networks (MR-FCNN). The MR-FCNN l earns unique multi-resolution patterns for each source and uses this information to separate the related compone nts of each source from the mixed signal. The experimental r esults indicate that using MR-FCNN for MASS i s a promising approach and can achiev e better results than the feedforward neural networks and the single resolution FCNN. In our future work, we will inv estigate the possibility of apply- ing the MR-FCNN on r aw audio data (ti me domain signals) to ex- tract multi-resolution time-fr equency features that can represent the input data better than the S TFT features. Some audio sources re- quire higher resolution in the time than in the frequenc y , and other audio sources require the opposite resolution of that. By applying MR-FCNN on the raw audio data, we hope t o extract useful fea- tures for each source according to its preferred time-frequenc y reso- lution which can improve the performance of any audio processing approach. 6. A CKNO WLEDGEMENTS This wo rk is supported by grants EP/L027119/1 and EP /L027119/2 from the UK Engineering and Physical S ci ences Research Council (EPSRC). Mix DNN FCNN MR−FCNN −18 −16 −14 −12 −10 −8 −6 −4 −2 0 2 4 6 8 Models SDR in dB (a) SDR in dB Mix DNN FCNN MR−FCNN −18 −14 −10 −6 −2 2 6 10 14 18 Models SIR in dB (b) SIR in dB DNN FCNN MR−FCNN −4 −2 0 2 4 6 8 SAR in dB (c) SAR in dB Fig. 3 : (a) The SDR, (b) the SIR, and (c) the SAR (values in dB) for the s eparated vocal signals of using deep fully connected feedforward ne ural networks (DNNs), using deep fully conv olutional neural networks (FCNNs), a nd the proposed multi-resolution fully convolution a l neural ne tworks (MR-FCNN). ”Mix“ denotes the input mixed signal. 7. REFERENCES [1] X. Zhang and D. W ang, “Deep ensemble learning for mona ural speech separation, ” IEEE /ACM Tr ans. on audio, speech, and langua ge pr ocessing , vol. 24, no. 5, pp. 967–97 7, 2016. [2] E. M. Grais and H. Erdogan, “S ource separation using regu- larized NMF with MMSE estimates under GMM priors with online learning for the uncertainties, ” Digital Signal Pr ocess- ing , vol. 29, pp. 20–34, 2014. [3] T . V irtanen, “Monaural sound source separation by non- negati ve matrix factorization with temporal continuity and sparseness criteria, ” IEE E T rans. on Audio, Speech, and L an- guag e Processing , vol. 15, pp. 1066–1074 , Mar . 2007. [4] S . I. Mimilakis, K. Drossos, T . V irtanen, and G. Schuller , “A recurrent encoder -decoder approach with skip-fil tering connections for monaural singing voice separation, ” in arXiv:1709.006 11 , 2017. [5] E. M. Grais, G. Roma, A. J. Simpson, and M. D. Plumbly , “T wo stage single channel audio source separation using deep neural networks, ” IEEE/ACM T rans. on Audio, Speech, and Langua ge Pr ocessing , vol. 25, no. 9, pp. 1469–1 479, 2017. [6] Y . W ang and D. W ang, “A structure-preserving training targ et for supervised speech separation, ” in Pr oc. ICASSP , 2014, pp. 6148–6 152. [7] E. M. Grais, G. Roma, A. J.R . Simpson, and M. D. P lumbley , “Discriminativ e enhancement for single channel audio source separation using deep neural networks, ” in P r oc. L V A/IC A , 2017, pp. 236–246. [8] P . Chandna, M. Miron, J. Janer , and E. Gomez, “Monoaural audio source separation using deep con volutional neural net- works, ” in Pr oc. L V A/ICA , 2017, pp. 258–266. [9] S . V enkatarama ni, Y . C. Subakan, and P . Smaragdis, “Neu- ral n etwork alternativ es to con volutiv e audio models for source separation, ” in Pro c. MLSP , 2017. [10] S. V enkataramani and P . Smaragdis, “End-to-end source sepa- ration with adaptiv e front-ends, ” in Pr oc. W ASP AA , 2017. [11] E. M. Grais and Mark D. Plumbly , “Single channel au- dio source separation using con volutional denoising autoen- coders, ” in Pro c. GlobalSIP , 2017. [12] M. Miron, J. Janer , and E. Gomez, “Monaural score-informed source separation for classical music using conv olutional neu- ral networks, ” in Proc . ISMIR , 2017. [13] W . Lim and T . Lee, “Harmonic and percussi ve source separa- tion using a con volutional auto encoder , ” in Proc. EUSIPCO , 2017. [14] S. Fu, Y . Tsao, X . Lu, and H. Kawais, “End-to-end wave- form utterance enhancement for direct ev aluation metrics optimization by fully con volutional neural networks, ” in arXiv:1709.036 58 , 2017. [15] L. W enjie, L. Y ujia, U. Raquel, and Z. Richard, “Understand- ing the effecti ve receptiv e fi eld in deep con volutional neural networks, ” in Pr oc. NIPS , 2016, pp. 4898–4906. [16] J. Kawah ara and G. Hamarneh, “Multi-resolution-tract CNN with hybrid pretrained and skin-lesion trained layers, ” in Pr oc. MICCAI MLMI , 2016, vol. 10019, pp. 164–171. [17] Y . T ang and A. Mohamed, “Mu l t iresolution deep belief net- works, ” in Pr oc. AIST A T S , 2012. [18] Q. Zhang, D . Zhou, and X. Zeng, “HeartID: a multiresolution con volutiona l neural network for ECG-based biometric hu man identification in smart health applications, ” IEEE Access, Spe- cial Section on Body Ar ea Networks , pp. 11805 –11816, 2017. [19] W . Xue, H. Zhao, and L. Zhang, “Encoding multi-resolution two-stream cnns for action recognition, ” in P r oc. ICONIP , 2016, pp. 564–571. [20] N. Naderi and B. Nasersharif, “Multiresolution con volutional neural network for robust speech recognition, ” in Pr oc. ICEE , 2017. [21] S. R . Park and J. W . Lee, “A fully con volutional neural network for speech enhancement, ” in Pr oc. Intersp eech , 2017 . [22] M. Zhao, D. W ang, Z. Zhang, and X. Zhang, “Music remov al by con volutional denoising autoencoder in speech recogni- tion, ” in In pr oc. APSIP A , 2016 . [23] M. Davy A. Klapuri, Signal Process i ng Methods for Music T ranscription , S pringer , 2007. [24] E. M. Grais, I . S . T opkaya, and H. Erdogan, “Audio- V isual speech recognition with background music using single- channel source separation, ” in Pr oc. SIU , 2012. [25] E. M. Grais and H. Erdogan, “Spectro-temporal post- enhanceme nt using MMSE estimati on in NMF based single- channel source separation, ” in Pr oc. InterSpeec h , 2013. [26] N. Ono, Z. R afi i, D. Kitamura, N. It o, and A. Liutkus, “The 2015 signal separation ev aluation campaign, ” in Pro c. L V A/ICA , 2015, pp. 387–395. [27] E. V incent, R. Gr ibon v al, and C. Fevo tt e, “Performance mea- surement in blind audio source separation, ” IEEE T rans. on Audio, Speech, and Langua ge P r ocessing , vol. 14, no. 4, pp. 1462–6 9, July 2006 . [28] E. M. Grais, G. Roma, A. J. R. Simpson, and M. D. Pl umbley , “Single chan nel audio source separation usin g deep neural net- work ensembles, ” i n Proc. 140th Audio E ngineering Society Con vention , 2016. [29] E. M. Grais, G. Roma, A. J. R. Simpson, and M. D Pl umbley , “Combining mask estimates for single channel audio source separation using deep neural networks, ” i n Prec. InterSpeech , 2016. [30] D. P . Kingma and J. Ba, “Adam A method for stochastic opti- mization, ” in Proc. ICLR , 201 5. [31] F . Chollet, “Keras, https://github .com/fchollet/keras, ” 2015 . [32] F . Wilcoxon, “Indi vidual comparisons by ranking methods, ” Biometrics Bulletin , vol. 1, no. 6, pp. 80–8 3, 1945. [33] Y . Hochber g and A. C . T amhane, Multiple Comparison Pr oce- dur es , John W i l ey and Sons, 1987.
Original Paper
Loading high-quality paper...
Comments & Academic Discussion
Loading comments...
Leave a Comment