Feasibility Study of OFDM-MFSK Modulation Scheme for Smart Metering Technology
The Orthogonal Frequency Division Multiplexing based M-ary Frequency Shift Keying (OFDM-MFSK) is a noncoherent modulation scheme which merges MFSK with the OFDM waveform. It is designed to improve the receiver sensitivity in the hard environments whe…
Authors: Ghaith Al-Juboori, Angela Doufexi, Andrew R. Nix
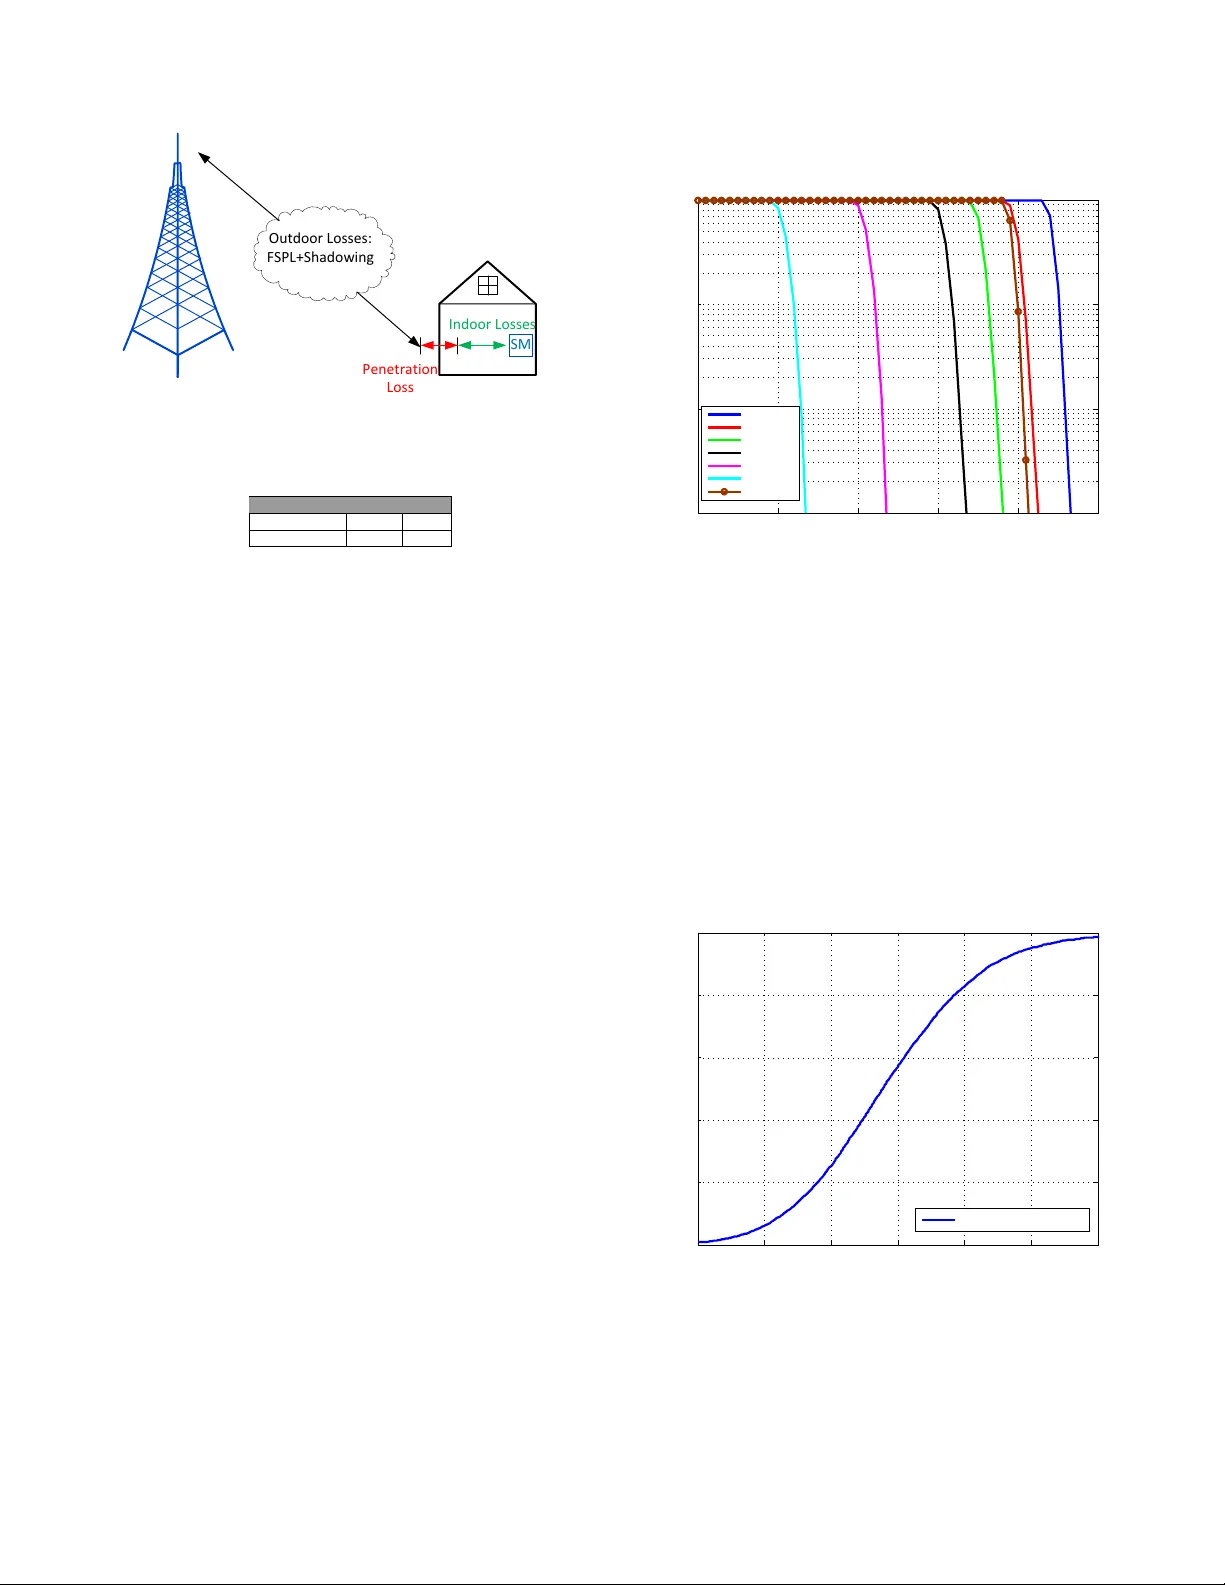
Feasibility Study of OFDM-MFSK Modulation Scheme for Smart Metering T echnology Ghaith Al-Juboori, Angela Doufexi and Andre w R. Nix Communication Systems and Networks Group-Department of Electrical and Electronic Engineering Uni versity of Bristol, Bristol, United Kingdom. Email: Ghaith.al-juboori, a.doufexi, Andy .nix@bristol.ac.uk Abstract —The Orthogonal Frequency Di vision Multiplexing based M-ary Frequency Shift Keying (OFDM-MFSK) is a non- coherent modulation scheme which merges MFSK with the OFDM wa veform. It is designed to impr ove the receiv er sensitivity in the hard en vironments wher e channel estimation is very diffi- cult to perform. In this paper , the OFDM-MFSK is suggested for the smart metering technology and its performance is measured and compar ed with the ordinary OFDM-BPSK. Our r esults show that, depending on the MFSK size value ( M ), the Packet Error Rate (PER) has dramatically improved for OFDM-MFSK. Additionally , the adaptive OFDM-MFSK, which selects the best M value that gives the minimum PER and higher throughput for each Smart Meter (SM), has better coverage than OFDM-BPSK. Although its thr oughput and capacity are lower than OFDM- BPSK, the connected SMs per sector are higher . Based on the smart metering technology requirements which imply the need for high coverage and low amount of data exchanged between the network and the SMs, The OFDM-MFSK can be efficiently used in this technology . Index T erms — OFDM-MFSK; Smart Meters; Non-coherent de- tection; IoT . I . I N T RO D U C T I O N The smart metering is one of the significant technologies that will be used to effecti vely manage energy systems in the future. This technology will provide ne w information and services for both energy companies and consumers which lead to reduce costs and carbon emissions. By 2020, the number of installed smart meters (electricity , gas, and water) is projected to rise to 1.6 billion [1]. In general, the smart meter (SM) is defined as an element of two-way communication between the domestic meter and the utility pro vider to effecti vely gather details energy usage information [2]. The radio cov erage for this technology represents an essen- tial consideration due to installing these meters in challenging communication en vironments and also the need for getting near 100% cov erage. Moreover , low cost and lo w po wer consumption smart metering de vices also represent significant requirements for this technology . Additionally , the amount of the exchanged data between the SMs and the network is relativ ely low and can be classified to fall into the category of Internet of Things (IoT) applications [3]. Man y studies, such as [3] & [4], studied different av ailable techniques and suggested a certain solution for this technology . The non-coherent detected M -ary Frequency Shift Keying (MFSK) in conjug ation with Orthogonal Frequency Division Multiplexing (OFDM) wa veform (OFDM-MFSK) was sug- gested as a rob ust transmission technique in the hard en viron- ments as the fast fading channels and high-speed applications such as high-speed trains [5]. This method does not need equalisation and channel estimation processes; this leads to a very simple & lo w-cost receiver structure. Furthermore, the OFDM-MFSK technique giv es a high receiver sensitivity , as it is illustrated in section-II. In this paper , we studied the ability to apply OFDM- MFSK as a solution for the smart metering technology and compared its performance with the ordinary OFDM-BPSK in different cases and scenarios. The comparison includes the Packet Error Rate (PER), throughput, cov erage and capacity performance for both of them. The remainder of this paper is sorted as follo ws: section-II gives a brief description of the OFDM-MFSK technique. Details about the modelling approach, assumptions and the channel model are provided in section-III. In section-IV , the performance analysis and results are sho wn for both modulation techniques. Finally , conclusions are drawn in the section-V . I I . O F D M - M F S K O V E RV I E W The MFSK is a famous modulation scheme which is used to get the robust transmission in the hard en vironments. The OFDM-MFSK is an integration between OFDM and MFSK which allows to group M sub-carriers into a subset and applies MFSK to each one of these subsets (groups). The non-coherent detection is permitted in this modulation scheme which is needed for many scenarios where no channel estimation is required such as fast fading en vironments [5]. The basic concept of the OFDM-MFSK modulation scheme, using M =4, is sho wn in Fig. 1. For simplicity , MFSK & BPSK are used to refer for OFDM-MFSK & OFDM-BPSK respectiv ely in the remainder of this paper . Each group of sub-carriers, four in this case, are gathering into a subset. In each subgroup, only one sub-carrier is chosen for transmission whereas no energy is transmitted on the other sub-carriers. The selection of the activ e sub-carrier in each subset depends on the data bits. As illustrated in Fig.1, l og 2 ( M ) bits, 2 bits in this case, are allocated for each subset using Grey code. S u b - c a r r i e r s 0 0 0 0 0 1 0 1 1 1 1 1 1 0 1 0 S u b s e t n S u b s e t n + 1 Fig. 1. Basic concept of the OFDM-4FSK modulation scheme. This modulation scheme is engineered to improve recei vers sensitivity; howe ver , this improvement is at the expense of the bandwidth efficiency . In MFSK, the higher the value of M , the better the receiver sensitivity but at the cost of lower spectral efficiency . the MFSK bandwidth utilisation equals to log 2 ( M ) / M whereas it equals to l og 2 ( M ) for M-QAM [5]. Ho wev er , this reduces the spectral ef ficiency , and this represents the main disadv antage of MFSK. Sev eral methods were proposed to tackle this issue such as the hybrid transmission method where additional data can be sent by exploiting the phase of the occupied sub-carriers. This is done by combining MFSK (OFDM-MFSK) with the Differential Phase Shift Keying (DPSK) [6]. This combination is allo wed because MFSK, non-coherent detection scheme, permits a random phase selection for all the occupied sub- carriers in the transmitter . Additionally , an another method to exploit this degree of freedom (the random phase of the occupied sub-carriers) to reduce the Peak-to-a verage po wer ratio (P APR) was proposed in [7]. Channel coding coupling with an interlea ver is used to mitigate the channel effects such the frequency selective effect which can lead to entirely fade some sub-carriers and produce an error floor . T o get the best performance, the soft decision detection is used to provide a degree of reliability for each bit to the decoder . An appropriate log-likelihood metric for the n th bit of a coded symbol in a transmission is calculated, as follows, based on the components of the receiv ed vector r i : L n = max i ∈ S 1 n | r i | 2 − max i ∈ S 0 n | r i | 2 . (1) S 0 n is the subset of all components indicators where the code symbols hav e ”0” at the n th digit of the bit mapping. Accordingly , there is a ”1” at the n th digit of the bit mapping in the other case ( S 1 n ) [6]. I I I . S I M U L A T I O N A P P RO AC H A. Modelling Appr oac h and Assumptions The block diagram of the approach used for modelling MFSK & BPSK based on the L TE-A like parameters for smart metering applications is shown in Fig 2. The main two components are the coverage and capacity analysis since we focus on co verage and capacity in the comparison between MFSK and BPSK modulation schemes. The coverage analysis estimates the max cov erage radius and the outage probability based on the parameters of the modulation type and channel propagation model. On the other hand, the capacity analysis estimates the aggregate throughput of a sector and also the av erage capacity per SM based on the density of these SMs and L TE parameters. Based on the deplo yment en vironment (urban & rural), the channel propagation model is calculated and used for both analyses, as illustrates in the following sub- section. The 3GPP macro-cellular deployment with unity frequency reuse factor is performed. There are three sectors in each cell with cell radius, diameter and Inter-Site Distance (ISD) equal to R, 2R & 3R respectively [8]. The SMs are randomly and uniformly distrib uted in the cell at a distance between 50 m and the max cell diameter from the BS. An operating frequency of 900 MHz and a bandwidth of 3MHz were assumed. The main parameters in this study are listed in T able-I. D e p l o y m e n t P a r a m e t e r s I n p u t s C h a n n e l P r o p a g a t i o n M o d e l C o v e r a g e A n a l y s i s C a p a c i t y A n a l y s i s L T E - l i k e P a r a m e t e r s A g g r e g a t e S e c t o r T h r o u g h p u t A v a i l a b l e C a p a c i t y p e r S M O u t a g e P r o b a b i l i t y M a x . C o v e r a g e R a d i u s Fig. 2. Block diagram of the modelling approach. T ABLE I. S I MU L A T I O N P AR A M E T ER S . Parameter V alue Transmission Power (DL) 32dBm Peak Antenna Gain 12 dBi Noise Figure 5 dB Base Station (BS) Antenna T ype As it is mentioned in [8] Transmission Power (UL) 24 dBm Antenna Gain 0 dBi Noise Figure 9 dBm Smart Meter (SM) Antenna T ype Omnidirectional Uplink (UL) 3 MHz Bandwidth Downlink (DL) 3 MHz Urban-Macro R=250, 500, 750, 1000 m En vironment & Cell Radius Rural-Macro R=2, 4, 6, 8, 10 km Carrier Frequency 900 MHz BS-SM distance 50-Max cell diameter. MFSK M=2, 4, 8, 16, 64, 256 Modulation Scheme BPSK ordinary BPSK Channel Coding LDPC [9] Coding Rate 1/2 Input Data Block Size 204 bits OFDM Symbol Size 256 Cyclic Prefix 32 Number of the SMs per cell (K) Depends on the SMs’ density and the cell’ s radius (See (7)) B. Channel Model Fig. 3 illustrates the end to end radio link in the smart metering system. It is clear that a signal incurs different fading and losses during its travel in the different environments. The total losses ( L total ) for each link can be expressed as follows: L total = L outdoor − losses + L penetration + L indoor − losses . (2) Based on the channel propagation model in [8], the outdoor losses, L outdoor − losses in dB, with a distance d (in km) can be modelled as: L outdoor − losses = L o + 10 ´ nlog 10 ( d ) + X, (3) where L o & ´ n are the path loss reference and exponent respectiv ely , and their v alues depend on the en vironment as shown in the T able-II. X represents the shadowing loss which can be expressed as a log-Normal distribution variable with a standard de viation of 10 dB [10]. In this study , the penetration loss L penetration and indoor loss L indoor − loss are chosen to be 12 & 8 dB respectively [4]. Additionally , only one w all is assumed to e xist in each link between the BS and SM. S M O u t d o o r L o s s e s : F S P L + S h a d o w i n g P e n e t r a t i o n L o s s I n d o o r L o s s e s Fig. 3. End to end radio link losses in smart metering system. T ABLE II. P AT H L O SS P AR A M E TE R S AT 9 0 0 M H Z . En vironment L o ´ n Urban Area 120.9 3.76 Rural Area 95.5 3.41 Based on the path loss and device parameters, the recei ved power and the signal to noise ratio (SNR) can be calculated as: P rx = P tx + G tx + A rad − L total + G rx . (4) P tx represents the transmit power in dBm, G tx and G rx are the transmit and received antenna gains in dBi, and A rad is the BS antenna radiation pattern in dB as sho wn in [8]. The SNR (in dB), can be expressed as: S N R = P rx − P N , (5) where P N is the noise power in dBm and it can be expressed as: P N = − 198 . 6 + 10 log 10 ( B T ) + F , (6) where B is the bandwidth, T is the temperature in K elvin, and F is the device noise figure. The number of SMs in each sector is determined as follows: N o.of S M s = ρπ R 2 . (7) R is the cell radius in km, and ρ is the SMs’ density (i.e., the No. of SMs per square km), and it’ s equal to 2000 S M /k m 2 and 10 S M /k m 2 in the urban and rural scenarios respecti vely [10]. I V . R E S U LT S A N D A NA LY S I S A. P erformance Comparison in A WGN Channel Fig. 4 illustrates the PER v ersus SNR performance for MFSK with different M values and the BPSK in A WGN channel, for more information about parameters refer to T able- I. As it is seen, the MFSK performance ov ercomes BPSK especially at high values of M ( M ≥ 8 ) while the MFSK performance becomes worse as M decreases ( M ≤ 4 ). Moreov er , a remarkable SNR gain, between 1.7 to 14 dB, can be seen in the MFSK modulation scheme with M ≥ 8 compared to BPSK (in Rayleigh channel the dif ference is between 0-11 dB see [11]). This gain will lead to significant improv ements in the smart meter applications, as it will be seen in the following sub-sections. This graph is also used to determine the threshold SNR v alues required to achieve PER lev els equal to 1 × 10 − 3 for both modulation schemes in this paper . −20 −15 −10 −5 0 5 10 −3 10 −2 10 −1 10 0 SNR BLER MFSK:M=2 MFSK:M=4 MFSK:M=8 MFSK:M=16 MFSK:M=64 MFSK:M=256 OFDM−BPSK Fig. 4. PER performance for MFSK (with different M ) and BPSK in A WGN channel. B. System Le vel P erformance in Urban Uplink Scenario In this subsection, the system lev el performance of the MFSK modulation scheme with dif ferent M v alues is mea- sured and compared with the BPSK performance in term of PER and throughput in an urban uplink scenario with cell radius equals to 500m, using the channel model as explained in section III. Fig. 5 depicts the Cumulativ e Distribution Function (CDF) of the SMs’ SNR in this case. This figure shows the need to a robust communication scheme in this technology to achiev e a good cov erage due to the fact that 6% of the SMs hav e SNRs less than -10 dB and around 25% of them ha ve SNRs less than 0 dB. −20 −10 0 10 20 30 40 0 0.2 0.4 0.6 0.8 1 SNR (dB) Prob. (SNR<= abscissa) SNR−R=500m−UL Fig. 5. CDF of the SMs’ SNR for uplink urban scenario R=500m. Fig. 6 sho ws the CDF of the PER for the SMs in this case. It is clear that more than 95% of the SMs, in the MFSK- M = 256 case, hav e PER values less than or equal to 1 × 10 − 3 and this percentage decreases as M declines to reach just below 65% in case M = 2 . On the other hand, in the case of ordinary BPSK, around 72% of the SMs have this PER value. Also, it is 10 −3 10 −2 10 −1 10 0 10 1 0.65 0.7 0.75 0.8 0.85 0.9 0.95 1 PER Prob.(PER<=abscissa) M=2 M=4 M=8 M=16 M=64 M=256 BPSK Fig. 6. CDF of the SMs’ PER with MFSK & BPSK modulation schemes. interesting to note that MFSK with M ≥ 16 has a remarkable PER dif ference when comparing with BPSK. 0 0.5 1 1.5 2 2.5 x 10 6 0 0.1 0.2 0.3 0.4 0.5 0.6 0.7 0.8 0.9 1 Throughput Prob.(Thu<=abscissa) M=2 M=4 M=8 M=16 M=64 M=256 BPSK MFSK−adaptive Fig. 7. CDF of the SMs’ throughput with different modulation schemes. Fig. 7 shows the CDF of the throughput for the SMs in this case. W e can observe that around 97% of the SMs hav e the max throughput in case of MFSK- M =256 and this percentage value decreases as M decreases. Additionally , in the MFSK case, it is clear that maximum throughput decreases with in- crease M. The maximum throughputs are (892, 892, 672, 448, 168, 56) Kbps for M =2, 4 , 8, 16, 64, 256 respecti vely whereas it equals to 1.792 Mbps in the BPSK case. These results agree with the fact that the MFSK modulation scheme is designed to impro ve the receiv er sensiti vity and this improv ement is at the cost of the bandwidth ef ficiency . Additionally , Fig. 7 also depicts the CDF of the throughput of the adaptiv e MFSK scheme in which for each SM the lo west v alue for M that permits PER lev el less than or equal to 1 × 10 − 3 is chosen. The adaptive MFSK is already used when comparisons with BPSK in cov erage and capacity analyses are performed. C. Coverage Analysis The coverage analysis is used to determine the maximum cell diameter (or radius) that satisfies a particular performance T ABLE III. M A X C E LL D I A ME T E R I N K M . MFSK variable or En viron. T ype M=256 M=64 M=16 M=8 M=4 M=2 BPSK Thresh. SNR -13.25 -8.25 -3.25 -0.75 1.25 2.9 0.75 Urban Environ. 1.85 1.36 1 0.85 0.76 0.69 0.78 Rural Environ. 10.94 7.8 5.57 4.7 4.11 3.68 4.25 criterion, such as maximum outage probability . In this study , as in [10], the applied coverage criterion is that the median SNR in the uplink case is equal or greater than that desired by the lowest most robust case, in the adaptive MFSK it represents MFSK with M = 256 . The choice of the uplink case because it has less transmission power compared to the downlink case which leads to more limiting. The maximum cell diameter can be written as: D max = max n d : S N R ( d ) ≥ γ o o , (8) where γ o is the minimum desired SNR to achiev e a PER of 1 × 10 − 3 when using the lo west most robust MCS. Based on the threshold values for MFSK with different M and BPSK which were obtained from Fig. 4, T able-III illustrates the max cell diameter for each case. It is clear that the cell cov erage in the rural environment is larger than that in the urban en vironment, the reason for that is the lower losses in the first scenario compared to the second. The outage probability represents a substantial factor for the performance assessment of the wireless systems, and it measures the failing probability to achiev e a specified SNR value required for a particular service, it can be expressed as [12]: P r . outag e = P r [ S N R ≤ γ o ] (9) Fig. 8 & 9 sho w the outage probability for the urban and rural en vironments respectively . It is interesting to note that the adaptiv e MFSK has lower outage probability (higher coverage) than BPSK for uplink and downlink in both en vironments. Based on the traditional coverage network condition which allows to only 5% outage probability , the adaptive MFSK doubles the cov erage from 300 m, in the BPSK, to 600 m. Furthermore, depend on the above condition in the rural en vironment, the adaptiv e MFSK has a coverage of 3 km, whereas BPSK has a coverage of 0.75 km. This means that MFSK has four times higher cov erage than BPSK. Moreov er , the results show that MFSK can be used in the ultra reliable applications where 99.99% coverage condition need to be achiev ed in the urban scenario with a cell radius of 350 m, while BPSK fails to achieve this condition. Additionally , the difference between the downlink & uplink cases increases with increase the cell radius in both en vironments. This happens due to increase the losses as increase the distance in both cases while the transmit po wer is higher in the downlink case. Finally , for the same value of the outage probability , the rural en vironment has a cov erage range that far exceeds the urban due to its lo wer losses. D. Capacity Analysis In this sub-section, we aim to predict the aggregate throughput per sector and the available throughput per SM for the adaptiv e MFSK and compared the results with BPSK as sho wn in the following: 0.2 0.4 0.6 0.8 1 0 0.1 0.2 0.3 0.4 0.5 0.6 0.7 Cell Radius (km) Outage Probability MFSK−DL BPSK−DL MFSK−UL BPSK−UL Fig. 8. Outage probability in the urban en vironment. 0 2 4 6 8 10 0 0.1 0.2 0.3 0.4 0.5 0.6 0.7 0.8 0.9 Cell Radius (km) Outage Probability MFSK−UL MFSK−DL BPSK−UL MFSK−DL Fig. 9. Outage probability in the rural en vironment. 1) Sector Capacity: The average data rate per a sector can be ev aluated based on the probabilities that each MFSK with a certain M (i.e., MCS) is in use and their corresponding achiev able data rate. The probability that MFSK with certain M is in use can be calculated from the statistics of the received SNR in each scenario. The SNR values alter for different SMs due to different variables and assumptions such as the link distance, shadowing loss and the scenario type. The probability that the SNR values lie between the minimum SNR v alue desired by a gi ven MCS and the SNR value desired by the next MCS is measured as follows: P M C S ( i ) = P r [ γ o,M C S ( i ) ≤ S N R < γ o,M C S ( i +1) ] (10) The total aggregate data rate (sector capacity) is obtained by applying the follo wing relation: C total = X i C M C S ( i ) P M C S ( i ) , (11) where C M C S ( i ) is the data rate obtained when using the MCS(i) (i.e., MFSK with certain M v alue). This result repre- sents the upper band of the achiev able throughput due to the assumptions such as data is always a vailable to send and the actual throughput may be lower because of the retransmission process and under-utilisation of the resource blocks [10]. 2) A vailable capacity per SM: T o predict the av ailable ca- pacity per SM, the minimum time interval between successive messages ( t min ) and the av erage message size need to be identified. Based on [10], the SM message sizes for downlink & uplink are selected to be 25 & 2133 bytes, and 42 bytes as an ov erhead per each message is assumed. T o calculate t min , the transport blocks number needed to send a message requires being determined. If T B s i is the transport block size for the MFSK with a certain M (MCSi), then the transport block number needed to send a message with length L bits equals: N i = d messag e l ength ( L ) T B s i e . (12) Then, the average of the total number of transport blocks ( N T B ) required to the all SMs ( K ) in the sector to send or receiv e a message can be expressed as [10]: N T B = K X i P M C S ( i ) N i . (13) Next, t min is determined as: t min = N T B R T B , (14) where, R T B is the rate of the transport block, which is equal to 21000 transport block per second in this paper (3MHz L TE- A like system is assumed). Ultimately , the upper bound of the av ailable capacity per SM can be e valuated by dividing the message size to t min . 1000 1178 (BPSK) 1523 (Addaptive MFSK) 1750 0 0.5 1 1.5 No. of connected SMs per Sector Aggregate Sector Throughput (Mbps) 0 50 100 150 200 250 300 Avaiable Capacity per SM (bps) Aggregate Sector Throughput Avaiable Capacity per SM Fig. 10. Capacity analysis for the uplink urban case with R= 0.5 km. Fig. 10 & 11 illustrate the aggregate sector throughput and the a vailable capacity per SM versus the number of connected SMs per sector for 0.5 km urban & 4 km rural uplink cases respectiv ely . It is clear that the aggre gate sector throughput and the av ailable capacity per SM, in the adaptiv e MFSK case, decrease by around 46% & 81% in the urban case and by 38% & 91% in the rural case compared to the BPSK modulation scheme. Ho wev er , the numbers of the connected SM per sector , in the adaptiv e MFSK, significantly increase by approximately 30% & 75% in the urban and rural cases compared to BPSK. 100 261 (BPSK) 457 (Addaptive MFSK) 0 0.1 0.2 0.3 0.4 0.5 0.6 0.7 0.8 0.9 1 No. of Connected SMs per Sector Aggregate Sector Throughput (Mbps) 0 100 200 300 400 500 600 700 800 900 1000 Available Capacity per SM (bps) Average Sector Throughput Available Capacity per SM Fig. 11. Capacity analysis for the uplink rural case with R= 4 km. T ables-IV-VII show the aggreg ate sector throughput (Mbps), the av ailable capacity per SM (bps) and the number of connected SMs per sector for uplink and downlink in the urban and rural cases respecti vely . Based on the results of all cases, the higher the cell radius, the lo wer the sector capacity and av ailable capacity per SM. The reason for that is as the cell radius increases, a fraction of the cell area suffers from lower SNR increases. Finally , the dif ference in the sector throughput between both modulation schemes dramatically decreases as the cell radius increases for all cases. T ABLE IV . C A PAC I T Y A NA LYS I S F O R U P L I NK U R BA N S C E NA R I O . Cell radius (km) 0.25 0.5 0.75 1 MFSK Agg. Sec Th.(Mbps) 0.872 0.723 0.558 0.43 A v al. Cap. per SM(bps) 265.64 39.39 11.36 5.38 No. of Connected SMs 392 1523 3143 4961 BPSK Agg. Sec Th.(Mbps) 1.72 1.34 0.91 0.65 A v al. Cap. per SM(bps) 669.6 214 139.9 111.46 No. of Connected SMs 376 1178 1801 2261 T ABLE V . C A PAC I T Y A NA LYS I S F O R D O WN L I N K U R BA N S C E NA R IO . Cell radius (Km) 0.25 0.5 0.75 1 MFSK Agg. Sec Th.(Mbps) 0.882 0.793 0.661 0.534 A v al. Cap. per SM(bps) 318.1 45.53 13.9 6.09 No. of Connected SMs 392 1554 3320 5526 BPSK Agg. Sec Th.(Mbps) 1.76 1.49 1.15 0.88 A v al. Cap. per SM(bps) 651.11 191.95 110.65 81.29 No. of Connected SMs 384 1303 2260 3077 T ABLE VI. C A P AC I T Y A NA LY SI S F O R U P LI N K R UR A L S C E NA R I O . Cell radius (km) 2 4 6 8 10 MFSK Agg. Sec Th.(Mbps) 0.808 0.578 0.409 0.281 0.218 A v al. Cap. per SM(bps) 718 83.01 29.58 16.65 11.15 No. of Connected SMs 123 457 870 1266 1696 BPSK Agg. Sec Th.(Mbps) 1.5 0.932 0.609 0.376 0.269 A v al. Cap. per SM(bps) 2400 965.4 655.9 597.31 536 No. of Connected SMs 105 261 384 422 471 T ABLE VII. C A P AC I T Y A NA LY SI S F O R D OW N L IN K R U R A L S C EN A RI O Cell radius (Km) 2 4 6 8 10 MFSK Agg. Sec Th.(Mbps) 0.85 0.683 0.519 0.384 0.305 A v al. Cap. per SM(bps) 707.5 98.3 32.4 15.82 10.29 No. of Connected SMs 125 482 983 1527 2104 BPSK Agg. Sec Th.(Mbps) 1.69 1.2 0.84 0.57 0.43 A v al. Cap. per SM(bps) 2175 743.7 471 389.1 331.9 No. of Connected SMs 115 336 531 643 754 V . C O N C L U S I O N In this paper , the OFDM-MFSK modulation scheme, which is based on the combination of OFDM and MFSK, is suggested for the smart metering technology . Its performance (PER, throughput, coverage and capacity) is measured and compared with the ordinary OFDM-BPSK in different cases. Based on the A WGN channel and system level study results, the OFDM- MFSK has better PER performance compared to BPSK at the higher v alues of M ( M ≥ 8 ), the higher the M v alue, the better the PER performance. Whereas, for small M values ( M < 8 ), the performance is worse than BPSK. On the other hand, the throughput behaviour is e xactly the opposite to the PER behaviour . This is due to the fact that OFDM- MFSK is tailored to enhance the receiv er sensitivity at the cost spectral efficienc y . Additionally , the adaptiv e OFDM-MFSK has lo wer outage probability (higher coverage) compared to BPSK for both uplink and do wnlink in the urban and rural en vironments. Although the capacity for the adapti ve OFDM- MFSK (aggreg ate sector throughput & a vailable capacity per SM) is lower than BPSK, the number of connected SMs per sector is higher . The essential requirements for the smart metering technology include the need for good coverage, low outage probability , and also the amount of data that is exchanged between the network and SMs is relativ ely low in this application. Therefore, we conclude that OFDM-MFSK can be ef fectively applied in the smart metering technology . A C K N O W L E D G M E N T Ghaith Al-Juboori would like to thank the Higher Com- mittee for Education Dev elopment (HCED) in Iraq, Ministry of Oil and the Uni versity of Baghdad for sponsoring his Ph.D. studies. R E F E R E N C E S [1] Statista, “Number of smart meters (electricity , gas & water) worldwide from 2014 to 2020, ” 2017. [Online]. A v ailable: https://www .statista. com/statistics/625890/worldwide- smart- meter- deplo yment/ [2] V odafone, “V ector and advanced metering services pick reliable, cost-ef fectiv e gprs mobile network for smart metering, ” V odafone, Report, 2016. [Online]. A vail- able: http://cofinae ventos.pt/portugaldigitalaw ards/wp- content/uploads/ sites/37/2016/04/V odafoneGlobalEnterprise case study AMS.pdf [3] J. J. Nielsen, G. C. Madueo, N. K. Pratas, R. B. Srensen, C. Stefanovic, and P . Popovski, “What can wireless cellular technologies do about the upcoming smart metering traffic?” IEEE Communications Magazine , vol. 53, no. 9, pp. 41–47, 2015. [4] T afazolli,Rahim, “Smart Metering System for the UK, ” University of Surrey , Report, 2013. [Online]. A vailable: https://iot.telefonica.com/ system/files force/SM Report 07- 06- 2013%202 9.pdf? [5] M. W etz, I. Perisa, W . G. T eich, and J. Lindner, “OFDM-MFSK with differentially encoded phases for robust transmission over fast fading channels, ” in Pr oc. 11th International OFDM W orkshop , 2008, Conference Proceedings, pp. 313–317. [6] M. W etz, I. Peria, W . G. T eich, and J. Lindner , “Robust transmission over fast fading channels on the basis of ofdm-mfsk, ” W ireless P ersonal Communications , vol. 47, no. 1, pp. 113–123, 2008. [7] M. W etz, W . G. T eich, and J. Lindner, “P APR reduction methods for noncoherent OFDM-MFSK, ” in Pr oceedings of 3rd COST 289 W orkshop , 2006, Conference Proceedings. [8] 3GPP TS 36.942 V10.2.0, “Evolved Univ ersal T errestrial Radio Access (EUTRA):Radio Frequenc y (RF) System Scenarios, ” 3GPP , Report, December 2010. [9] D. J. Mackay , “Encycloedia of sparse random graph codes. ” [Online]. A v ailable: http://www .inference.eng.cam.ac.uk/mackay/codes/data.html [10] NIST , “Nist pap2 guidelines for assessing wireless standards for smart grid application, ” NIST , Report, 2011. [11] G. R. Al-Juboori, A. Doufexi, and A. R. Nix, “ A comparison of ofdm and gfdm-based mfsk modulation schemes for robust iot applications. ” in presented at the 85th V ehicular T echnology Conference (VTC) , 2017, Conference Proceedings. [12] D. B. Cheikh, J. M. Kelif, M. Coupechoux, and P . Godlewski, “Outage probability in a multi-cellular network using alamouti scheme, ” in 2010 IEEE Sarnoff Symposium , 2010, Conference Proceedings, pp. 1–5.
Original Paper
Loading high-quality paper...
Comments & Academic Discussion
Loading comments...
Leave a Comment