This paper identifies the salient factors that characterize the inequality income distribution for Romania. Data analysis is rigorously carried out using sophisticated techniques borrowed from classical statistics (Theil). Decomposition of the inequalities measured by the Theil index is also performed. This study relies on an exhaustive (11.1 million records for 2014) data-set for total personal gross income of Romanian citizens.
Deep Dive into Decomposition of the Inequality of Income Distribution by Income Types - Application for Romania.
This paper identifies the salient factors that characterize the inequality income distribution for Romania. Data analysis is rigorously carried out using sophisticated techniques borrowed from classical statistics (Theil). Decomposition of the inequalities measured by the Theil index is also performed. This study relies on an exhaustive (11.1 million records for 2014) data-set for total personal gross income of Romanian citizens.
Decomposition of the Inequality of Income
Distribution by Income Types—Application
for Romania
Tudorel Andrei 1,*, Bogdan Oancea 2, Peter Richmond 3, Gurjeet Dhesi 4 and Claudiu Herteliu 1,*
1 Department of Statistics and Econometrics, Bucharest University of Economic Studies,
București 010374, Romania
2 Department of Economic and Administrative Sciences, University of Bucharest, București 050107,
Romania; bogdan.oancea@faa.unibuc.ro
3 School of Physics, Trinity College Dublin, Dublin 2, Ireland; peter_richmond@ymail.com
4 School of Business, London South Bank University, London SE1 0AA, UK; dhesig@lsbu.ac.uk
* Correspondence: andrei.tudorel@csie.ase.ro or andreitudorel@yahoo.com (T.A.);
hertz@csie.ase.ro or claudiu.herteliu@gmail.com (C.H.); Tel.: +40‐722‐455‐586 (C.H.)
Abstract: This paper identifies the salient factors that characterize the inequality income distribution
for Romania. Data analysis is rigorously carried out using sophisticated techniques borrowed from
classical statistics (Theil). Decomposition of the inequalities measured by the Theil index is also
performed. This study relies on an exhaustive (11.1 million records for 2014) data‐set for total personal
gross income of Romanian citizens.
Keywords: income inequality; Theil index; disjoint groups; decomposition
1. Introduction
Many analyses of income distributions have been made over the years by economists and
econophysicists (for example: [1–14]). Of special interest in all these analyses are income distribution
and income inequality (see for example: [15–27]). Several distribution functions have been proposed
to describe the income distribution, of which the lognormal‐Pareto [28] and exponential‐Pareto
distributions [29,30] best fit the empirical data.
Romanian income distribution has been little studied. Using wage data from a social security
database for a county in Romania, Derzsy et al. [31] showed that in the upper tail, the distribution
follows a Pareto law with a coefficient of 2.5, while in the range of low and middle incomes, they found
that an exponential distribution fits the data. Similar results were obtained by Oancea et al. [29] using
tax records data for the entire population that received an income in Romania in 2013. Other studies
of the Romanian income distribution [32,33] used survey data and showed that income inequality in
Romania has grown over time.
In this paper, we use tax records data for 2014 in Romania to study income inequality using the
Theil index [34–36]. While there are other widely used measures of inequality like the Gini index or
the Lorenz curve, we are mainly interested in studying the extent to which income inequality can be
explained by different subgroups of populations. In this case, the advantages of the decomposable
measures of inequality make the Theil index the ideal candidate to be considered in our analysis [37].
We decompose the total income of a person by the source of income in wages and non‐wage income
(here we include social transfers, unemployment benefits etc.) and grouped the population by the
source of income. We then study the decomposition of the Theil index by population subgroups
starting with the guidelines presented in [37]. However, while Shorrocks [37] used a decomposition
for disjoint groups, our population groups overlap since individuals can earn income from multiple
sources during a year. Decomposition of inequality by income sources was studied in several papers
using either the classical method, where the Theil index can be seen as a weighted average of
inequality within subgroups, or the inequality between those subgroups examined via regression‐
based methods: [38–41] or [42–45]. In this paper, we introduce a new decomposition of the Theil index
where the population groups overlap.
2 of 12
2. Problem Presentation
The income of an individual in a population has three possible sources: salary, capital, or other
sources like pensions, unemployment benefits, and social assistance. In Romania, every person who
was registered as having earned an income during 2014 earned money from one, two, or three of
these sources. In these conditions, the total population having an income during 2014 was divided
into the following seven categories of persons (Figure 1): persons who had their income only from a
single source of income (G1—salaries, G2—capital, and G3—other sources of income), persons who
earned income from two income categories (G4—salaries and other sources, G5—salaries and capital
income, and G6—capital income and other sources of income), and persons who earned money from
all three income sources (G7). Figure 1 shows the nature of the different incomes associated with
individuals in the different categories, G1 to G7.
Figure 1. The nature of the different incomes associated with individuals in the different categories,
G1 to G7.
Thus, w
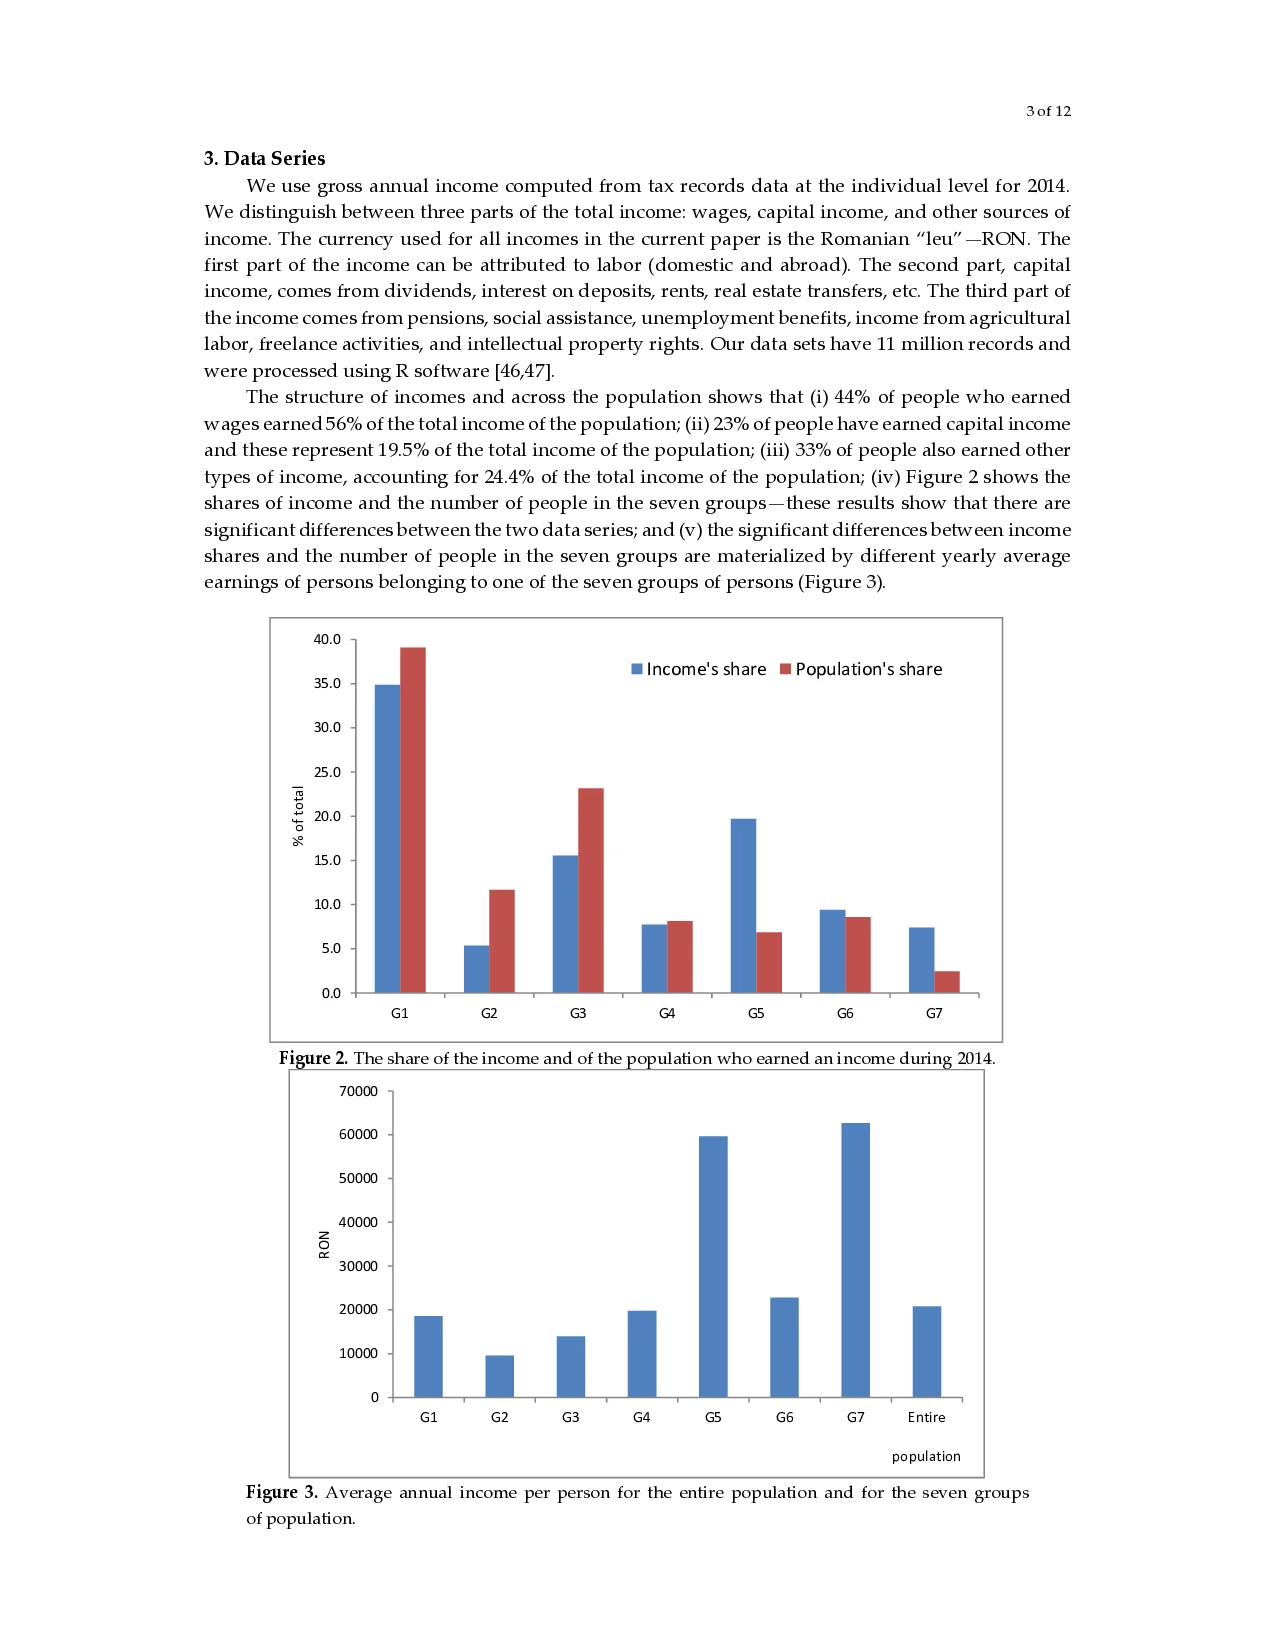
…(Full text truncated)…
This content is AI-processed based on ArXiv data.