Visual Similarity Perception of Directed Acyclic Graphs: A Study on Influencing Factors
While visual comparison of directed acyclic graphs (DAGs) is commonly encountered in various disciplines (e.g., finance, biology), knowledge about humans’ perception of graph similarity is currently quite limited. By graph similarity perception we mean how humans perceive commonalities and differences in graphs and herewith come to a similarity judgment. As a step toward filling this gap the study reported in this paper strives to identify factors which influence the similarity perception of DAGs. In particular, we conducted a card-sorting study employing a qualitative and quantitative analysis approach to identify 1) groups of DAGs that are perceived as similar by the participants and 2) the reasons behind their choice of groups. Our results suggest that similarity is mainly influenced by the number of levels, the number of nodes on a level, and the overall shape of the graph.
💡 Research Summary
The paper addresses a notable gap in the literature: while directed acyclic graphs (DAGs) are frequently compared in domains such as finance, biology, natural language processing, and social network analysis, little is known about how humans actually perceive similarity between such graphs. The authors set out to identify the visual factors that drive similarity judgments, using a card‑sorting methodology adapted from perceptual psychology and human‑computer interaction research.
Research Questions
The study is guided by a primary question—what factors influence human similarity perception of DAGs?—and two subordinate questions: (1) which groups of DAGs do participants naturally form, and (2) which graph attributes do participants cite when forming those groups.
Dataset Construction
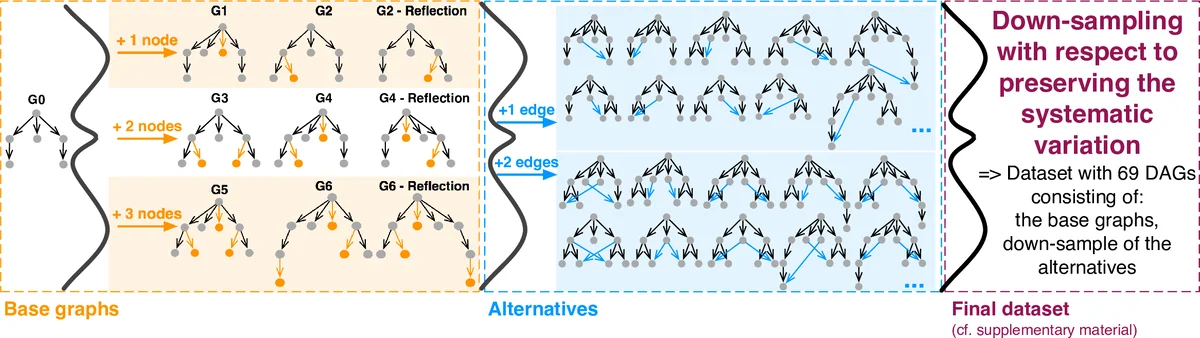
A systematic synthetic dataset of 69 small DAGs (6–9 nodes each) was generated. Starting from a symmetric base graph G0 (three levels, six nodes), the authors created six base variants (G1–G6) by adding one, two, or three nodes in both inner and outer regions. For each base variant, all possible edge‑addition combinations (one or two extra edges) were generated, yielding a large combinatorial pool. To keep the task cognitively feasible, a down‑sampling step selected a representative subset while preserving variation across four pre‑identified factors: edge crossings, visual layout (horizontal vs. vertical orientation), multiple parents sharing a child, and long connections spanning more than one level. The final set retained systematic variation and is publicly available.
Participants
Twenty volunteers (13 male, 7 female, ages 20–60) with diverse educational backgrounds and varying familiarity with information visualization were recruited. No prior expertise with DAGs was required, ensuring that findings reflect general human perception rather than domain‑specific knowledge.
Procedure
Each participant received printed cards depicting the 69 DAGs and was instructed to group the cards according to perceived similarity. Multiple group membership was allowed, reflecting the possibility that a graph can belong to several similarity categories. After forming each group, participants tagged the group with the factors they believed guided their decision. Finally, they rated the difficulty of forming each group and their confidence in the consistency of the grouping on a five‑point Likert scale. The open, paper‑based card‑sorting approach was chosen because it allows participants to view all items simultaneously, reducing memory load and yielding more consistent results than computer‑based sorting.
Analysis
Two complementary analyses were performed. First, the authors examined the structure of the groups across participants, using clustering techniques to identify common grouping patterns and measuring inter‑rater agreement. Second, they performed a qualitative‑quantitative coding of the participant‑provided tags to determine which visual attributes were most frequently cited.
Findings
The dominant factors influencing similarity judgments were:
- Number of Levels (graph depth) – Participants consistently grouped graphs with the same hierarchical depth together.
- Number of Nodes per Level (horizontal width) – Even when depth matched, differences in the distribution of nodes across levels led to separate groups.
- Overall Shape (symmetry vs. asymmetry, aspect ratio) – The global silhouette of the graph, including whether the layout appeared balanced or skewed, was a salient cue.
Edge crossings, specific parent‑child configurations, and long‑range connections were mentioned far less often and appeared to play a secondary role. The findings suggest that humans rely on coarse, shape‑based cues rather than detailed topological information when rapidly assessing DAG similarity.
Implications
These results have practical implications for the design of visual comparison tools. Interfaces should emphasize clear hierarchical depth cues and preserve the overall silhouette of DAGs, while allowing users to toggle or highlight finer‑grained details (e.g., edge crossings) on demand. The study also validates card sorting as an effective method for uncovering mental models in graph perception research.
Limitations and Future Work
The study used small synthetic graphs; extending the methodology to larger, real‑world DAGs (e.g., financial transaction cascades) will test the generalizability of the identified factors. Additionally, exploring digital card‑sorting interfaces that retain the benefits of simultaneous overview could broaden applicability.
Conclusion
Human perception of DAG similarity is primarily driven by three visual factors: the number of hierarchical levels, the distribution of nodes across those levels, and the overall shape of the graph. Recognizing these cues can guide the development of more intuitive graph comparison visualizations and inform future perceptual studies in the domain of network data.
Comments & Academic Discussion
Loading comments...
Leave a Comment