Quantifying and Visualizing Hidden Preferential Aggregations Amid Heterogeneity
Biological systems often exhibit a heterogeneous arrangement of objects, such as assorted nuclear chromatin patterns in a tumor, assorted species of bacteria in biofilms, or assorted aggregates of subcellular particles. Principle Component Analysis (PCA) and Multiple Component Analysis (MCA) provide information about which features in multidimensional data aggregate, but do not provide in situ spatial information about these aggregations. This paper outlines the Numericized Histogram Score (NHS) algorithm, which converts the histogram distribution of shortest distances between objects into a continuous variable that can be represented as a spatial heatmap. A histogram can be transformed into an intensity value by assigning a weighting factor to each sequential bin. Each object in an image can be replaced by its NHS value, which when calibrated to a color scale results in a heatmap. These spatial heatmaps reveal regions of aggregation amid heterogeneity that would otherwise mask loco-regional spatial associations, which will be especially useful in the field of digital pathology. In addition to visualizing aggregations as heatmaps, the ability to calculate degrees of recurring patterns of aggregation allows investigators to stratify samples for further insights into clinical outcome, response to treatment, or omic subtypes (genomic, transcriptomic, proteomic, metabolomic, etc.).
💡 Research Summary
The paper introduces a novel quantitative‑visual method called the Numericized Histogram Score (NHS) to detect and display hidden preferential aggregations within heterogeneous biological systems. Traditional multivariate techniques such as Principal Component Analysis (PCA) and Multiple Component Analysis (MCA) can reveal which measured features tend to co‑vary, but they lack spatial context; they do not tell where in an image objects are clustered. NHS bridges this gap by converting the distribution of pairwise shortest‑distance measurements between objects into a single continuous score that can be mapped back onto the original image as a heatmap.
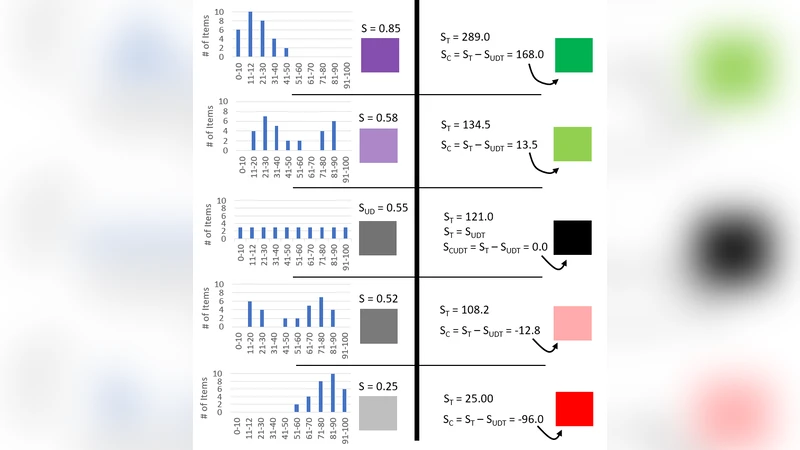
The workflow begins with object detection (e.g., nuclei, bacterial cells, subcellular particles) using conventional segmentation or deep‑learning models, followed by extraction of each object’s centroid coordinates. All pairwise Euclidean distances are computed, producing an N × N distance matrix (where N is the number of objects). These distances are binned into a histogram; each bin receives a predefined weight that typically decreases with increasing distance, thereby emphasizing close neighbors. The weighted sum of the histogram is then normalized by the total number of objects (or by the sum of all weights) to yield a value between 0 and 1 – the NHS for that particular object. A high NHS indicates that the object resides in a locally dense region, whereas a low NHS signals isolation.
By assigning each object its NHS value and translating that value onto a calibrated color scale (e.g., blue for low, red for high), a spatial heatmap is generated. This heatmap preserves the original morphology of the tissue while simultaneously encoding quantitative information about local aggregation. The authors demonstrate the method on digital pathology slides of tumors and on microscopy images of bacterial biofilms. In tumor sections, NHS heatmaps expose micro‑domains of nuclear crowding that are invisible to the naked eye and correlate with higher tumor grade and poorer patient outcome. In biofilms, the technique highlights zones where specific bacterial species dominate, offering insights into inter‑species interactions and antibiotic resistance patterns.
Beyond visualization, NHS provides a numeric descriptor that can be used for downstream statistical analyses. The authors cluster samples based on their distribution of NHS values and integrate these clusters with multi‑omics data (genomic, transcriptomic, proteomic, metabolomic). They report that NHS‑derived clusters improve the predictive power for clinical endpoints compared with clusters derived from conventional histopathological scores alone, suggesting that spatial aggregation carries biologically relevant information that complements molecular profiling.
The paper also discusses computational considerations. Calculating all pairwise distances scales as O(N²), which becomes prohibitive for whole‑slide images containing tens of thousands of objects. The authors propose using spatial indexing structures such as KD‑Trees or Ball‑Trees, parallel GPU implementations, or stochastic sampling to reduce runtime. They note that the choice of weighting function (linear decay, exponential decay, custom kernels) strongly influences the NHS and should be optimized for each biological context. Additionally, color mapping must respect human perceptual limits to avoid misinterpretation of subtle differences.
In summary, the NHS algorithm transforms a distance‑based histogram into a continuous, spatially resolved metric that can be visualized as a heatmap, thereby revealing hidden preferential aggregations within heterogeneous samples. Its ability to quantify local density, integrate with clinical and omics data, and provide an intuitive visual output makes it a powerful addition to the toolbox of digital pathology, microbiology, and subcellular imaging. Future work will likely focus on scaling the computation for whole‑slide imaging, refining weight functions for specific tissue types, and validating NHS‑derived biomarkers in larger, multi‑center cohorts.
Comments & Academic Discussion
Loading comments...
Leave a Comment