Continuous User Authentication via Unlabeled Phone Movement Patterns
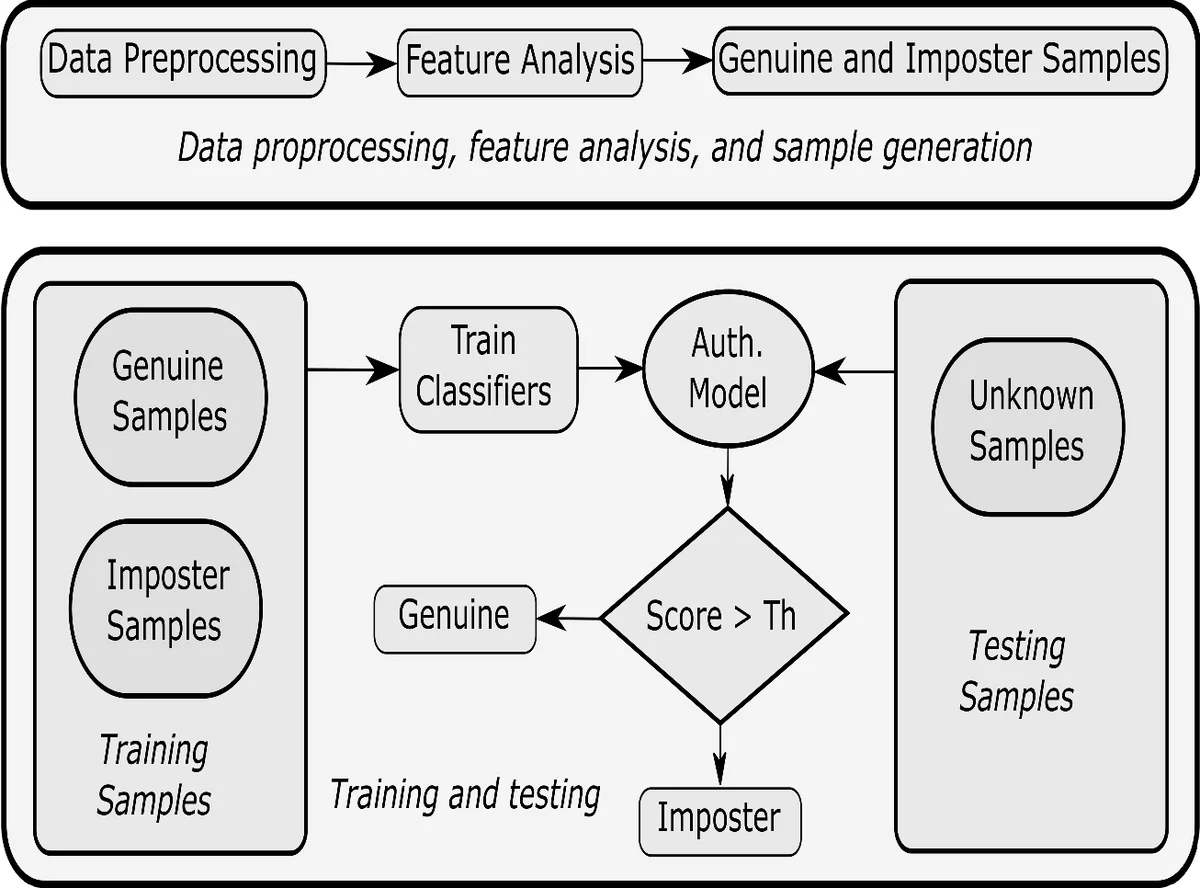
In this paper, we propose a novel continuous authentication system for smartphone users. The proposed system entirely relies on unlabeled phone movement patterns collected through smartphone accelerometer. The data was collected in a completely unconstrained environment over five to twelve days. The contexts of phone usage were identified using k-means clustering. Multiple profiles, one for each context, were created for every user. Five machine learning algorithms were employed for classification of genuine and impostors. The performance of the system was evaluated over a diverse population of 57 users. The mean equal error rates achieved by Logistic Regression, Neural Network, kNN, SVM, and Random Forest were 13.7%, 13.5%, 12.1%, 10.7%, and 5.6% respectively. A series of statistical tests were conducted to compare the performance of the classifiers. The suitability of the proposed system for different types of users was also investigated using the failure to enroll policy.
💡 Research Summary
The paper presents a novel continuous authentication framework that relies exclusively on unlabeled smartphone accelerometer data. Data were collected from 57 participants (students and staff) over a period of 5 to 12 days using a background Android app installed on each participant’s personal device, ensuring a realistic, unconstrained environment. Because devices varied in sampling rates (4–20+ Hz), the authors adopted a time‑based windowing approach: raw data were segmented into 2.5‑second windows for noise filtering (removing “unattended” phone states) and later into 10‑second overlapping windows (5‑second stride) for feature extraction.
A rich set of 20+ features was derived from each window, encompassing time‑domain statistics (mean, standard deviation, inter‑quartile range, range, peak‑to‑RMS ratio), frequency‑domain measures (band power, median frequency, spectral entropy), information‑theoretic metrics (mutual information), signal similarity metrics (Dynamic Time Warping distances, correlation), and a contextual feature indicating the proportion of time the screen was on. Feature values were normalized to
Comments & Academic Discussion
Loading comments...
Leave a Comment