Measurement of human activity using velocity GPS data obtained from mobile phones
Human movement is used as an indicator of human activity in modern society. The velocity of moving humans is calculated based on position information obtained from mobile phones. The level of human activity, as recorded by velocity, varies throughout the day. Therefore, velocity can be used to identify the intervals of highest and lowest activity. More specifically, we obtained mobile-phone GPS data from the people around Shibuya station in Tokyo, which has the highest population density in Japan. From these data, we observe that velocity tends to consistently increase with the changes in social activities. For example, during the earthquake in Kumamoto Prefecture in April 2016, the activity on that day was much lower than usual. In this research, we focus on natural disasters such as earthquakes owing to their significant effects on human activities in developed countries like Japan. In the event of a natural disaster in another developed country, considering the change in human behavior at the time of the disaster (e.g., the 2016 Kumamoto Great Earthquake) from the viewpoint of velocity allows us to improve our planning for mitigation measures. Thus, we analyze the changes in human activity through velocity calculations in Shibuya, Tokyo, and compare times of disasters with normal times.
💡 Research Summary
This paper investigates how human activity can be quantified by measuring the velocity of individuals using GPS data collected from mobile phones. The authors obtained large‑scale location logs from AGOOP, a subsidiary of SoftBank that provides two types of datasets: (1) point‑type floating‑population data, which contain timestamped latitude‑longitude records for each user, and (2) mesh‑type data, which extrapolate the sampled users to the whole population. For the present analysis the authors focused on the point‑type data from two contrasting areas in Japan: Shibuya, a densely populated commercial and cultural hub in central Tokyo, and Kumamoto Prefecture, a regional city in Kyushu where automobile travel is more common.
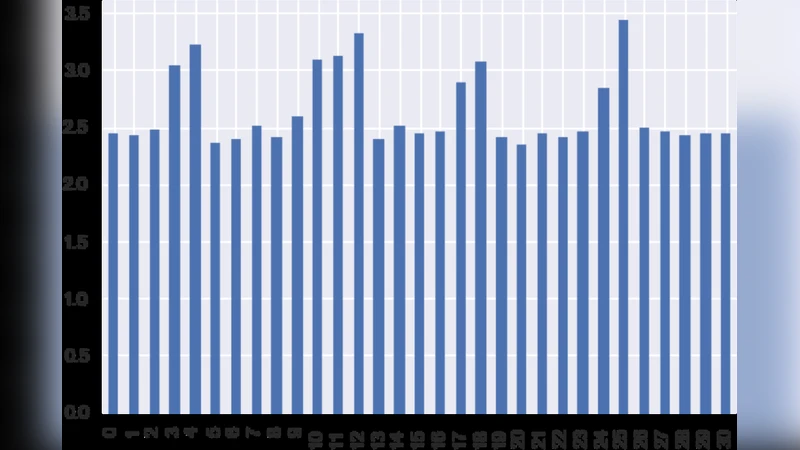
First, daily mean velocities were computed for October 2014 (Shibuya) and October 2015 (Shibuya). The results show a clear weekly pattern: average speed rises on Fridays and Saturdays, drops on weekdays, and returns to a moderate level on Sundays. This pattern mirrors typical work‑leisure cycles, with higher mobility on weekends when young people gather for shopping and entertainment. Hour‑by‑hour plots reveal two systematic dips – around lunchtime (12:00–14:00) and during the night (after 22:00) – indicating temporary pauses for meals and sleep.
Second, the authors compared speed distributions between the two regions. In Shibuya most recorded speeds fall below 10 km h⁻¹, indicating that the majority of movements are pedestrian. In Kumamoto the distribution peaks around 30–50 km h⁻¹, reflecting a higher share of car travel. This contrast confirms that the same methodology can capture differing transportation modes across urban contexts.
The core contribution concerns the response to a natural disaster. The study examined the period of the 2016 Kumamoto earthquakes (April 15 – 16). Daily mean speeds for both Kumamoto and the neighboring Oita Prefecture dropped sharply on the day of the main shock. The authors interpret this decline as a combined effect of damaged infrastructure, traffic restrictions, and a voluntary reduction in outward movement. They argue that the fall in average velocity is not merely a reduction in vehicle travel but a broader indicator of halted socioeconomic activity – people stop cars, pause walking, and generally suspend routine flows.
In the discussion the authors propose that mean velocity can serve as a real‑time proxy for economic activity. Because the same low‑speed patterns appear during routine breaks (lunch, night) and during extraordinary events (earthquakes), velocity data could be integrated into disaster‑response dashboards to assess the immediate impact on human mobility and, by extension, on commerce, logistics, and public services. They also suggest that urban planners could use hourly speed profiles to design pedestrian‑friendly streets, optimize public‑transport schedules, and anticipate congestion points.
Limitations are acknowledged. GPS accuracy varies, sampling is limited to users who have consented to data sharing, and the dataset may not be fully representative of the entire population. Moreover, external factors such as weather, large festivals, or road works were not explicitly controlled, which could confound the attribution of speed changes solely to human behavior.
In conclusion, the paper demonstrates that mobile‑phone derived velocity is a viable, high‑resolution indicator of human activity. It captures regular diurnal and weekly cycles, distinguishes between regions with different transport habits, and sensitively reflects the abrupt slowdown caused by a major earthquake. The authors recommend extending the approach to multiple cities and disaster types, and integrating machine‑learning models to predict mobility disruptions before they occur, thereby enhancing both urban management and emergency preparedness.
Comments & Academic Discussion
Loading comments...
Leave a Comment