Annotation of Car Trajectories based on Driving Patterns
Nowadays, the ubiquity of various sensors enables the collection of voluminous datasets of car trajectories. Such datasets enable analysts to make sense of driving patterns and behaviors: in order to understand the behavior of drivers, one approach is to break a trajectory into its underlying patterns and then analyze that trajectory in terms of derived patterns. The process of trajectory segmentation is a function of various resources including a set of ground truth trajectories with their driving patterns. To the best of our knowledge, no such ground-truth dataset exists in the literature. In this paper, we describe a trajectory annotation framework and report our results to annotate a dataset of personal car trajectories. Our annotation methodology consists of a crowd-sourcing task followed by a precise process of aggregation. Our annotation process consists of two granularity levels, one to specify the annotation (segment border) and the other one to describe the type of the segment (e.g. speed-up, turn, merge, etc.). The output of our project, Dataset of Annotated Car Trajectories (DACT), is available online at https://figshare.com/articles/dact_dataset_of_annotated_car_trajectories/5005289 .
💡 Research Summary
The paper addresses a fundamental gap in vehicle trajectory research: the lack of a publicly available, expert‑annotated ground‑truth dataset that marks driving‑pattern segment boundaries and assigns semantic labels (e.g., speed‑up, turn, merge). The authors propose a two‑stage annotation framework and release the resulting Dataset of Annotated Car Trajectories (DACT), comprising several thousand personal car trips collected from GPS‑enabled devices.
In the problem formulation, a trajectory is defined as a time‑ordered sequence of points, each containing timestamp, speed, heading change, latitude, and longitude. Segmentation consists of identifying cut indices that delimit non‑overlapping sub‑trajectories; annotation adds a human‑interpreted label to each segment.
The framework consists of (1) Expert Annotation and (2) Annotation Aggregation.
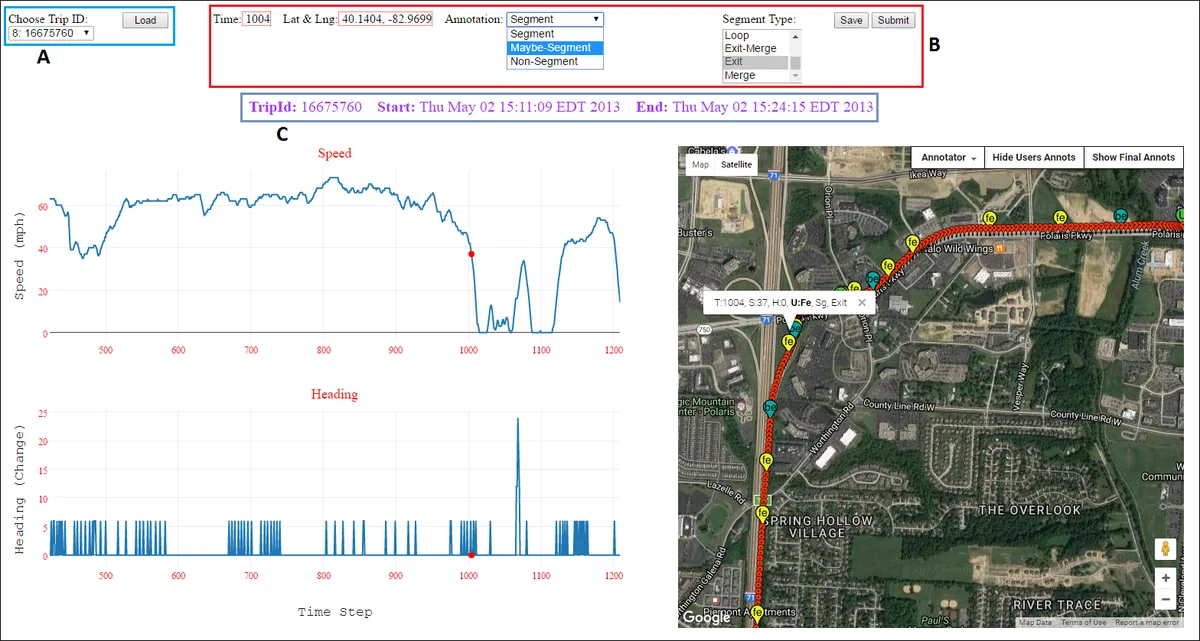
Expert Annotation is carried out through a custom web portal built with PHP, JavaScript, Plot.ly (for speed and heading plots) and Google Maps API (for geographic visualization). Annotators view synchronized speed, heading, and map displays, click on points they consider segment ends, and classify each point as “Segment”, “Maybe‑Segment”, or “Non‑Segment”. They then select a pattern type from a predefined list (exit, merge, loop, turn, smooth‑turn, left‑turn, right‑turn, jiggling, speed‑up, slow‑down, traffic‑light). The portal supports zooming, coordinated views, and a “Show Annotation” button to review previous selections.
To prepare annotators, the authors provided a written tutorial, a short instructional video, and a pilot phase where each annotator labeled two trajectories. The main annotation phase involved seven annotators (four students, two researchers, one insurance expert). Each trajectory was assigned to exactly two annotators, ensuring redundancy and enabling inter‑annotator agreement analysis.
Annotation Aggregation resolves discrepancies and produces the final dataset. The authors designed an aggregation portal mirroring the expert interface but with additional controls to display or hide individual annotators’ contributions. Aggregation proceeds in two passes:
Strict Aggregation applies stringent criteria (≥5 mph speed change or ≥5 seconds of continuous heading change) to capture every possible segment. Main, obvious patterns are marked as “SEGMENT”; finer, nested patterns (e.g., a slow‑down within a turn) are marked as “MAYBE‑SEGMENT”. This phase aims to retain both primary and intermediate segments.
Easy Aggregation relaxes thresholds and allows an aggregation expert to accept, refine, or reject annotations based on visual inspection and heuristic‑generated suggestions. Heuristic labels are derived automatically from the same speed/heading thresholds and serve as a sanity check against human input.
The final DACT dataset contains roughly 5,000 trajectories, each with an average of 8–10 labeled segments. Inter‑annotator agreement measured by Cohen’s κ is 0.71 for “SEGMENT” and 0.58 for “MAYBE‑SEGMENT”, indicating reasonably high consistency despite the inherent subjectivity of the task. The dataset is released on Figshare in CSV and GeoJSON formats, providing raw sensor streams together with the segment boundaries and pattern labels.
The authors discuss limitations: the “Maybe‑Segment” category reflects uncertainty that downstream models must handle; the data are collected primarily in the Mid‑Western United States, limiting geographic generalizability; and the manual process, while thorough, is time‑consuming. Future work includes expanding the dataset to other regions, developing automated segmentation models trained on DACT, and incorporating probabilistic treatment of ambiguous labels.
In summary, this work delivers the first large‑scale, human‑annotated car‑trajectory benchmark, offers a reproducible crowdsourcing‑plus‑expert workflow, and provides a valuable resource for research on driving behavior analysis, risk assessment, and intelligent transportation systems.
Comments & Academic Discussion
Loading comments...
Leave a Comment