A Unified Framework for Representation-based Subspace Clustering of Out-of-sample and Large-scale Data
Under the framework of spectral clustering, the key of subspace clustering is building a similarity graph which describes the neighborhood relations among data points. Some recent works build the graph using sparse, low-rank, and $\ell_2$-norm-based …
Authors: Xi Peng, Huajin Tang, Lei Zhang
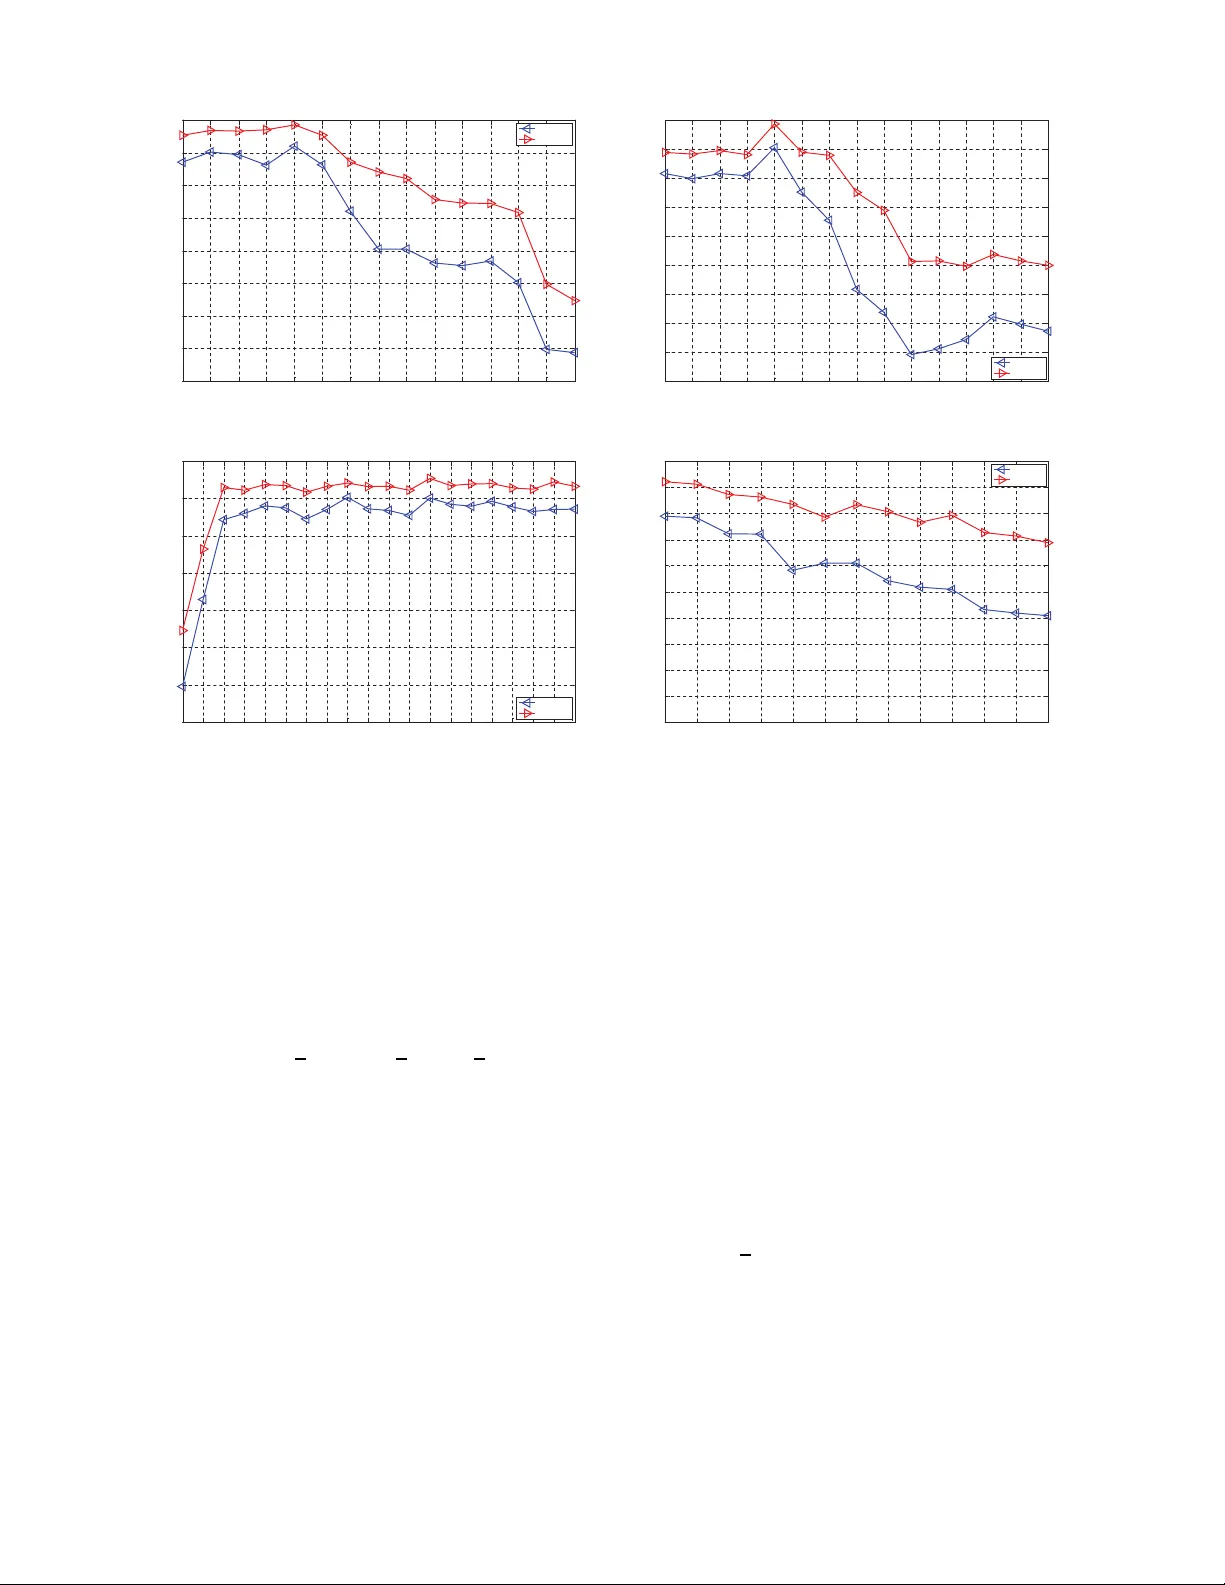
JOURNAL OF L A T E X CL ASS FILES, VOL. 13, NO. 9, SEPTEMBER 2014 1 A Unified Frame work for Re presentation-Based Subspace Clustering of Out-of-Sam ple and Lar ge-Scale Data Xi Peng, Huajin T ang, Member IEEE, Lei Zhang , Member IEEE, Zhang Y i, Senior Member IEEE , Shijie Xiao Student Member IEEE, Abstract —Under the framew ork of spectral clustering, the key o f subspace clustering is bui lding a similarity graph which describes th e neighborhood relations among data points. S ome recent works build t he g raph using sparse , low-rank, and ℓ 2 - norm-based repre sentation, and ha ve achiev ed state-of-the-art perfo rmance. Howeve r , these methods h a ve suffered from the fo llowing tw o limitations. F irst, the time complexities of th ese methods are at least proportional to the cub e of the data size, which make those methods inefficient fo r solving large-scale problems. Second, they ca nnot cope with out-of-sample data that are not used to construct the similarity graph. T o cl uster each out-of-sample datum, the methods h a ve to recalculate the similarity graph and the cluster membership of the whole data set. In this paper , we propose a unified framework which makes repre sentation-based subspace clustering algorithms feasible to cluster both o ut-of-sample and lar ge-scale data. Under our fra me- work, the large-scale pr oblem is tackled by con verting it as out-of- sample p roblem in th e manner o f “ sampling, clustering, coding, and classifying”. Furthermor e, we giv e an estimation f or the error bounds by treating each subspace as a p oint in a hyperspace. Extensive experimental results on various benchmark d ata sets show that our methods outp erf orm severa l recently-proposed scalable methods in clustering larg e-scale data set. Index T erms —Scalable subspace clustering, out-of-sam ple problem, sparse subsp ace clu stering, low-rank representation, least squar e r egression, error bound analysis. I . I N T RO D U C T I O N C LUSTERING analysis aims to group similar pattern s into the same cluster by maxim izing the inter-cluster dissimilarity and the intra-cluster similar ity . Over the p ast tw o decades, a number of c lustering approaches h av e been pro- posed, for example, partitioning -based clustering [ 1 ], kernel- based clustering [ 2 ], and subspace clustering [ 3 ]. Subspace clustering aims at finding a lo w-dimension al su b- space to fit each g roup of data p oints. It mainly co ntains tw o tasks, i.e. , projectin g the data set into ano ther space (enc oding) and ca lculating th e cluster me mbership of the data set in the pr ojection space (clustering ). Popular subspace clusterin g methods include but not limit to statistical methods [ 4 ], [ 5 ] and spectral clustering [ 6 ], [ 7 ]. Spectral clustering finds the clu ster X. Peng is are with Institute for Infocomm Research, A*ST AR, Singapore 138632 (E-mail: pangsaai @gmail.com). H. T ang, L. Zhang and Z. Yi are wi th the Coll ege of Co mputer Science, Sichuan Univ ersity , Chengdu, China 610065 (E-mail: htang@i2r .a-star .edu.sg, leizh ang@scu.edu.cn , zh angyi@scu.ed u.cn). S. J. Xiao is with School of Computer Engineering, Nanyang T ec hnologic al Uni versi ty , Singapore (E-mail:xia o0050@ntu.e du.sg). Correspondi ng author: H. T ang (E-mail: htang@i2r .a-star .edu.sg). membersh ip of the data p oints by u sing the s pectrum of an affinity matrix . T he affinity matrix cor responds to a similarity graph of which each vertex denotes a data point, with the edge weights representing th e si milarities between connected points. Thus, at the heart of the spectral clustering is a similarity gr aph construction problem. There ar e two wide ly-used appro aches to b uild a similar- ity grap h, i.e. , Pairwise Distance (PD) a nd Recon struction Coefficients ( RC). Specifically , PD comp utes the similarity based on the distance ( e.g. , the Euclidean distance) b etween any two data p oints. Howev er , PD canno t reflect the glo bal structure o f the data set, because its v alue on ly depen ds on connected data points. I n contrast, RC d enotes each data point as a linear combinatio n of the o ther po ints and uses the represen tation coefficients as a similarity m easurement. Sev eral recent works have shown that RC is superio r to PD in subsp ace clu stering, for example, sparse representation [ 8 ], [ 9 ], [ 10 ], [ 11 ], [ 12 ], [ 13 ], lo w rank represen tation [ 14 ], [ 15 ], [ 16 ], [ 17 ], latent low rank representa tion [ 18 ], and ℓ 2 -norm - based representation [ 19 ], [ 20 ]. Although rep resentation- based subspace clusterin g has been extensi vely studied, how to solve the large-scale an d out-o f- sample c lustering prob lems are less explored. T aking s parse subspace clustering (SSC) [ 8 ], [ 9 ] as an example: SSC it- eratively compu tes the sparse codes of n data points a nd perfor ms eig en-decom position over an n × n g raph L aplacian matrix. Its computation al com plexity is mor e than O ( mn 3 ) ev en th ough th e fastest ℓ 1 -solver is used, wher e m den otes the dimensiona lity of th e data set. Thus, any m edium-sized data set will bring up large-scale pr oblem with SSC. Moreover , SSC cannot han dle out-of-samp le data that are not used to construct the s imilarity g raph. T o cluster each previously unseen da tum 1 , SSC has to reco mpute the similar ity grap h and the cluster memb ership of the whole data set. In fact, most representatio n-based subspace clustering methods [ 14 ], [ 15 ], [ 17 ], [ 18 ], [ 19 ], [ 21 ] have su ffered f rom similar limitations when dealing with large-scale o r out-of-samp le data. T o addr ess such issues, w e pro pose a u nified framework for the representation -based subspace clustering alg orithms. Our framework treats the large- scale proble m as the out- of-sample problem in the mann er of “samplin g, clustering, coding, and classifying ” (Fig. 1). Specifically , we split a large 1 In this paper , we assume that any previ ously unseen datum ( i .e. , out-of- sample datum) belongs to one of the subspaces spanned by in-sample data. JOURNAL OF L A T E X CL ASS FILES, VOL. 13, NO. 9, SEPTEMBER 2014 2 Step 1: Sampling Step 2: Self Encoding • Sparse Code • Low Rank Code • Others Step 3: Eigen Deco mposition Step 4: k-means clustering Step 5: Coding over In-sample data Step 6: Minimizing Res iduals Input In-sample Data Out-of-sample Data Affinity Matrix Clustering Membership Linear Representation Step 5 Step 6 Grouping Membership Step 1 Laplacian Matrix Eigenvector Matrix Step 3 Step 4 Step 2 Fig. 1. Architecture of the proposed frame work for scalab le representat ion-based subspace clustering. The framewo rk can be summarized as “sampling (step 1), clustering (steps 2–4), coding (step 5), and classifyi ng (step 6)”. Solid and dotted lines are used to sho w the processes of clusterin g of in-sample data and out-of-sampl e data, respecti vely . For the out-of-sample problem, only steps 5 and 6 are needed. scale da ta set into two parts, in-sample data X and o ut- of-sample data Y . Then, we obtain the cluster membe rship of X and assign each ou t-of-samp le datum to th e n earest subspace spann ed by X . U nder our f ramework, th ree scalable methods are presente d, i.e. , scalable sparse subspace clusterin g (SSSC), scalable lo w rank representation (SLRR), and scalable least squ are regression (SLSR). The p roposed m ethods re- markably improve th e comp utational efficiency of the orig inal approa ches wh ile preserving a good clustering performance. This pape r is a substantial extension of o ur confere nce paper [ 22 ], which is f urther improved f rom the fo llowing aspects: 1) W e perform err or analysis for our f ramework by treatin g each sub space in a well-defin ed hyperspac e. The presented lower and upper er ror b ounds are helpful in un - derstandin g the w orking m echanism of th e neare st subspace classifier ( specifically , spar se represen tation based classifier (SRC) [ 23 ]. T o the best of our knowledge, this is th e first work to perf orm errors analysis f or SRC. 2) W e a dditionally propo se two scalable methods, i.e. , SLRR and SLSR, which make lo w rank representation (LRR) [ 15 ] and least square regression (LSR) [ 19 ] feasible to clu ster large scale data an d out-of -sample data. 3) W e per form extensive experiments to compare o ur m ethods with mo re scalable clusterin g metho ds on more data sets. 4) W e conduct comprehensive a nalysis f or our app roaches, includin g th e perf ormance with different ou t- of-sample gro uping strategies and the influence of different parameters. The rest of the p aper is organized as follows: W e provid e in Section II a br ief review of th e representatio n-based clustering algorithm s and some scalable spectral clu stering m ethods. In Section III, we pr opose o ur framework and th ree scalable representatio n-based clustering algorithm s, and further present some theor etical results on the er ror bound analysis o f our framework. T o demonstrate the p erforma nce of our pro posed methods, we com pare them with five recently-pr oposed scal- able clustering appro aches on nin e data sets in Section IV. Lastly , we give the co nclusions an d th e fu rther work in Section V. I I . R E P R E S E N T A T I O N - B A S E D S U B S P AC E C L U S T E R I N G In this paper, we use lower-case bold lett ers to represen t column vector s and U PPER-CASE BOLD LETTERS to T ABLE I N O TA T I O N S . Notatio n Definitio n n the number of data points m the dimensionali ty of a giv en data set k the number of clusters p the number of in-sample data t the number of iterations of algorithm r the rank of a giv en data matrix f ( x i ) the predicti on for a giv en x i D = [ d 1 , d 2 , . . . , d n ] data set [ D ] i the data points belonging to the subspace S i X = [ x 1 , x 2 , . . . , x p ] in-sample data Y = [ y 1 , y 2 , . . . , y n − p ] out-of-sampl e data C = [ c 1 , c 2 , . . . ] the representa tion of a giv en data set A ∈ R n × n af finity matrix based on C L ∈ R n × n Laplaci an matrix V ∈ R n × k eigen vector matrix represent matrices. A T and A − 1 denote the transpose and pseudo- in verse of the matrix A , respectiv ely . I deno tes the identity matrix. T able I summarizes some n otations used throug hout the pap er . A. Sparse Repr esentation Based Subspace Clustering Recently , Elhamifar and V idal [ 8 ], [ 9 ] pr oposed SSC with well-foun ded recovery theo ry for indepen dent su bspaces and disjoint subspa ces. SSC calculates the similarity amo ng data points by solving the following op timization problem: min C , E , Z k C k 1 + λ E k E k 1 + λ Z k Z k F s . t . D = DC + E + Z , diag( C ) = 0 , (1) where C ∈ R n × n is the sparse re presentation of the data set D ∈ R m × n , E co rrespond s to th e spar se ou tlying entries, Z denotes the reconstruc tion er rors for the limited representa- tional cap ability , a nd the param eters λ E and λ Z balance these three ter ms in the o bjective functio n. (1) is conve x an d can b e solved by a num ber of ℓ 1 -solvers [ 24 ]. After getting C , SSC builds a similar ity gr aph via A = | C | T + | C | and perfo rms spectral clustering [ 6 ] ov er the graph. SSC is effective but inefficient. It ne eds O ( tn 2 m 2 + tmn 3 ) to b uild the similarity graph e ven if the fastest ℓ 1 -solver is used, wh ere t deno tes the n umber o f iteration s of the solver . JOURNAL OF L A T E X CL ASS FILES, VOL. 13, NO. 9, SEPTEMBER 2014 3 Algorithm 1 Representation based Subspace Clustering. Input: A set of data points D ∈ R m × n and the number of clusters k . 1: Obtain the represen tation C ∗ by solving (1), (2) or (3). 2: Get the affinity ma trix via A = | C ∗ | T + | C ∗ | . 3: Construct a Laplacian m atrix L = I − B − 1 / 2 AB − 1 / 2 using A , where B = diag { b i } with b i = P n j =1 A ij . 4: Obtain the eigenv ector m atrix U ∈ R n × k which consists of the first k no rmalized eigenvectors of L co rrespond ing to its k smallest eigen values. 5: Get the se gmentation s of the data by p erformin g k-mean s algorithm over the rows of U . Output: The cluster assignment of D . In ad dition, SSC takes O ( n 3 ) to calculate the eigenvectors of the Laplacian matrix L . Considerin g that L is a spar se matrix, the time com plexity of this step cou ld be r educed to O ( mn + mn 2 ) when Lanczo s eigen solver is used. Howe ver , it is still a daunting task e ven for a moderate n > 100 , 000 . B. Low Rank Repres entation Based Subspace Clustering Different from SSC, LRR [ 15 ], [ 18 ], [ 25 ] u ses th e lowest rank repre sentation rather than the sparsest rep resentation to build the similarity g raph. The objectiv e function of LRR is min C , E k C k ∗ + λ k E k ℓ s . t . D = DC + E , (2) where k · k ∗ denotes the nu clear norm, k · k ℓ could be ch osen as ℓ 2 , 1 -norm , ℓ 1 -norm , or Fro benius nor m, depe nding on prior knowledge o f the error structure. Generally , ℓ 2 , 1 -norm is adopte d to deal with sample- specific corr uption an d outlier, ℓ 1 -norm is used to characterize the random corruption , and Frobeniu s no rm is used to handle the Gaussian noise. LRR, which ado pts augmen ted Lagrange multipliers (ALM) method to solve (2), takes O ( m 2 n + n 3 ) to p erform singular value decompo sition (SVD) over a d ense matrix at each iteration. I n addition , LRR will take O ( n 3 + t 2 nk 2 ) to per form clustering, where t 2 denotes the number o f iterations of the k-means m ethod. Theref ore, the overall time complexity of LRR is O ( t 1 m 2 n + t 1 n 3 + t 2 nk 2 ) , where t 1 is the n umber of iterations of ALM. C. ℓ 2 -norm Based Methods SSC, LRR, an d their extensions solve a conve x optimization problem , of which th e compu tational complexities are very high. Recently , least squ are re gression (LSR) [ 19 ] has shown that ℓ 2 -norm -based representation can a chiev e the co mpetitive result with faster speed. LSR aims at solving min C k D − DC k 2 F + λ k C k 2 F s . t . diag( C ) = 0 , (3) where k · k F denotes the Frobeniu s no rm, the non-negative real numb er λ is used to avoid overfitting, and the constraint guaran tees that the i -th coefficient ov er d i ∈ D is zero. Lu et al. [ 19 ] p rovides two solutions to (3) and the compu - tational complexities o f th ese solutions are O ( m 2 n ) at least. Thus, the overall computa tional complexity of LSR is abou t O ( m 2 n + n 3 + tnk 2 ) , wher e t denotes th e num ber of iterations of th e k -means m ethod. Clearly , LSR has also suffered from the large-scale p roblem as SSC and LRR did. Besides the large scale clu stering pr oblem, SSC , LRR, an d LSR hav e s uffered fr om the o ut-of-samp le p roblem, i.e. , they cannot c ope w ith the data that ar e not used to constru ct the similarity graph . For e ach previously un seen datum , SSC, LRR, and LSR have to perfo rm the algorithm over th e wh ole data set once again . T his makes them impossible to cluster incrementa l data. SSC, LRR, a nd LSR ar e summa rized in Algorithm 1. There are some meth ods ha ve been propo sed to reduce the time cost of minimizing lowest-rank matrix [ 26 ], [ 2 7 ]. How- ev er , the method s mainly focused on speed ing up the enco ding process without consideratio n of the clusterin g p rocess. D. Scalab le Sp ectral C lustering Algorithms Recently , s ome works have focused o n solv ing the large- scale clu stering p roblem of the traditional spectral cluster- ing. One natura l way is to reduce the time cost of eigen- decomp osition over the Laplacian matrix. For exam ple, [ 28 ] adopted Nystr ¨ om me thod to get th e ap proxima tion of the eigenv ectors of the wh ole si milarity matrix. [ 29 ] solved the generalized eigenv alue p roblem in a d istributed com puting platform. Another way is red ucing the data size by replacing the orig- inal data with a small nu mber of samp les. [ 30 ] presen ted a fast spectral clustering algor ithm by selecting some representativ e points from the input an d got the cluster assignmen t b ased on the ch osen samp les. [ 31 ] proposed landm ark-based spectral clustering alg orithm. The algo rithm cho oses p represen tati ve points as the lan dmarks and con structs a L aplacian matrix v ia L = A T A , wh ere the element of A ∈ R p × n is the pair wise distance between the input data and the landmarks. [ 32 ] selects the landm arks by perf orming selectiv e sampling techn ique and runnin g spectral clustering over the ch osen samples based on pairwise d istance. [ 33 ] pr oposed spectra l embed ded clustering (SEC) which gro ups ou t-of-samp le d ata in a linear projection space. The main difference among the above works is the method to hand le out-of-samp le data. Different from the above sampling-b ased method, Belabbas and W olfe [ 34 ] pr oposed a quantization b ased m ethod with theoretical justification to select in -sample data in a determin istic way . By extendin g the quantization based m ethod with self-organizing maps (SOMs), T asdemir [ 35 ] recen tly propo sed a novel method by utilizin g the quan tization p roperty of SOMs and neur al g as to h andle the large scale d ata set. Exten si ve experimental studies sh ow that this method has achiev ed im pressiv e perfo rmance co m- pared with samp ling-based method s on a ran ge of d ata sets. Although numerou s w orks have been co nducted o n speed ing up the pairwise distance based clustering meth ods, very few researches ha ve bee n do ne to enhance the scalability o f the representatio n based appr oaches. JOURNAL OF L A T E X CL ASS FILES, VOL. 13, NO. 9, SEPTEMBER 2014 4 I I I . S C A L A B L E S U B S P AC E C L U S T E R I N G A N D E R R O R A N A L Y S I S In this section, we present ou r framework which makes the representatio n b ased sub space clustering metho ds feasible to handle large scale data and ou t-of-samp le data. Our method treats the large-scale pr oblem as the o ut-of-samp le prob lem by taking the strategy of “sampling , clustering, coding, and classifying”. The fir st two steps choose a small numb er of data points as in- sample data an d calculate the cluster m embership of them. The third and fourth steps find a low-dimension al subspace to fi t each gr oup of ou t-of-samp le d ata and assign the data to the subspace th at has the minimal residu al. Note that, to solve the ou t-of-sample pro blem, only the last two steps are needed . A. The Pr oposed Methods Our fram ew ork is based on a gener al assumption as follows: Assumption 1. Supp ose the da ta set [ D ] i ∈ R m × n i is drawn fr o m the subspace S i , one could use a small portion of [ D ] i , denoted b y [ X ] i ∈ R m × p i , to learn the st ructur e of S i , where rank ([ D ] i ) = rank ([ X ] i ) , r ank ([ X ] i ) ≤ p i ≪ n i , and S i is a compac t metric space. Assumption 1 is twofold. First, it imp lies that each data point could be e ncoded as a linear combin ation o f a fe w basis ( i.e. , sparsity assumption). Seco nd, it requires th at [ X ] i and [ D ] i are indepe ndent and iden tically distributed ( i.e. , i.i.d.) so that out-o f-sample data could be represented by [ X ] i . The assumption is very general on which mo st da ta m ining and machine learning works are based. In practice, the sparsity assumption is easily satisfied for high-d imensional data such as facial images. T o satisfy the assumption of i.i.d., we need to find the r epresentative p oints X ∈ R m × p from D ∈ R m × n so that out-o f-sample data Y ∈ R m × ( n − p ) locate in the subspac es span ned by X . T o this end, some sampling techniques such as column selectio n method [ 36 ] can be used. However , these samp ling meth ods are ine ffi cient and cannot be applied to large scale setting. In th is paper , we adopt unif orm rando m sampling approach of wh ich time co st is o nly O (1) . I n addition to comp uta- tional efficiency , the unifo rm random sampling method can perfor m compar ably to the complex samp ling tech niques as shown in [ 30 ], [ 33 ]. After sampling and getting the cluster membersh ip of in-sample data X , we ha ndle out-of-sample data Y based on the k nowledge learnt fr om X . The simplest approa ch is assigning each y i ∈ Y to the nearest x j ∈ X in terms of the Euclidean distance . Howev er , su ch appro ach implicitly requires some prior knowledge. F or example, the data set must lo cate in the Euclidean space other wise y i would not be correctly clustered. In th is work , we compute the sparse repr esentation of Y over X a nd assign each y i to the near est subsp ace based on SRC [ 23 ]. For each out-of -sample data p oint y i , the following optimization problem is solved min k c i k 1 s . t . k y i − Xc i k 2 < ǫ, (4) where ǫ > 0 is the error tolerance, y i denotes an out-of-sam ple datum and X denotes in-sample data. Once the optimal c i is obtained, y i is assigned to the nearest subspace which has the minimum residual by solving r j ( y i ) = k y i − X δ j ( c i ) k 2 . (5) f ( y i ) = argmin j { r j ( y i ) } , (6) where the f ( y i ) denotes the assignm ent of y i , and the n onzero entries of δ j ( c i ) ∈ R p are the elements in c i associating with the j - th subspace. Although SR C has achie ved a lot of successes in pattern recogn ition, some r ecent work s [ 37 ] showed that non -sparse representatio n can achieve com parable results with less time cost. Therefor e, we p erform line ar c oding scheme instead of sparse one by solving min c i k y i − Xc i k 2 2 + γ k c i k 2 2 , (7) where γ > 0 is a positive real number . Th e second ter m is used to av oid over-fitting. Zhang et al. [ 37 ] named this meth od as collabo rativ e repr esentation-b ased classification (CRC) and empirically showed that collab orative repr esentation r ather than the sparse o ne plays an imp ortant role in face recogn ition. After getting the coefficient of y i via solvin g (7), y i is assigned to the subspace that produ ces the minimal regularized residuals over all classes. Note that, (7) is also known as linear regression based classifi cation [ 38 ] when γ = 0 . Under our fram e work, SSSC, SLRR, and SLSR are pr o- posed, which make SSC [ 8 ], [ 9 ], LRR [ 14 ], [ 15 ], and LSR [ 19 ] feasible to cluster large scale an d ou t-of-sample data. Al- gorithm 2 summar izes our appro aches and Fig. 2 g iv es a toy example to show th e effecti veness of o ur fram e work. In the examp le, we use the NodeXL software (a toolkit of Office) [ 39 ] to ob tain th e v isualization of the similarity g raphs (see Fig. 2(c) and Fig. 2(d)). B. Err o r Analysis In this section, we perf orm error analysis for the fra mew ork. Lemma 1 shows that th e clustering par titions so lely based o n in-sample data X ∈ R m × p will con verge to the p artitions based on the who le data set D ∈ R m × n , when n → ∞ and th e sam pled data is eno ugh. Based on L emma 1 , we show that th e er ror bou nd of our f ramework only dep end on the grou ping errors of out-of-sam ple data Y ∈ R m × ( n − p ) . Moreover , Lemma 2 is the preliminary step to our result. Lemma 1 ([ 40 ]) . Unde r Assumptio n 1, if the fi rst k eigenval- ues of L D have multiplicity 1, then the same ho lds for the first k eigen values of L X for sufficiently lar ge p , wher e L D and L X denote the Laplacian m atrix based o n D and X , r espectively . In this ca se, the first k eigen values of L X conver ge to the first k eigen values of L D , and the co rr esponding eigen vectors conver ge almo st surely . The clustering partitions constructed by no rmalized spectral clustering fr om the first k eigenvectors on finite samples conver ge almost surely to a limit partition of the whole data space. JOURNAL OF L A T E X CL ASS FILES, VOL. 13, NO. 9, SEPTEMBER 2014 5 (a) (b) (c) (d) (e) (f) Fig. 2. A toy exampl e based on SSSC and SL RR for showing the effec ti ven ess of our frame work. (a) A gi ven data set D satisfying the sparsity assumption, where the rank of the data equals two; (b) in-sample data X identi fying using unique random sampling method. X and D are i.i.d.; (c) The similarity graph of X achie ve d by SSSC; (d) The similarity graph of X achie ved by SLRR; (e) out-of-sample data Y locati ng in the union of subspaces spanned by X ; (f) The projection coef ficient s of an out-of-sampl e data point y ∈ S 2 , of which only the coef ficient s over S 2 are nonzero. y is grouped into the subspace S 2 in terms of our method, which matches with the ground truth. Under Assumption 1, this example s ho ws that our framew ork can solve the larg e-scale and the out-of-sampl e problems for representa tion-base d subspace clusteri ng without loss of clusterin g quality . Algorithm 2 Scalable Spa rse Su bspace Clusterin g (SSSC), Scalable Low Rank Repr esentation (SLRR), and Scalable Least Square Regression (SLSR). Input: A given da ta set D ∈ R m × n , the desire d n umber of clusters k , and the r igid regression p arameter γ = 1 0 − 6 . 1: Randomly select p data points fr om D as in-sample data X = ( x 1 , x 2 , . . . , x p ) . The remain ing samples are u sed as out-of -sample da ta Y = ( y 1 , y 2 , . . . , y n − p ) . 2: Perform SS C or LRR or LSR (Algorithm 1) over X to get the cluster member ship of X . 3: Project ea ch ou t-of-sample data po int y i into th e unio n of the subspaces spanned by X via solving c ∗ i = ( X T X + γ I ) − 1 X T y i . (8) 4: Calculate the residuals of y i over the j -th subspace by r j ( y i ) = k y i − X δ j ( c ∗ i ) k 2 . (9) or the r egularized residuals of y i over all subspaces via solving r j ( y i ) = k y i − X δ j ( c ∗ i ) k 2 k δ j ( c ∗ i ) k 2 . (10) 5: Assign y i to the sub space which has the minima l r esidual by f ( y i ) = argmin j { r j ( y i ) } . (11) Output: The cluster membersh ip o f D . From Lemma 1, we c an find that the additi ve clusterin g error induced by our frame work comes from the process of grouping out-of -sample d ata Y . Th us, the prob lem becomes find ing th e error boun dary of the Nearest Sub space (NS) classifier (( 9) or (10)). The representation -based NS classifiers have been exten- si vely studied in [ 23 ], [ 3 7 ], [ 41 ], howe ver , theo retical analy sis on it recei ves little atten tion. [ 42 ] presents a th eoretical expla - nation to SRC [ 2 3 ] f rom the view of m aximizing perfo rmance margin. Howev er , the erro r boun dary of SRC is still unkn own. In this paper, we mainly investigate the p erforma nce of SRC ( i.e. , (9)) fro m th eoretical pe rspectiv e. T o th e be st o f o ur knowledge, this is the first work to an alyze the err or boun ds for the NS classifiers. It is challen ging to perform error analy sis on the NS classifiers because the active s ets (the non zero set of c ) of different data poin ts ar e different. In oth er words, it is d ifficult to find an in variant set of supp ort vectors to represen t e ach subspace. Theref ore, the classic margin analysis theory cann ot be dir ectly used to the NS classifiers. T o solve th is problem , we propo se tr eating each subspace as a p oint in a h yperspace. W e ha ve the follo wing definition. Definition 1. The hyperspace H = { S, y } is a set of subspaces, in which each subspace S j corr esponds to a point and the d istance between y i and S j is defi ned as the r esidua l r j ( y i ) . Based on the above definitio n, the NS classifier cou ld b e regarded as th e ne arest neighb or classifier in th e hyp erspace (see Fig. 3) so that o ne can av oid to find the suppo rt vectors for each category . Note that, [ 43 ] trea ts each subspace as a data p oint in the Grassmann space in wh ich the distance is defined as th e prin ciple angle between the sub spaces. Clearly , the ad opted distance m etric is t he major d if ference between Grassmann spa ce and th e above defined hyp erspace. Indeed, Grassmann space can be regarded as a special case of th e hypersp ace, which will b e furth er discussed at the end o f this section. Lemma 2 ( Cover -Hart inequality [ 44 ]) . F or a ny distribution of ( Y , g ( Y )) , the a symptotic err or R of the n ear est neighbo r classifier is bounde d by R ∗ ≤ R ≤ R ∗ 2 − k k − 1 R ∗ , (12) wher e g ( Y ) is the gr oun d truth for Y , k d enotes the numb er of subject, and R ∗ denotes the Bayes err o r which is the lowest possible err or rate fo r a given class of classifier . Based on Lemma 2 , the prob lem is equivalent to estimating the Bayes error in the define d hyper space. W ithou t loss o f generality , we deal with the case of binary classification, i.e. , k = 2 and f ( y ) = {− 1 , 1 } . Lemma 3 . The err or boun d of the nearest sub space cla ssifier f ( y i ) = argmin j {k y i − X δ j ( c ∗ i ) k} , (13) JOURNAL OF L A T E X CL ASS FILES, VOL. 13, NO. 9, SEPTEMBER 2014 6 S 1 S 1 S 2 S 2 y i y i r 1 r 1 r 2 r 2 (a) y i y i S 2 S 2 S 1 S 1 r 2 r 2 r 1 r 1 cos cos (b) (c) Fig. 3. (a) T wo subspaces S 1 and S 2 spanned by in-sample data. W e denote an out-of-sample data point by y i . θ is the principa l angle between S 1 and S 2 , and r 1 and r 2 are the residuals associat ing wi th S 1 and S 2 . (b) The hyperspace in which S 1 and S 2 are regarde d as two data points. (c) the decision boundary of the nearest subspace classifier in the hyperspace. is given by | 1 − max( α − 1 , α 1 ) | 2 + α − 1 + α 1 ≤ R ≤ min(0 . 5 , 2 + 2 min( α − 1 , α 1 ) | 1 − α − 1 | + | 1 − α 1 | ) ) , (14) wher e y i ∈ R m is the input, c ∗ i = Θy i , α j = k [ X ] j Θ k F , [ X ] j ∈ R m × p r eplaces the elemen ts of X with zer o s unless the elements belong to S j , j = { 1 , 2 } deno tes the inde x o f subject, Θ = ( X T X + γ I ) − 1 X T , an d the nonzer o entries of δ j ( c ∗ i ) ∈ R p ar e the elemen ts in c ∗ i associated with the subspace S j . Pr o of. Let η ( y i ) be th e con ditional prob ability that th e pre- diction for a given y i is 1 , i.e. , η ( y i ) , p ( f ( y i ) = 1 | y i ) . I n this case, the Bayes error R ∗ for y i is given by R ∗ ( y i ) = min { η ( y i ) , 1 − η ( y i ) } (15) According to (15), it is obvious that 0 ≤ R ∗ ( y i ) ≤ 0 . 5 . W e define the prob ability that y i belongs to the subspace S j using the residual r j ( y i ) = k y i − X δ j ( c ∗ i ) k 2 , i.e. , η ( y i ) = 1 − r 1 ( y i ) P r j ( y i ) . (16) Let δ j ( c ∗ i ) = ∆ j c ∗ i , where ∆ j ∈ R p × p is a diag onal matrix of which nonzero diagonal e ntries indicate the columns o f X belongin g to the subspace S j . Since c ∗ i = Θy i , we have r j ( y i ) = y i − [ X ] j Θy i 2 , (17) where [ X ] j = X∆ j . Thus, to find the bou nd of (1 3), we only need to iden tify the lower and upper b ounds of r j ( y i ) . Step 1: Fro m the reverse tr iangle in equality of vecto r norm, we have r j ( y i ) ≥ k y i k 2 − k [ X ] j Θy i k 2 . (18) For any vectors x a nd y , Cauch y-Schwarz inequality sug- gests that k x T y k 2 ≤ k x k 2 k y k 2 . Since the Frobenius norm is subordin ate to ℓ 2 -norm , (1 8) gi ves th at r j ( y i ) ≥ k y i k 2 − k [ X ] j Θ k F k y i k 2 = 1 − k [ X ] j Θ k F k y i k 2 , (19) where k · k F denotes the Frobenius norm. Step 2: F or any vector s x and y , it must hold th at k x − y k 2 ≤ k x + y k 2 ≤ k x k 2 + k y k 2 . Thus, we ha ve r j ( y i ) = y i − [ X ] j Θy i 2 ≤ k y i k 2 + k [ X ] j Θy i k 2 ≤ k y i k 2 + k [ X ] j Θ k F k y i k 2 = 1 + k [ X ] j Θ k F k y i k 2 (20) Let α j = [ X ] j Θ F 2 and comb ine ( 16), (19), and (20), we have | 1 − α − 1 | 2 + α − 1 + α 1 ≤ η ( y i ) ≤ 1 + α − 1 | 1 − α − 1 | + | 1 − α 1 | , (21) and | 1 − α 1 | 2 + α − 1 + α 1 ≤ 1 − η ( y i ) ≤ 1 + α 1 | 1 − α − 1 | + | 1 − α 1 | , (22) respectively . Clearly , the boundar y of the expected Bayes error R ∗ = E { R ∗ ( Y ) } is indepen dent of th e out-of- sample data Y . Fr om Lemma 2, the following relation s hold: R ∗ ≤ R ≤ 2 R ∗ (1 − R ∗ ) ≤ 2 R ∗ . (23) Since 0 ≤ R ∗ ≤ 0 . 5 , the n from (21), (22), and (2 3), we have | 1 − max( α − 1 , α 1 ) | 2 + α − 1 + α 1 ≤ R ≤ min(0 . 5 , 2 + 2 min( α − 1 , α 1 ) | 1 − α − 1 | + | 1 − α 1 | ) . (24) This completes the proof. From the above analysis, we can con clude th at: • Th e error bo und only dep ends on the stru cture of th e sub- spaces span ned by in-samp le data u nder Assum ption 1. Indeed , the stru cture of the su bspaces is also the un ique factor to af fect the clustering quality as sho wn in [ 9 ], [ 15 ]. Thus, we argue that o ur framework solves the large-scale and the o ut-of-samp le pro blems f or the repr esentation- based su bspace c lustering methods with out in troducing new error factors. This is largely different from the tra- ditional methods [ 30 ], [ 45 ] whose perform ance depends on the sampling rate. 2 In practic e, we often normalize α j via α j = α j / P j α j . JOURNAL OF L A T E X CL ASS FILES, VOL. 13, NO. 9, SEPTEMBER 2014 7 1 5 9 13 17 21 25 29 33 37 0.1 0.15 0.2 0.25 0.3 0.35 0.4 0.45 0.5 0.55 Ind ex of Subset Classification Error Classific atio n Erro r L owe r Erro r Bou nd Uppe r Erro r B oun d (a) γ = 10 − 6 1 5 9 13 17 21 25 29 33 37 0 1 2 3 4 5 6 7 8 9 x 1 0 -5 Ind ex of Subset Classification Error L owe r Err or Bou nd G ap Upper Erro r B oun d Gap (b) γ = 10 − 6 1 5 9 13 17 21 25 29 33 37 0.1 0.15 0.2 0.25 0.3 0.35 0.4 0.45 0.5 0.55 Ind ex of Subset Classification Error Classific atio n Erro r L owe r Erro r Bou nd Uppe r Erro r B oun d (c) γ = 10 − 12 1 5 9 13 17 21 25 29 33 37 0 0.5 1 1.5 2 2.5 3 3.5 4 4.5 5 x 1 0 -5 Ind ex of Subset Classification Error L owe r Erro r Bou nd Gap Upper Erro r B oun d Gap (d) γ = 10 − 12 Fig. 4. A real-w orld example to valida te the estimated error bounds. (a) and (c): Classificati on error and error bound of eq.(13) on 37 subsets of E xtende d Y ale database B. Each subset consists of the samples from the first category and another category . (b) and (d): The gap between two differe nt error bounds deri ve d from equatio ns (22) and (25). • Con sidering X T X is well c onditioned , then one sets γ = 0 . α j = [ X ] j X measur es the similar ity betwee n the sub space [ X ] j and X u sing their in ner pro duct. More generally ( i.e. , γ > 0 ), let θ i be the i -th princip al angle between [ X ] j and Θ , th en, it ho lds that σ i = cos θ i , where σ i is the i -th sing ular v alue of [ X ] j Θ . According to th e d efinition of the Frob enius nor m, i.e. , α j = q P r j i σ 2 i , we have α j = k [ X j ] Θ k F = q P r j i cos 2 θ i which measures the distance between [ X ] j and Θ by their principal angles, where r j is the rank of [ X ] j Θ . Under Assumption 1, our error analysis method is validate only when the following two co nditions are satisfied whe n: 1) the d ata are sampled fro m two subsp aces, i.e. , k = 2 . If k > 2 , one may extend our metho d by recu rsi vely tr ansformin g th e multiple clusters problem into binary one e ven though this t ask may need massi ve ef fort; and 2) in-sample data [ X ] j have b een correctly clustered. Otherwise, one need s id entify th e error bound for the wh ole framework n ot just for g roupin g o ut-of- sample data. The difficulty of this task is how to id entify the influence of per turbation due to sampling . A possible way to solve th is prob lem is p erturbatio n theory that has b een stud ied in quantum mechanics. Ho wev er , this is beyond the m ain scope of this paper . T o validate our theoretical results, we perfor m experimen ts on 37 sub sets o f Extended Y a le database B [ 46 ]. Each subset consists of th e sam ples f rom th e first ca tegory and one of the o thers. W e use 6 4 (32 samp les per subject) samp les for training and the remaining sam ples for testing. Moreover , we use pr inciple co mponen ts analysis (PCA) as the preproc ess step to extract 60 features from training and testing data. Fig. 4 shows results fro m which one can find that: • W e successfully estimate the er ror bound s for 3 3 and 34 o ut o f 37 subsets in the case o f γ = 10 − 6 and γ = 10 − 12 , respectively . The failure ca ses m ay b e attributed to the following rea sons: Fi rst, the classification error (solid line) is calculated based on training d ata and testing data , whereas the error bound s (dotted lines) are estimated on ly based o n trainin g d ata. When training data cann ot represen t the distribution of the whole data space, the estimated bounds will be in correct. Second, our an alysis is based on Assump tion 1, which m ay n ot be perfectly satisfied by real-world data ( e.g. , the Extend ed Y ale database B) since real-world data is of ten complex. • Figs. 4(a) and 4(c) show that a larger γ m ay reduce th e classification err or rate, while increasing th e failure rate of our e rror analysis me thod. The reason is tha t γ is used to avoid overfitting by a dding a value to the d iagonal entries o f X T X , which actually affects the structur e of the observed data. JOURNAL OF L A T E X CL ASS FILES, VOL. 13, NO. 9, SEPTEMBER 2014 8 T ABLE II C O M P U TA T I O NA L C O M P L E X I T Y O F S S C , L R R , L S R , A N D T H E I R S C A L A B L E V E R S I O N S P RO P O S E D I N T H I S PA P E R . t 1 , t 2 , A N D t 3 C O R R E S P O N D T O T H E N U M B E R O F I T E R A T I O N S O F T H E ℓ 1 - S O LV E R , T H E R A N K - M I N I M I Z E R , A N D T H E K - M E A N S C L U S T E R I N G M E T H O D , R E S P E C T I V E L Y . Algorith ms Time Comple xity Space Complex ity SSC [ 8 ], [ 9 ] t 1 mn 3 + t 2 nk 2 mn 2 SSSC t 1 mp 3 + t 2 pk 2 + np 2 mp 2 LRR [ 14 ], [ 15 ] t 3 ( m 2 n + n 3 ) + t 2 nk 2 mn 2 SLRR t 3 ( pm 2 + p 3 ) + t 2 p 3 + np 2 mp 2 LSR [ 19 ] m 2 n + n 3 + t 2 nk mn 2 SLSR pm 2 + np 2 + t 2 pk mp 2 • Besides (22), we der i ve another bou nd for 1 − η ( y i ) from (21) instead of (16), (19), and (20), i.e. , 1 − 1 + α − 1 | 1 − α − 1 | + | 1 − α 1 | ≤ 1 − η ( y i ) ≤ 1 − | 1 − α − 1 | 2 + α − 1 + α 1 . (25) Figs. 4(b) and 4 (d) shows the gap between these two different formu lations. Clearly , the gaps are clo se to zero . C. Complexity Analysis Suppose p sam ples a re selected f rom n data poin ts with dimensiona lity of m , SSSC needs O ( t 1 p 2 m 2 + t 1 mp 3 + p 2 + t 2 pk 2 ) to get the cluster membersh ip of in -sample d ata when the Homo topy o ptimizer [ 47 ] is used to solve th e ℓ 1 - minimization p roblem and the Lanczos eigensolver is used to compute the eigenvectors o f L ∈ R p × p , where k is the num ber of clusters, and t 1 and t 2 is the num ber of itera tions of Ho- motopy op timizer and the k-mea ns algorithm, respectively . T o group out-of -sample d ata points, SSSC need s to compute the pseudo- in verse o f the an m × m matrix an d calculate th e linear representatio n of Y ∈ R m × ( n − p ) in O ( p m 2 + p 3 + ( n − p ) p 2 ) . Putting ev erything togeth er , the co mputation al com plexity of SSSC is O ( t 1 mp 3 + t 2 pk 2 + np 2 ) since k , m < p ≪ n . Clearly , the cost of SSSC is largely less than that of SSC ( O ( t 1 mn 3 + t 2 nk 2 ) ). In th e similar way , one can g et th e computatio nal comp lexities o f SLRR and SLSR. T able II reports the comp utational complexities o f ou r meth ods and the origina l algo rithms. I V . E X P E R I M E N T A L R E S U LT S In this section, we carry o ut so me experimen ts to sho w th e effecti veness and efficiency of SSSC, SLRR, and SLSR. The experiments consist of five parts, Section IV -C in - vestigates the per formanc e of our m ethods to th e varying parameters; S ection IV -D reports the results of all the e v aluated algorithm s with different sampling rates; Section I V -E com- pares o ur method s with the correspondin g original alg orithms on three facial data sets. Moreover , we also inv estigate th e perfor mance o f two nearest subspac e classifiers (9) and (10); Section I V -F rep orts th e clu stering quality of the tested meth- ods on three mediu m-sized data sets inclu ding facial images, handwritten d igital data, and do cumental corp us; Section IV -G shows the re sults on three large scale d ata sets. A. Data Sets W e per form experiments o n nin e real-world data sets in- cluding facial images, hand written dig ital da ta, n ews corpu s, etc. The data sets consist of three small- sized data sets, three medium- sized data sets, an d th ree large scale data sets. W e presented so me statistics of the data sets in T ab le III and a brief description as follows. In general, facial images are assumed to be loca ted in the low-dimensional manifo ld. In the e xperime nts, we inv estigate four popu lar facial d ata sets, i.e. , AR [ 48 ], Extend ed Y ale database B (ExY aleB) [ 46 ], Labeled Faces in the Wild-a (LFW) [ 49 ], an d Multi-PIE (M PIE) [ 50 ]. AR includes over 4,000 face imag es o f 126 peop le (70 male and 56 fem ale). In our implem entation, we used a subset o f AR which contains 1,40 0 clean faces rand omly selected f rom 50 male subjects and 50 female subjec ts. LFW con tains 13 ,123 images captured from uncontr olled environment with variations of pose, illumin ation, expression, misalignmen t, and occlusion . W e u se a sub set of th e alig ned LFW which includ es 143 subjects with no less tha n 1 1 samples per sub ject. MPIE contains the facial images of 28 6 individuals cap tured in four sessions with simu ltaneous variations in pose, expre ssion and illumination 3 . W e use all frontal images from all the sessions. For c omputation al efficiency , we downsize AR im ages from 165 × 120 to 55 × 4 0 ( 1 / 9 ), ExY aleB images f rom 192 × 1 68 to 48 × 4 2 ( 1 / 16 ), and MPIE ima ges fro m 10 0 × 82 to 50 × 4 1 ( 1 / 4 ) . Mor eover , we perfo rm PCA over the d ownsized data to retain 98% energy . For each LFW image, “divide and conquer” strategy is ado pted as did in [ 51 ]. I n details, ea ch imag e is partitioned into 2 × 2 blocks; and then the d iscrimination- enhanced featu re in each block is extracted; after that, all blocks’ fea tures are con catenated to form th e fin al f eature vector . Reuters-215 78 (RCV) [ 52 ] is a d ocumen tal corpu s. I n the experiments, the first 785 principle com ponents of RCV are extracted a s the featu res. W e also use thr ee UCI da ta sets 4 , i.e. , PenDigits, Covtyp e [ 53 ], and PokerHand [ 54 ]. Poker- Hand is an unbalan ced data set, o f which the m aximal class contains 50 1,209 samples, comp ared with 3 samples of the minimal cla ss. W e examin e th e perfo rmance of th e tested algorithm s using the original data set (PokerHand- 2) an d a subset (PokerHa nd-1) with 9 71,32 9 data p oints fro m three largest subjects. B. Baseline Algorithms and Evaluation Metrics Spectral clustering and kern el-based clu stering methods are popu lar to cope with linearly insepa rable data. So me studies [ 56 ] have established the equ i valence between them. In the experiments, we co mpare the pr oposed meth ods with fo ur scalable spectral clusterin g a lgorithms (KASP [ 30 ], Nystr ¨ om approx imation based spectral cluster ing [ 28 ], [ 29 ], LSC [ 31 ], and SEC [ 33 ]) and on e scalable kern el-based clustering ap- proach (AKK [ 45 ]). M oreover , we rep ort the results of the k-means clustering algorithm [ 57 ] as a baseline. Besides our 3 illumina tions of the used MPIE: 0,1,3,4,6,7,8, 11,13,14,16,17,18,19 4 http:/ /archi ve.ics.uci.edu/ml/datasets.html JOURNAL OF L A T E X CL ASS FILES, VOL. 13, NO. 9, SEPTEMBER 2014 9 T ABLE III D ATA S E T S U S E D I N T H E E X P E R I M E N T S . T H E N U M B E R I N T H E PA R E N T H E S E S D E N O T E S T H E R E TAI N I N G E N E R G Y B Y P C A . Data sets # samples Dim. # features # classes AR [ 48 ] 1,400 19,800 167 (98%) 100 ExY aleB [ 46 ] 2,414 32,256 114 (98%) 38 LFW [ 55 ] 4,174 62,500 560 143 MPIE [ 50 ] 8,916 8,200 115 (98%) 286 RCV [ 52 ] 8,293 18,933 785 (85%) 65 PenDigit s 10,992 16 16 10 Covt ype [ 53 ] 581,012 54 54 7 PokerHa nd-1 [ 54 ] 971,329 10 10 3 PokerHa nd-2 [ 54 ] 1,000,000 10 10 10 own implemen tation, we also qu ote som e results directly from the literature. W e in vestigate the p erforman ce of two variants of Nystr ¨ om- based methods and LSC, d enoted as Nystr ¨ om, Nystr ¨ om -Orth, LSC R, an d LSC K. The affinity matr ix of Nystr ¨ om- Orth is ortho gonal, w hereas th at o f Nystr ¨ om is not. SEC obtains the results b y perfo rming k -means in the embedd ing space. All alg orithms ar e implem ented in MA TLAB. Th e used data sets and the cod es of our algo rithms can b e downloaded at www .mac hineilab.org/users/pengxi/ . The ev aluated algo rithms take two appro aches to find in- sample d ata. Specifically , SSSC, SLRR, SLSR, Nystr ¨ om, Nystr ¨ om Orth, LSC R, SEC and AKK identify in-sample data by p erformin g unifor m rand om sampling m ethod, whereas KASP and LSC K ad opt the k-mean s clustering meth od. T o av oid the disparity in da ta partitions, we pr e-partition each data set into tw o parts, in-sample data and out-o f-sample data. After that, we run different algorithms r un over these data partition s. W e measure the clustering quality using Accu racy [ 58 ] and Normalized Mutual I nformatio n ( NMI ) [ 52 ] between the pro- duced clusters and the ground tru th cate gories. The Accuracy or NMI of 1 ind icates perfect match ing with the true subsp ace distribution, whereas 0 indicates totally mismatch. T o b e consistent with the previous works [ 9 ], [ 15 ], we tune the param eters of all the ev aluated me thods to achieve the high est Accuracy . For SSSC, we ad opted th e H omotopy optimizer to solve the ℓ 1 -minimization problem. The optimize r has two user-specified para meters, sparsity p arameter λ and error toleran ce parame ter δ . W e tuned the par ameters in the range of λ = (10 − 7 , 1 0 − 6 , 1 0 − 5 ) an d δ = (1 0 − 3 , 1 0 − 2 , 1 0 − 1 ) . For SLRR and SLSR, the value of λ is chosen as shown in Fig. 5. Referr ing to the parame ter setti ng in [ 29 ], [ 30 ], [ 31 ], [ 33 ], [ 45 ], the p arameter τ of KASP and Nystr ¨ om was set as [0 . 1 , 1] with an interval of 0 .1 and [2 , 20] with an in terval of 1; the parameter σ o f AKK ranges fro m [0 . 1 , 1] with an interv al of 0 . 1 ; SEC has th ree user -specified parameters, i.e . , the size of neighbo rhood r , b alanced p arameters µ and γ . W e set γ = 1 , µ = [10 − 9 , 1 0 − 6 , 1 0 − 3 , 1 0 0 , 1 0 +3 , 1 0 +6 , 1 0 +9 , 1 0 +12 , 1 0 +15 ] , and r fro m 2 to 2 0 . Moreover, the same value ran ge of r was used for KASP and LSC. Follo wing the c ommon ben chmarkin g p rocedu res, we run each algor ithm fiv e times on each data set an d rep ort the final results by the mean and standard deviation o f the Accuracy ( NMI ) an d the mean of time costs. C. The Influen ce of P arameters SSSC uses λ > 0 to contro l the spar sity of the r epresen- tation an d ǫ > 0 to measure the reconstructio n errors. SLRR uses λ > 0 to balance dif ferent parts in th e objective fun ction and SLSR utilizes λ > 0 to av oid overfitting. T he c hoice of these parameters depend s on the data distribution. Fig. 5 shows the results of SSSC, SLRR, and SLSR with different p arameter v alues. When λ or ǫ of SSSC is assigned with a small positi ve value (from 10 − 7 to 0 . 01 ), it achie ves a good p erforman ce. When the param eters are assigned with a big value, th e p erforma nce of SSSC is degraded . F or SLRR, while λ ranges fr om 0.5 to 3. 9, its A ccuracy and NMI a re almost u nchang ed. SLSR perfor ms worse with incr easing λ . This verifies our claim that a sma ll λ is prefe rable to the clean data set. D. The Influ ence of I n-sample Data Size T o study the influe nces of in-sample data size p , we perform experiments on ExY aleB by setting p = 38 × ˜ p , where ˜ p denotes the sample size per subjec t and it increases from 6 to 54 with an interval o f 6. Fig. 6 r eports the re sult, f rom which we have the following observations: • Ex cept SEC and AKK, all the scalable clustering methods outperf orm the k-m eans method in A ccuracy and NMI . SSSC, SLRR, and SLSR are superio r to the oth er inv esti- gated app roaches b y a con siderable p erform ance margin . For examp le, SLRR achieves 1 5.1% gain in A ccuracy and 13.1% gain in NMI over th e b est baseline algo rithm (Nystr ¨ om) when p = 22 8 . • In mo st cases, all the algo rithms except N ystr ¨ om and Nystr ¨ om Orth perform b etter with inc reasing p . The possible reaso n fo r this result is that Nystr ¨ om an d Nystr ¨ om Orth speed up the clustering p rocess by redu c- ing the size of affinity ma trix rather than data size. • Th e accur acy o f SLRR decr eased when p incr eased fro m 912 to 1368 . The result seems in consistent with the common sense that m ore data tend to brin g better per for- mance. This result can b e attributed to the characteristic of SLRR, i.e., SLRR is ba sed o n low rank repr esentation that incorp orates the relations amo ng different subsp aces. Increasing p would result in mor e intersections among different sub spaces an d w eaken the discrimination of model. T o o btain an optimal p , some mo del selection methods such as M -estimator [ 59 ] could be used. E. Clustering on Small Scale Data W e carry o ut the experiments on thr ee facial data sets, i.e. , AR, ExY a leB, an d LFW . Moreover , we in vestigate the perfor mance o f o ur m ethods wh en the classifiers ( 9) and (10) are used to grou p out- of-sample data. In the experiments, we fix ǫ = 10 − 3 for SSSC and SSC. From T ab le IV, we can find that • Ou r f ramew ork successfu lly makes SSC, L RR, a nd LSR feasible to g roup o ut-of-samp le data with ac ceptable lo ss JOURNAL OF L A T E X CL ASS FILES, VOL. 13, NO. 9, SEPTEMBER 2014 10 1e-7 1e-6 1e-5 1 e-4 1e-3 0.01 0.1 0.2 0 .3 0 .4 0.5 0.6 0 .7 0 .8 0.9 20 25 30 35 40 45 50 55 60 The sparsi ty param eter λ Clustering Qu ality (%) Accuracy NMI (a) T he influences of the parameter λ of SSSC, where δ = 10 − 3 . 1e-7 1 e-6 1e-5 1 e-4 1 e-3 1 e-2 0 .1 0.2 0 .3 0.4 0.5 0 .6 0 .7 0.8 0 .9 15 20 25 30 35 40 45 50 55 60 The error t oleran ce ε Clustering Qu ality (%) Accuracy NMI (b) The influence s of the paramet er δ of SSSC, where λ = 10 − 3 . 0.1 0.3 0 .5 0.7 0.9 1.1 1.3 1 .5 1 .7 1.9 2.1 2 .3 2.5 2.7 2.9 3.1 3 .3 3 .5 3.7 3 .9 10 20 30 40 50 60 70 80 The b alanc e paramete r λ Clustering Qu ality (%) Accuracy NMI (c) T he influence s of the parameter λ of SLRR. 1e-4 1e-3 1 e-2 0.1 0.2 0.3 0.4 0.5 0.6 0.7 0.8 0.9 1.0 20 25 30 35 40 45 50 55 60 65 70 The b alanc e paramete r λ Clustering Qu ality (%) Accuracy NMI (d) The influences of the parameter λ of SLSR. Fig. 5. The influence of the parameters. A half of images (1212) are chosen from ExY aleB as in-sample data and the rest are used as out-of-sample data. The x-coordina te denotes the val ues of the paramete rs, and the y-coordinat e corresponds to the clustering quality ( A ccur acy and NMI ). in clusterin g quality . For example, the Accuracy of SSC on AR d ata set is 9.7 3% h igher th an that of SSSC, whereas the time co st o f SSC is abou t three times that of SSSC . W ith the increase of data size, SSC, LRR, and LSR will fail to get the resu lts, wh ereas SSSC, SL RR, SLSR can get the results with an acceptable time cost. • Com pared with the o ther scalable m ethods ( i.e. , KASP , Nystr ¨ om, Nystr ¨ om Orth, LSC R, LSC K, SEC, an d AKK), SSSC, SLRR, and SLSR find an elegant balance between the clu stering quality and the time costs. Al- though SS SC, SLRR, and SLSR are not the fastest, they achieve the best results. • SLRR per forms b etter than SSSC in th e tests. Th e p os- sible r eason is that the low rank repr esentation cou ld capture the stru cture am ong different categorie s, wh ereas sparse representation canno t, as pointed out in [ 21 ]. Moreover , the regulariz ed residu al based classifier (10) perfor m slightly b etter th an the no n-regularized residual based classification method (9). • Nie et al. [ 33 ] investigated the perfor mance o f SEC on ExY aleB. The highest A ccuracy of SEC is about 42.8% in their tests, compar ing with 22.02% in o ur experimen t. The p otential r eason fo r the perform ance d ifference is that they ado pted spectral rotatio n to get th e cluster mem- bership, whereas we use th e k-means clustering me thod. Note that, the b est result ( 42.8%) o f SE C reported in their work is rem arkably lo wer than the results achieved by SSSC ( 55 . 5 ± 1 . 26 ) , SLRR ( 68 . 9 ± 1 . 19 ), and SLSR ( 58 . 9 ± 1 . 45 ). F . Clustering on Medium Scale Data This section investigates th e p erforma nce o f our me thods on MPIE (facial images), RCV (docu mental cor pus), an d PenDigits (hand written digital data) . The tuned ǫ of SSSC are 10 − 4 , 0 . 1 , an d 0 . 0 1 , respectively . T a ble V repo rts the clustering quality and the time cost (seconds) of th e te sted methods, from which we can find that • Ou r method s outperfor m th e other scalable metho ds. For example, SLRR achieves a 10.4% g ain in Ac- curacy on MPIE over the best comp eting algorithm (Nystr ¨ om Orth), and the gains ach iev ed by SSSC an d SLSR are about 7.3% and 8.6%, respectiv ely . • Th e run ning time is a weakness of SSSC, SLRR, and SLSR even th ough they are mor e efficient tha n the or igi- nal appro aches. W e h a ve found that most of the time was consumed to handle in-samp le data. For example, SSSC takes 84 0.6 seco nds to cluster in- sample data an d 220.6 3 seconds to han dle o ut-of-samp le data in the case o f RCV . Since in-sample data clustering is an offline proc ess, we assume that o ur algo rithms are more competitive in large scale setting as sho wn in Section IV -G. JOURNAL OF L A T E X CL ASS FILES, VOL. 13, NO. 9, SEPTEMBER 2014 11 228 456 684 9 12 1 140 1368 159 6 1 824 205 2 0 10 20 30 40 50 60 70 The Numb er of the In-s ample data Accuracy (%) SSSC SLRR SLSR KASP Nystrom Nystrom_Orth LSC_R LSC_K SEC AKK k-means (a) A ccura cy versus the varyi ng in-sample data size 228 458 684 9 12 1 140 1368 159 6 1 824 205 2 0 10 20 30 40 50 60 70 The Numb er of the In-s ample Data NMI (%) SSSC SLRR SLSR KASP Nystrom Nystrom_Orth LSC_R LSC_K SEC AKK k-me ans (b) NM I versus the varying in-sample data size Fig. 6. Clusteri ng quality of the competing algori thms on the Extended Y ale databa se B. T he x-coordin ate denotes in-sample data size and the y-coordinate denotes the clustering quality ( Accuracy or NMI ). T ABLE IV P E R F O R M A N C E C O M PA R I S O N ( M E A N ± S T D ) A M O N G D I FF E R E N T A L G O R I T H M S OV E R T H R E E P O P U L A R F AC I A L DATA S E T S . Data sets AR ( p = 700 ) ExY aleB ( p = 1212 ) LFW ( p = 1000 ) Algorith m Accu racy (%) NMI (%) T ime Accurac y (%) NMI (%) T ime Accurac y (%) NMI (%) T ime SSSC 60.4 ± 1.74( 10 − 5 ) 80.8 ± 0.99 142.2 55.5 ± 1.26( 10 − 5 ) 60.3 ± 0. 29 128.0 27.6 ± 0.51( 10 − 6 ) 43.7 ± 0.12 184.0 SLRR 70.6 ± 1.50( 3 . 1 ) 87.3 ± 0.44 40.1 68.9 ± 1.19 ( 2 . 9 ) 74.0 ± 0. 60 26.8 30.4 ± 0.46 ( 0 . 7 ) 44.8 ± 0.19 228.4 SLSR 78.7 ± 1.42 ( 10 − 2 ) 89.6 ± 0.40 32.4 58.9 ± 1.45( 10 − 4 ) 65.2 ± 0. 61 21.4 28.5 ± 0.32( 0 . 7 ) 43.8 ± 0.32 213.4 KASP [ 30 ] 32.5 ± 0.55( 0 . 1 ) 63.6 ± 0.57 134.8 20.6 ± 1.28( 8 ) 31.3 ± 0.93 37.8 25.1 ± 0.93( 7 ) 42.7 ± 0.40 251.4 Nystr ¨ om [ 29 ] 62.2 ± 1.71( 2 ) 82.1 ± 1.16 2.3 20.7 ± 1.16( 12 ) 39.7 ± 0.63 8.2 26.6 ± 0.81( 0 . 6 ) 42.0 ± 0.33 3.2 Nystr ¨ om Orth 57.5 ± 3.55( 0 . 9 ) 79.1 ± 1.80 13.7 21.4 ± 1.50( 3 ) 40.3 ± 1.01 60.9 26.7 ± 0.86( 0 . 5 ) 41.0 ± 0.37 11.3 LSC R [ 31 ] 31 .1 ± 0.71( 4 ) 61.3 ± 0.52 1.7 32.3 ± 0.91( 2 ) 43.7 ± 0.34 7.3 25.9 ± 0.48( 3 ) 41.5 ± 0.28 3.9 LSC K [ 31 ] 32.9 ± 0.79( 4 ) 62.9 ± 0.50 2.2 31.2 ± 2.07( 2 ) 42.1 ± 1. 33 8.3 22.0 ± 0.50( 10 ) 41.6 ± 0.28 5.1 SEC [ 33 ] 25.9 ± 1.81( 10 +9 , 8 ) 41.1 ± 1.60 1.7 22.0 ± 1.68( 10 − 9 , 1 ) 39.4 ± 1.85 10.3 25.2 ± 1.68( 10 +12 , 4 ) 40.4 ± 1.49 2.3 AKK [ 45 ] 22.0 ± 1.28( 0 . 2 ) 52.0 ± 1.09 0.8 6.8 ± 0.48( 0 . 4 ) 5.5 ± 0.82 3.0 16.0 ± 0.99( 0 . 3 ) 34.7 ± 0.81 2.7 SSSC2 5 8.3 ± 1.38( 10 − 5 ) 79.6 ± 0.49 79.6 57.8 ± 1.21( 10 − 5 ) 62.3 ± 0. 60 65.0 26.5 ± 0.22( 10 − 6 ) 43.2 ± 0.11 212.7 SLRR2 69.1 ± 2.50( 3 . 1 ) 86.2 ± 0.77 39.8 71.8 ± 0.91( 2 . 9 ) 77.3 ± 0. 45 30.1 29.1 ± 0.49( 0 . 7 ) 43.9 ± 0.08 321.6 SLSR2 77.6 ± 1.30( 10 − 2 ) 88.7 ± 0.55 30.1 61.2 ± 1.35( 10 − 4 ) 67.3 ± 0. 90 23.6 28.8 ± 0.39( 0 . 7 ) 43.6 ± 0.15 232.4 k-means [ 57 ] 29.1 ± 0.59(-) 58.4 ± 0.43 18.8 8. 4 ± 0.50(-) 9 .9 ± 0.72 50.2 19.4 ± 0. 56(-) 37.3 ± 0.27 87.7 SSC [ 9 ] 70.1 ± 1.85( 10 − 7 ) 86.4 ± 0.73 361.4 59.0 ± 0.91( 10 − 3 ) 65.1 ± 0. 34 344.9 31.6 ± 0.64( 10 − 5 ) 47.5 ± 0.24 804.0 LRR [ 15 ] 78.6 ± 0.02( 1 ) 89.3 ± 0.59 152.9 73.7 ± 0.01 ( 2 . 1 ) 78.5 ± 0.46 46.9 36.4 ± 0.02( 3 . 2 ) 51.3 ± 0.36 623.1 LSR [ 19 ] 81.4 ± 1.77 ( 10 − 2 ) 91.4 ± 0.60 104.8 68.7 ± 2.11( 0 . 2 ) 72.9 ± 1.58 89.6 37.9 ± 0.66 ( 0 . 9 ) 54.1 ± 0.23 243.9 Note: p denotes in-sample data size. The number in the parenthesis are the tuned parameters. SSC, LRR, LSR, and the k-means method cannot handle out-of-sampl e data. Thus, the results of these four m ethods are achie ved by directly performing them on the whole data set. SSSC, SLRR, and SL SR assign out-of-sampl e data to the nearest subspace which has m inimal residual ( i.e. , eq.(10)), whereas SSSC2, SLRR2, and SLSR2 get the results using eq.(9). The bold number indica te the best performance. • In m ost cases, LSC K outper forms LSC R with a little improvement, which verifies the claim [ 60 ] that the complex sam pling tech niques actually cannot pro duce a better result than the random sampling method. • [ 31 ] also in vestigated the A ccuracy o f LSC R, LSC K, Nystr ¨ om Orth, and KASP o n the Pen Digits data set. The h ighest Accuracy of th ese algorithm s are 79.0 %, 79.3%, 73.9% and 72. 5%, wh ich is close to the results achieved in our experimen ts ( i.e. , 77.7%, 79.9%, 67.3 % and 73.1%). G. Clustering on Lar ge Scale Data T ab le VI repor ts the perfor mance of our algor ithms on thr ee large scale d ata sets. For each d ata set, 1 000 samples are selected as in-samp le data, and the remaining samples are used as out-o f-sample data. W e assign ǫ = 0 . 2 to SSSC o n Covtyp e and Po kerHand-2 an d fix ǫ = 0 . 1 in th e c ase of PokerHand-1. W e have the follo wing observations: • SSSC, SLRR, and SLSR ou tperform the other approaches in all th e tests. For examp le, the A ccuracy of SSSC is at least 4.7% high er than the other tested methods on Covtype. On PokerHand -1 and Po kerHand-2, the gains are 3.7% and 2.1%, respectiv ely . • Th e NMI achieved by all the tested metho ds are close to 0. This shows that the metric NMI failed to distinct th e perfor mance of the ev aluated algorithms. • In [ 31 ], th e h ighest Acc uracy o n Covtype achieved by LSC R, LSC K, Nystr ¨ om Orth and KASP are 24.7 %, 25.5%, 22.3 % an d 22.4%, respectively . I n our exper i- ments, the Accu racy o f these four algorithm s are 22.0%, 22.0%, 23.3% a nd 23.9%, r espectiv ely . The possible reason may attribute to the subtle engineer ing details, e.g. , the in-sample and out-of- sample data partition s. JOURNAL OF L A T E X CL ASS FILES, VOL. 13, NO. 9, SEPTEMBER 2014 12 T ABLE V P E R F O R M A N C E C O M PA R I S O N A M O N G D I FF E R E N T A L G O R I T H M S O N T H R E E M E D I U M - S I Z E D DAT A S E T S , i.e. , M P I E , R C V , A N D P E N D I G I T S . Data sets MPIE ( p = 1000 ) PenDigit s ( p = 1000 ) RCV ( p = 2000 ) Algorith m Accu racy (%) NMI (%) Time Accurac y (%) NMI (%) Time Accu racy (%) NMI (%) T ime SSSC 57.6 ± 0.97( 10 − 6 ) 79.4 ± 0. 40 432.1 80.0 ± 1.31 ( 10 − 7 ) 71.3 ± 0. 11 17.0 19.6 ± 1.34( 10 − 7 ) 29.8 ± 0.58 840.6 SLRR 60.7 ± 0.62 ( 2 . 30 ) 78 .9 ± 0.34 340.4 74.8 ± 0.92( 0 . 30 ) 67.6 ± 0.00 10.4 49.1 ± 0.11 ( 3 . 10 ) 31.3 ± 0.26 499.6 SLSR 59.0 ± 0.58( 0 . 60 ) 79.5 ± 0.49 355.4 78.4 ± 0.81( 1 . 00 ) 69 .6 ± 0.01 8.9 11.2 ± 0.41( 0 . 60 ) 18.3 ± 1.22 95.2 KASP [ 30 ] 16.6 ± 0.53( 0 . 1 ) 57.0 ± 0. 28 1 479.8 73.1 ± 6.37( 4 ) 75.5 ± 3.39 12.5 19.0 ± 0.64( 0 . 1 ) 26.7 ± 0.33 198.8 Nystr ¨ om [ 29 ] 47.1 ± 1.46( 0 . 7 ) 77.2 ± . 0.88 15.3 66.7 ± 6.93( 0 . 4 ) 65.4 ± 2.70 35.9 15.9 ± 1.10( 0 . 4 ) 27.7 ± 0.37 27.1 Nystr ¨ om Orth 50.3 ± .2.38( 0 . 7 ) 78.1 ± 1.62 64.8 67.3 ± 5.66( 3 ) 64.8 ± 2.67 6.2 19.8 ± 0.53( 0 . 1 ) 23.7 ± 0.39 3401.3 LSC R [ 31 ] 18.1 ± 0.11( 2 ) 54.5 ± 0.25 62.1 77.7 ± 3.18( 15 ) 74.9 ± 2.61 5.6 15.4 ± 0.15( 2 ) 22.2 ± 0.15 8.9 LSC K [ 31 ] 17.5 ± 0.37( 3 ) 56.1 ± 0. 46 65.7 79.9 ± 2.73( 11 ) 76.4 ± 0.58 7. 9 22.0 ± 1.83( 2 ) 34.5 ± 0.43 17.7 SEC [ 33 ] 13.2 ± 0.39( 10 − 3 , 9 ) 44.1 ± 0.43 27.2 75.3 ± 4.20( 10 − 9 , 4 ) 70.3 ± 2.43 11.8 14.8 ± 0. 67( 10 − 6 , 3 ) 26.3 ± 0.52 19.9 AKK [ 45 ] 10.4 ± 0.19( 0 . 1 ) 38.7 ± 0. 66 24.6 69.0 ± 4.64( 0 . 01 ) 66.9 ± 1.63 6.2 18.3 ± 0.62( 0 . 2 ) 31 .6 ± 0.30 27.9 k-means [ 57 ] 14.5 ± 0.36(-) 53.2 ± 0.26 268.5 77.0 ± 0.13(-) 69.2 ± 0.02 23.7 19.3 ± 1.10(-) 23.8 ± 0.52 256.8 T ABLE VI P E R F O R M A N C E C O M PA R I S O N A M O N G D I FF E R E N T A L G O R I T H M S OV E R T H R E E L A R G E S C A L E D AT A S E T S , i .e. , C OV T Y P E ( n = 581 , 012 ) , P O K E R H A N D - 1 ( n = 971 , 329 ) , A N D P O K E R H A N D - 2 ( n = 1 , 000 , 000 ) . Data sets Covtype ( p = 1000 ) PokerHa nd-1 ( p = 1000 ) PokerHa nd-2 ( p = 1000 ) Algorith m Ac curac y (%) NMI (%) Time Accura cy (%) NMI (%) Time Accura cy (%) NMI (%) Time SSSC 28.6 ± 0.00 ( 10 − 5 ) 5.3 ± 0.00 325.5 51.6 ± 0.00 ( 10 − 7 ) 0.3 ± 0.00 267.7 17.6 ± 0.00 ( 10 − 5 ) 0.1 ± 0.10 474.1 SLRR 27.1 ± 0.03( 0 . 10 ) 3. 6 ± 0.02 240.9 37.8 ± 0.00( 0 . 10 ) 0.1 ± 0.00 166.9 16.0 ± 0.00 ( 0 . 10 ) 0.1 ± 0.00 317.7 SLSR 26.5 ± 0.00( 0 . 01 ) 7.2 ± 0.00 268.8 37.0 ± 0.00( 0 . 10 ) 0.0 ± 0.00 167.8 15.8 ± 0.01( 0 . 10 ) 0.1 ± 0.00 494.2 KASP [ 30 ] 23.9 ± 1.93( 3 ) 3.5 ± 0.19 1314.5 34.7 ± 0.93( 0 . 3 ) 0.0 ± 0.00 5497.1 11.3 ± 0.32( 3 ) 0.1 ± 0.04 7049.9 Nystr ¨ om [ 29 ] 24.0 ± 0.59( 0 . 1 ) 3.8 ± 0.03 40.6 47.9 ± 0.02( 0 . 2 ) 0.2 ± 0.01 61.4 12.9 ± 0.27( 0 . 2 ) 0.2 ± 0.04 205.7 Nystr ¨ om Orth 23.3 ± 0.67( 0 . 1 ) 3.8 ± 0.16 351.6 35.8 ± 0.33( 20 ) 0.1 ± 0.00 204.4 15.6 ± 2.89( 17 ) 0.1 ± 0.02 205.7 LSC R [ 31 ] 22.0 ± 0.47( 2 ) 3.8 ± 0.06 154.5 34.9 ± 0.01( 8 ) 0. 0 ± 0.00 1891.0 12.6 ± 0.17( 5 ) 0.0 ± 0. 04 1936.8 LSC K [ 31 ] 22.0 ± 0.52( 4 ) 3.6 ± 0.10 1155.4 32.4 ± 1.03( 2 ) 0.0 ± 0.00 8765.5 13.8 ± 0.51( 3 ) 0.1 ± 0.02 8829.0 SEC [ 33 ] 21.1 ± 0.01( 1 , 4 ) 3.6 ± 0.00 64.9 36.6 ± 0.00( 10 − 9 , 3 ) 0.1 ± 0.00 81.4 10.5 ± 0.06( 10 − 3 , 4 ) 0.1 ± .0.01 130.2 AKK [ 45 ] 22.8 ± 1.63( 1 ) 3.8 ± 0.08 344.2 35.9 ± 0.04( 0 . 1 ) 0.1 ± 0.00 1039.3 10.5 ± 0.06( 0 . 01 ) 0.0 ± 0.01 2882.5 k-means [ 57 ] 20.8 ± 0.00(-) 3.7 ± 0.00 4895.7 36.0 ± 0.01(-) 0.1 ± 0.00 4760.4 10.4 ± 0.06(-) 0. 0 ± 0.01 7188.8 • With the increase o f data size, our metho ds demon strate a good balan ce between the run ning time and the c lustering quality . Moreover, the used memory of our metho ds only de pends on in- sample data size, wh ich makes o ur methods are very competiti ve in large scale setting. In summ ary , we can co nclude that th e three new method s outperf orm the co mpeting alg orithms in all the tests. I n particular, SSSC is more advantageou s on large scale data sets ( e.g. , Covtyp e and Po kerHand), while SLRR outp erforms on h igh-dimen sional data c lustering p roblems ( e.g. , facial im- ages and docu mental corp us). SLSR can achieve comparable clustering performa nce with SSSC and SLRR , but h as higher computatio nal efficiency th an the latter . V . C O N C L U S I O N In th is paper, we p roposed a genera l f ramew ork to solve the large-scale and the out-o f-sample clustering prob lems for representatio n-based subspace clustering. Under ou r fram e- work, we furth er presente d thr ee scalable method s, i.e. , SSSC, SLRR, an d SLSR, which largely redu ce the comp utational complexity of the or iginal metho ds while pr eserving a goo d perfor mance. W e proved that the perfor mance of our metho d only dep ends on the latent structure of the da ta set and is indepen dent of the samp ling ra te. Moreover, we propo sed a novel m ethod to analyze th e erro r boun ds o f the nearest subspace classifier in terms of b inary ca se and applied it to SRC. Both theoretica l and exp erimental results show the effecti veness of our metho ds in large scale clustering. The work may b e extended or improved f rom the following aspects. First, the proposed framework is b ased on the assump- tion tha t out-o f-sample data can b e repre sented by in-sample data. Hen ce, the method may fail to h andle the out-of-samp le datum whe n it comes from a new subspa ces that does not emerge from in- sample da ta. It is worth to explo re how to overcome this problem in future. Second , the prop osed err or analysis method only consider s the bin ary ca se (i. e., k = 2 ). It is more p ractical b ut challeng ing to e xplore th e er ror analysis method w .r .t. k > 2 . A C K N O W L E D G M E N T The author s would like to thank th e an onymous revie wers for their valuable co mments a nd su ggestions to improve the quality of this pa per . T his work was sup ported b y National Nature Science Found ation of China un der grant No.61 43201 2 and No. 613222 03. R E F E R E N C E S [1] Z. Y u, W . L iu, W . Liu, X . Peng, Z. Hui, and B. V . Kumar , “Genera lized transiti ve dist ance with m inimum spanning random forest, ” in Proc . of 24th Int. Joi nt Conf. on Ar tif . Intell. , Buenos Aires, Argentina , Jul. 2015, pp. 2205–2211. [2] K. Muller , S . Mika, G. Ratsch, K. Tsuda, and B. Scholk opf, “ An introduc tion to kernel -based learning algorithms, ” IEEE T ra ns. Neural . Netw . , vol. 12, no. 2, pp. 181–201, 2001. JOURNAL OF L A T E X CL ASS FILES, VOL. 13, NO. 9, SEPTEMBER 2014 13 [3] R. V idal, “Subspace clustering , ” IEEE Signal P r oc. Mag. , vol. 28, no. 2, pp. 52–68, 2011. [4] Y . Ma, H. De rksen, W . Hong, and J. W right, “Segment ation of multi- v ariate mixed data via lossy data coding and compression, ” IEEE T rans. P attern Anal. Mach. Intell. , vol. 29, no. 9, pp. 1546–1562, 2007. [5] S. Rao, R. Tron , R. V idal, and Y . Ma, “Motion segment ation via robust subspace separat ion in the presence of outlyi ng, incomplete, or corrupted trajec tories, ” in Proc . of 21th IEE E Conf. Comput. V is. and P attern Recogn it. , A nchora ge, AL , Jun. 2008, pp. 1–8. [6] A. Y . Ng, M. I. Jordan, and Y . W eiss, “On spectral clustering: Analysis and an algorithm, ” in Proc. of 14th A dv . in Ne ural Inf. Pro cess. Syst. , V ancouver , Canada, Dec. 2001, pp. 849–856. [7] C. Hou, F . Nie, D. Y i, and D. T ao, “Discri minati v e embedded clusteri ng: A framewo rk for grouping high-dimension al data, ” IEEE T rans. Neural. Netw . Le arn. Syst. , vol. 26, no. 6, pp. 1287–1299, Jun. 2015. [8] E. Elhamif ar and R. V ida l, “Sparse subspace clusteri ng, ” in P r oc. of 22th IE EE Conf. Comput. V is. and P attern Recognit . , Miami, FL , Jun. 2009, pp. 2790–2797. [9] ——, “Sparse subspace clustering: Algorit hm, theory , and applic ations, ” IEEE T rans. P attern Anal. Mac h. Intell. , vol. 35, no. 11, pp. 2765–2781, 2013. [10] B. Cheng, J. Y ang, S. Y an, Y . Fu, and T . Huang, “Learning with ℓ 1 -graph for image analysis, ” IEEE T rans. on Image P r ocess. , vol. 19, no. 4, pp. 858–866, 2010. [11] D. Xu, Y . Huang, Z. Z eng, and X. Xu, “Human gait recognition using patch distributi on feature and locality-c onstrained group sparse represent ation, ” IEEE T rans. on Image Pro cess. , vol. 21, no. 1, pp. 316– 326, Jan. 2012. [12] L. Jing, M. Ng, and T . Zeng, “Dictionary learning-base d subspace structure identifica tion in spectral clusterin g, ” IEEE T rans. Neura l. Netw . Learn. Syst. , vol. 24, no. 8, pp. 1188–1199, Aug. 2013. [13] S. Gao, I. -H. Tsang, and L .-T . Chia, “Laplacian sparse co ding, hyper- graph la placia n sparse codi ng, and app licati ons, ” IEEE T rans. P attern Anal. Mach. Intell . , vol. 35, no. 1, pp. 92–104, Jan. 2013. [14] G. L iu, Z. L in, and Y . Y u, “Robust subspace segmentati on by low-ra nk represent ation, ” in P r oc. of 27th Int. Conf. Mach. Learn. , Haifa, Israel, Jun. 2010, pp. 663–670. [15] G. Liu, Z. Lin, S. Y an, J . Sun, Y . Y u, and Y . Ma, “Robust recov ery of subspace structures by lo w-rank represen tation, ” IEEE Tr ans. P atte rn Anal. Mach. Intell . , vol. 35, no. 1, pp. 171–184, 2013. [16] P . Fa v aro, R. V idal, and A. Ra vich andran, “ A closed form soluti on to robust subspace estimation and clustering, ” in Pr oc. of 24th IEEE Conf. Comput. V is. and P attern Recognit. , Colorado Springs, CO, Jun. 2011, pp. 1801–1807. [17] S. Xiao, M. T an, and D. Xu, “W eighted block-spa rse low rank represen- tatio n for face clustering in videos, ” in Proc . of 13th Eur . Conf. Comput. V is. , 2014, pp. 123–138. [18] G. C. Liu and S. C. Y an, “Latent low-ra nk representati on for subspace segment ation and feature extrac tion, ” in P r oc. of 13th IEEE Conf. Comput. V is. , Barcelona, Spain, Jun. 2011, pp. 1615–1622. [19] C.-Y . Lu, H. Min, Z.-Q. Zhao, L. Zhu, D.-S. Huang, and S. Y an, “Robust and ef ficient subspace segmentatio n via least squares regression , ” in Pr oc. of 12th Eur . Conf . Comput . V is. , Florence , Italy , Oct. 2012, pp. 347–360. [20] X. Peng, Z. Y i, and H. T ang, “Robust s ubspace clusterin g via threshold- ing ridge regression, ” in Proc . of 29th AAA I Conf . Artif. Intell . , Austin, TX, Jan. 2015, pp. 3827–3833. [21] R. Liu, Z. Lin, F . D. la T orre, and Z. Su, “Fixed-ra nk representa tion for unsupervise d visual learni ng, ” in Proc. of 25th IEEE Conf. Comput. V is. and P attern Recognit . , Providenc e, RI, Jun. 2012, pp. 598–605. [22] X. Peng, L . Z hang, and Z. Y i, “Scalable sparse subspace clustering , ” in Pr oc. of 26th IEEE Conf. Comput. V is. and P attern Recognit . , Portland, OR, Jun. 2013, pp. 430–437. [23] J. Wright, A. Y . Y ang, A . Ganesh, S. S. Sastry , and Y . Ma, “Robust face recogni tion via sparse represen tation , ” IEEE T ra ns. P attern Anal. Mach. Intell . , vol. 31, no. 2, pp. 210–227, 2009. [24] A. Y ang, A. Ganesh, S. Sastry , and Y . Ma, “Fast l1-minimizati on algo- rithms and an applic ation in robust face recognition: A re vie w , ” EECS Departmen t, Univ ersit y of California, Berke ley , T ech. Rep. UCB/EECS- 2010-13, Feb . 2010. [25] S. Xiao, W . Li, D. Xu, and D. T ao, “FaLRR: A fast low rank represent ation s olv er , ” in P r oc. of 28th IEEE Conf. Comput. V is. and P attern Recognit . , Boston, MA, Jun. 2015, pp. 4612–4620. [26] G. Liu and S . Y an, “ Acti ve subspace: T o w ard scalabl e lo w-rank le arn- ing, ” Neural Comput. , vol. 24, no. 12, pp. 3371–3394, 2012. [27] X. Zhang, F . Sun, G. Liu, and Y . Ma, “Fast low-ra nk subspace segmen- tatio n, ” IE EE T ra ns. Knowl. Data Eng. , vol. 26, no. 5, pp. 1293–1297, May 2014. [28] C. Fo wlk es, S. Belongie , F . Chung, and J. Malik, “Spec tral grouping using the nystrom method, ” IEE E T r ans. P atte rn A nal. Mach . Intell . , vol. 26, no. 2, pp. 214–225, 2004. [29] W .-Y . Chen, Y . Song, H. Bai, C.-J. Lin, and E. Y . Chang, “Para llel spectra l clusteri ng in distrib uted systems, ” IEEE T rans. P attern Anal. Mach . Intell. , vol. 33, no. 3, pp. 568–586, 2011. [30] D. Y an, L. Huang, and M. I. Jordan, “Fast approxi mate spectral clusteri ng, ” i n Proc . of 15th ACM SIGKDD Int. Conf. Knowl. Dis. and Data Min. , Paris, France, Jun. 2009, pp. 907–916. [31] X. Chen and D. Cai, “Lar ge scale spectral clustering with landmark- based representati on, ” in Proc. of 25th AAA I Conf . Artif. Intell. , San Francisco , CA, Aug. 2011, pp. 313–318. [32] L. W ang, C. Leckie, R. Kotagi ri, and J. Bezdek, “ Approximate pairwise clusteri ng for large data sets via sampling plus extensi on, ” P attern Recogn . , vol. 44, no. 2, pp. 222–235, 2011. [33] F . Nie, Z . Zeng, T . I. W ., D. Xu, and C. Z hang, “Spectral embedded clusteri ng: A framew ork for in-sample and out-of-sample spectra l clus- tering, ” IEE E T rans. Neural. Netw . , vol. 22, no. 11, pp. 1796–1808, 2011. [34] M.-A. Belabba s and P . J. W olfe, “Spectral methods in machine learnin g and ne w strate gies for very l arge dat asets, ” Pr oc. of Natl. A cad. Sci . , vol. 106, no. 2, pp. 369–374, 2009. [35] K. T asdemir , “V ector quantizati on based approximat e spectral clustering of large datasets, ” P attern Recogn. , vol. 45, no. 8, pp. 3034–3044, 2012. [36] N. Halko, P . Martinsson, and J. Tropp , “Finding s tructu re with ran- domness: Probabilisti c algorith ms for constructing a pproximate matr ix decomposit ions, ” SI AM Revie w , vol. 53, no. 2, pp. 217–288, 2011. [37] L. Zhang, M. Y ang, and X. Feng, “Sparse representati on or collaborati ve represent ation: Which helps face recogniti on?” in Proc . of IEEE Int. Conf . on Comput. V is. , Barcelona, Spain, Nov . 2011, pp. 471–478. [38] I. Naseem, R. T ogneri, and M. Bennamoun, “Linear regression for face recogni tion, ” IEEE T rans. P attern A nal. Mach . Intell. , v ol. 32, no. 11 , pp. 2106–2112, Nov . 2010. [39] M. Smith, N. Mili c-Fraylin g, B. Shneiderman, E. Mendes Rodrigues, J. L esko ve c, and C. Dunne, “Nodex l: a free and open network overvie w , disco very and explorati on add-in for exce l 2007/2010 , ” Social Media Resear ch F oundation , 2010. [40] U. V . Luxbur g, O. Bousquet, and M. Belkin, “Limits of spectral clusteri ng, ” in Proc . of 17th Adv . in Neur al Inf. Pr ocess. Syst . , Hyatt Rege ncy , Canada, Dec. 2004, pp. 857–864. [41] S. Gao, I. W .-H. Tsang, and L .-T . Chia, “Sparse representatio n with kerne ls, ” IEEE T rans. on Image Proce ss. , vol. 22, no. 2, pp. 423–434, 2013. [42] Z. W ang , J. Y ang, N. Nasrabadi, and T . Huang, “ A max-margin per - specti ve on sparse representa tion-ba sed classificat ion, ” in Pr oc. of IEEE Conf . Comput. V is. , Sydne y , Australia , Dec. 2013, pp. 1217–1224. [43] J. H amm and D . D. Lee, “Grassmann discrimina nt analysis: a unifying vie w on subspace-based learnin g, ” in Proc . of 25th Int. Conf. Mach. Learn. , Helsinki, Finland, Jul. 2008, pp. 376–383. [44] K. Fukunaga, Introd uction to Statistica l P attern Recogn. (2nd Ed.) . San Dieg o, CA: Academic Press Professional , Inc., 1990. [45] R. Chitta, R. Jin, T . Havens, and A. Jain, “ Approximate kernel k-means: solution to large scale kernel clustering, ” in P r oc. of 17th ACM SIGKDD Int. Conf. Knowl. Dis. and D ata Min. , San Diego, CA, Aug. 2011, pp. 895–903. [46] A. S. Georg hiades, P . N. Bel humeur , and D. J . Kriegman, “Fro m fe w to many: Illuminatio n cone models for face recogniti on under varia ble lighti ng and pose, ” IEE E T rans. P attern Anal. Mach. Intell. , vol. 23, no. 6, pp. 643–660, 2001. [47] M. R. Osborne, B. Presnell, and B. A. Turlac h, “ A ne w approach to v ariable select ion in least squares problems, ” IMA Jou rnal of Numerical Analysis , vol. 20, no. 3, pp. 389–403, 2000. [48] A. Martinez, “The AR face database, ” CVC T ech nical Report , vol. 24, 1998. [49] G. B. Huang, M. Ramesh, T . Berg, and E. L earned -Miller , “Labeled fac es in the wild: A database for stu dying fac e recogn ition in uncon- strained en vironment s, ” Uni versi ty of Massachusetts, Amherst, T ech. Rep. 07–49, Oct. 2007. [50] R. Gross, I. Matthe ws, J. Cohn, T . Kanade, and S. Baker , “Multi-PIE, ” Imag e V ision Comput. , vol. 28, no. 5, pp. 807–813, 2010. [51] M. Y ang, L. Z hang, D. Zhang, and S. W ang, “Rela xed collabora ti ve represent ation for patte rn classification, ” in Proc . of 25th IEEE Conf . Comput. V is. and P att ern R eco gnit. , Providen ce, RI, Jun. 2012, pp. 2224–2231. JOURNAL OF L A T E X CL ASS FILES, VOL. 13, NO. 9, SEPTEMBER 2014 14 [52] D. Cai, X. F . He, and J. W . Han, “ Document clustering usi ng locality preservin g indexing , ” IEEE Tr ans. Knowl. Data En. , vol. 17, no. 12, pp. 1624–1637, 2005. [53] F . Alimoglu and E. Alpaydin, “Combining multiple represent ations and classifier s for pen-based handwritten digit recognition, ” i n P r oc. of 4th Int. Conf . Doc. Anal. and Recogni t. , ULM, Germany , Aug. 1997, pp. 637–640. [54] J. Blac kard and D. Dea n, “Compa rati v e accura cies of artifici al neural netw orks and discriminant analysi s in predicti ng forest cover types from cartogr aphic variab les, ” Comput. Electr on. A gric. , vol. 24, no. 3, pp. 131–151, 1999. [55] Y . T aigman, L . W olf, and T . Hassner , “Multiple one-shots for utiliz ing class label information. ” in Proc . of 20th Brit. Mach. V is. Conf . , London, England, Sep. 2009, pp. 1–12. [56] M. Filippone, F . Camastra, F . Masulli, and S. Rov etta , “ A surve y of kerne l and spectral methods for cluste ring, ” P attern Recogn . , vol. 41, no. 1, pp. 176–190, 2008. [57] D. Cai, “Litekmean s: the faste st matlab implementatio n of kmeans, ” A vai lable at: http:// www .zjucadcg.cn/ dengcai/ Data/ Clustering.html , 2011. [58] Y . Zhao and G. Karypis, “Empirical and theoreti cal comparisons of select ed criterio n functions for document clustering, ” Mach. Learn. , vol. 55, no. 3, pp. 311–331, 2004. [59] S. Negahba n and M. J. W ai nwright, “Estimation of (near) low-ran k matrice s wi th noise and high-dimensiona l scali ng, ” Ann. Stat. , vol. 39, no. 2, pp. 1069–1097, 2011. [60] T . O. Kvalse th, “Entropy and correla tion: Some comments, ” IEE E T rans. Syst. Man Cybern. , vol. 17, no. 3, pp. 517–519, 1987. Xi Peng is a research scientist at Institute for Info- comm., Research Agenc y for Scienc e, T echnology and Research (A*ST AR) Singap ore. He recei v ed the BEng degre e in Electroni c Engineering and MEng degree in Computer S cienc e from Chongqin g Uni versi ty of Posts and T elec ommunicati ons, and the Ph.D. degre e from Sichuan Uni versit y , China, respect i vely . His current research interests include computer vision, image processing, and pattern recogni tion. Dr . Peng is the recipie nt of China National Grad- uate Scholarship in 2013, CSC-IBM Scholarship for Outstandin g Chinese Students in 2012, and E xcell ent Student Paper of IE EE CHENGDU Section in 2010. He has served as a PC member for 10 internationa l conferenc es such as IJCNN 20 14-2016 and a revie wer for ove r 10 internati onal jo urnals such as IEEE TNNLS, TIP , T KDE, TIFS, T GRS, TCYB. Huajin T ang (M’01) recei ved the B.Eng. degree from Zhejiang Univ ersity , Hangzhou, China, in 1998, the M. Eng. degree from Shanghai Jiao T ong Uni versi ty , Shanghai, China, in 2001, and the Ph.D. degre e in electr ical a nd computer engineering from the National Univ ersity of Singapore, Singapore, in 2005. He was a System E nginee r with STMicro- elect ronics, Singapore , from 2004 to 2006, and then a Post- Doctoral Fello w with the Queensla nd Brain Institut e, Uni versi ty of Queensland , Brisbane, QLD, Australia , from 2006 to 2008. He is currently a Researc h Scientist leadin g the Cogniti v e Computing Group with the Institute for Infocomm Research, Agency for Science, T ec hnology and Research, Singapore . He has authored one monograph (Springer-V erlag, 2007) and ov er 30 internati onal journal papers. His current research interests include neural computation , neuromorph ic cogni ti ve systems, ne urocognit i ve robots, and machine learni ng. Dr . T ang s erve s as an Associate Editor of the IEEE TRANSACTIONS ON NEURAL NETW ORKS AND LE ARNING SYSTEMS an d an Editori al Board Member of Frontiers in Robotics and AI. Lei Zhang (M’10) recei v ed the B.S. and Masters degre es in m athemat ics and the Ph.D. degree in computer science from the Unive rsity of Electroni c Science and T echnol ogy of China, Chengdu, China, in 2002, 2005, and 2008, respecti vely . She was a Post-Doctora l Researc h Fello w in the Departmen t of Computer Scienc e and Engineering, Chinese Univ er- sity of Hong Kong, Shatin, Hong Kong, from 2008 to 2009. Currently , she is a Professor at Sichuan Uni versi ty , Chengdu. H er current research inte rests include theory and applicati ons of neura l netw orks based on neocorte x computing and big data analysis methods by infinity deep neural netw orks. Zhang Yi (SM’10) recei v ed the Ph.D. degree in mathemati cs from the Institute of Mathematics, T he Chinese Academy of Science, Beijin g, China, in 1994. Currently , he is a Professor at the Colle ge of Computer Science, Sichuan Uni versi ty , Chengdu, China. He is the co-author of three books: Con- ver gence Analysis of Recurren t Neural Networks (Kluwer Academic Publisher , 2004), Neural Net- works: Computation al Models and Applications (Springer , 200 7), and Subspace L earning of Neural Networ ks (CRC Press, 2010). He is the Chair of IEEE Chengdu Section (2015 ). He was an Associate Editor of IEEE Tra nsaction s on Neural Networks and Learning Systems (2009 2012), and an Associate E ditor of IE EE Tra nsaction s on Cybernetics (2014 ). His current research interests include Neural Networks and Big Data. He is the founding direct or of Machine Intelligenc e Laborato ry . H e is also the founder of IEEE Computati onal Intelli gence Society , Chengdu Chapter . Shijie Xiao recei ved the B.E. degree from the Harbin Institute of T echn ology , Harbin, China, in 2011. He is currentl y pursuing the Ph.D. degree with the School of Computer Engineering, Nanyang T echnologica l Univ ersity , Singapore. His current research interests inc lude machine learni ng and computer vision.
Original Paper
Loading high-quality paper...
Comments & Academic Discussion
Loading comments...
Leave a Comment