Post-transcriptional regulation across human tissues
Transcriptional and post-transcriptional regulation shape tissue-type-specific proteomes, but their relative contributions remain contested. Estimates of the factors determining protein levels in human tissues do not distinguish between (i) the facto…
Authors: Alex, er Franks, Edoardo Airoldi
Post-transcriptional re gulation across human tissues Alexander Franks 1 , 2 , Edoardo Airoldi 3 , 4 , Nikolai Sla v o v 5 , 6 , 1 Department of Statistics, Uni versity of W ashington, Seattle, W A 98195, USA 2 Current address: Department of Statistics, Uni versity of California, Santa Barbara, Santa Barbara, CA 3 Department of Statistics, Harv ard Uni versity , Cambridge, MA 02138, USA 4 Broad Institute of MIT and Harv ard Uni versity , Cambridge, MA 02142, USA 5 Department of Bioengineering, Northeastern Uni versity , Boston, MA 02115, USA 6 Department of Biology , Northeastern Uni versity , Boston, MA 02115, USA Correspondence: nsla v ov@alum.mit.edu Abstract T ranscriptional and post-transcriptional regulation shape tissue-type-specific proteomes, but their relati ve contributions remain contested. Estimates of the factors determining protein lev els in hu- man tissues do not distinguish between ( i ) the factors determining the v ariability between the ab un- dances of different proteins, i.e., mean-le vel-v ariability and, ( ii ) the factors determining the physi- ological variability of the same protein across different tissue types, i.e., across-tissues v ariability . W e sought to estimate the contrib ution of transcript le v els to these tw o orthogonal sources of v ari- ability , and found that scaled mRN A lev els can account for most of the mean-le vel-v ariability but not necessarily for across-tissues v ariability . The reliable quantification of the latter estimate is limited by substantial measurement noise. Ho we ver , protein-to-mRN A ratios exhibit substantial across-tissues variability that is functionally concerted and reproducible across different datasets, suggesting extensi ve post-transcriptional regulation. These results caution against estimating pro- tein fold-changes from mRN A fold-changes between dif ferent cell-types, and highlight the contri- bution of post-transcriptional re gulation to shaping tissue-type-specific proteomes. 1 2 A uthor Summary The identity of human tissues depends on their protein lev els. Are tissue protein le vels set largely by corresponding mRNA le v els or by other (post-transcriptional) regulatory mechanisms? W e re visit this question based on statistical analysis of mRN A and protein le vels measured across human tissues. W e find that for any one gene, its protein lev els across tissues are poorly predicted by its mRN A levels, suggesting tissue-specific post-transcriptional regulation. In contrast, the ov erall protein lev els are well predicted by scaled mRN A lev els. W e show ho w these speciously contradictory findings are consistent with each other and represent the two sides of Simpson’ s paradox. Intr oduction The relati ve ease of measuring mRNA lev els has facilitated numerous in v estigations of ho w cells regulate their gene expression across different pathological and physiological conditions [ 1 – 6 ]. Ho we ver , often the rele v ant biological processes depend on protein le v els, and mRN A levels are merely proxies for protein le vels [ 7 ]. If a gene is regulated mostly transcriptionally , its mRNA le v el is a good proxy for its protein le vel. Con v ersely , post-transcriptional regulation can set protein le vels independently from mRN A lev els, as in the cases of classical re gulators of development [ 8 ], cell di vision [ 9 , 10 ] and metabolism [ 11 , 12 ]. Thus understanding the relativ e contrib utions of transcriptional and post-transcriptional regulation is essential for understanding their trade-offs and the principles of biological regulation, as well as for assessing the feasibility of using mRN A le vels as proxies for protein le v els. Pre vious studies hav e considered single cell-types and conditions in studying v ariation in ab- solute mRNA and protein le vels genome-wide, often employing unicellular model or ganisms or mammalian cell cultures [ 13 – 19 ]. Ho we ver , analyzing per-gene variation in relati ve mRN A and protein expression across different tissue types in a multicellular organism presents a potentially dif ferent and critical problem which cannot be properly addressed by examining only genome- scale correlations between mRN A and protein le v els. [ 20 – 22 ] ha ve measured protein le v els across human tissues, thus pro viding v aluable datasets for analyzing the re gulatory layers shaping tissue- 3 type-specific proteomes. The absolute le vels of proteins and mRN As in these datasets correlate well, highlighting that highly abundant proteins hav e highly abundant mRN As. Such correlations between the absolute lev els of mRNA and protein mix/conflate many sources of variation, includ- ing v ariability between the le vels of different proteins, variability within the same protein across dif ferent conditions and cell-types, and the v ariability due to measurement error and technological bias. Ho we ver , these dif ferent sources of v ariability ha ve very different biological interpretations and implications. A major source of variability in protein and mRNA data arises from differences between the le v els of mRN As and proteins corresponding to dif ferent genes. That is, the mean le vels (av eraged across tissue-types) of different proteins and mRN As vary widely . W e refer to this source of variability as mean-level variability . This mean-le v el v ariability reflects the fact that some proteins, such as ribosomal proteins, are highly abundant across all profiled tissues while other proteins, such as cell cycle and signaling regulators, are orders of magnitude less abundant across all profiled conditions [ 20 ]. Another principal source of v ariability in protein le vels, intuiti v ely orthogonal to the mean-lev el v ariability , is the variability within a protein across dif ferent cell-types or physiological conditions and we refer to it as acr oss-tissues variability . The across-tissues variability is usually much smaller in magnitude, but may be the most relev ant source of variability for understanding different phenotypes across cells-types and physiological conditions. Here, we sought to separately quantify the contributions of transcriptional and post-transcriptional regulation to the mean-lev el variability and to the across-tissues variability across human tissues. Our results show that the much of the mean-lev el protein v ariability can be explained well by mRN A le vels while across-tissues protein v ariability is poorly explained by mRNA lev els; much of the unexplained variance is due to measurement noise but some of it is reproducible across datasets and thus likely reflects post-transcriptional regulation. These results add to pre vious results in the literature [ 13 – 18 , 20 , 22 ] and suggest that the post-transcriptional regulation is a significant con- tributor to shaping tissue-type specific proteomes in human. 4 Results The correlation between absolute mRNA and pr otein lev els conflates distinct sour ces of variability W e start by outlining the statistical concepts underpinning the common correlational analysis and depiction [ 13 , 15 , 17 , 20 ] of estimated absolute protein and mRNA le vels as displayed in Fig 1 a,b . The correlation between the absolute mRN A and protein lev els of different genes and across differ - ent tissue-types has been used to estimate the lev el at which the protein le vels are regulated [ 20 , 22 ]. One measure reflecting the post-transcriptional regulation of a gene is its protein to mRN A ratio, which is sometimes referred to as a gene’ s “translational efficienc y”. Since this ratio also reflects other layers of regulation, such as protein de gradation and noise [ 18 ], we will refer to it de- scripti vely as pr otein-to-mRN A (PTR) ratio. If the across-tissues v ariability of a gene is dominated by transcriptional regulation, its PTR in dif ferent tissue-types will be a gene-specific constant. Based on this idea, [ 20 , 22 ] estimated these protein-to-mRNA ratios and suggested that the me- dian PTR for each gene can be used to scale its tissue-specific mRN A le vels and that this “scaled mRN A ” predicts accurately tissue-specific protein le vels. Indeed, mRN A lev els scaled by the corresponding median PTR explain large fraction of the total protein v ariance ( R 2 T = 0 . 70 , across all measured proteins, Fig 1 a,b) as previously observed [ 15 , 20 , 22 ]. Ho we ver , this high R 2 T does not indicate concordance for across-tissues variability of mRN As and proteins. R 2 T quantifies the fraction of the total protein variance e xplained by mRNA le vels between genes and across tissue-types; thus, it conflates the mean-le vel variability with the across-tissues v ariability . This conflation is shown schematically in Fig 1 c for a subset of 100 genes measured across 12 tissues. The across-tissues variability is captured by the variability within the regression fits while the mean-lev el variability is captured by the variability between the regression fits. Such aggregation of distinct sources of v ariability , where different subgroups of the data sho w dif ferent trends, may lead to counter-intuiti ve results and incorrect conclusions, and is kno wn as the Simpson’ s or amalgamation paradox [ 23 ]. T o illustrate the Simpson’ s paradox in this context, we depicted a subset of genes for which the measured mRNA and protein le vels are unrelated across- tissues while the mean-le v el variability still spans the full dynamic range of the data, Fig 1 c. For 5 this subset of genes, the overall (conflated/amalgamated) correlation is large and positi ve, despite the fact that all across-tissues (within-gene) trends are close to zero. This counter-intuiti v e result is possible because the conflated correlation is dominated by the v ariability with larger dynami- cal range, in this case the mean-le vel v ariability . This conceptual example using data from [ 20 ] demonstrates that R 2 T is not necessarily informati ve about the across-tissues variability , i.e., the protein variance explained by scaled mRN A within a gene ( R 2 P ). Thus the conflated correlation is not generally informativ e about the lev el — transcriptional or post-transcriptional — at which across-tissues variability is regulated. This point is also illustrated in Fig S1 with data for all quantified genes: The correlations between scaled mRN A and measured protein le vels are not in- formati ve for the correlations between the corresponding relati ve changes in protein and mRN A le vels. T o further illustrate this point with more datasets, Fig 1 d displays the cumulativ e distributions of across-tissues mRN A-protein correlations (R P ) for all proteins quantified across the large shot- gun datasets [ 20 , 21 ], as well as the corresponding conflated correlations between scaled mRN A and protein le vels (R T ). This depiction demonstrates that R T are not representati ve for R P . T o extended this analysis to protein le v els measured by targeted MS [ 22 ], we plotted the distrib utions of across-tissues mRN A-protein correlations (R P ) for the subset of 33 genes quantified across all datasets [ 20 – 22 ]; see dotted curves in Fig 1 d. These genes were selected to hav e lar ger v ariance across tissues [ 22 ] and hav e relati vely higher across-tissues correlations, especially in the data by [ 21 , 22 ]. Nev ertheless, all datasets include low and ev en neg ati ve across-tissues correlations (R P ) and very high conflated correlations between scaled mRN A and protein lev els (R T ), Fig 1 d. These results underscore the weak connection between R P and R T e ven for a carefully selected and measured subset of mRN As and proteins. The across-tissues v ariability has a dynamic range of about 2 − 10 fold and is thus dw arfed by the 10 3 − 10 4 fold dynamic range of abundances across different proteins. While across-tissues v ariability is smaller than mean-le vel v ariability , it is exactly the across-tissues variability that contributes to the biological identity of each tissue type and we focus the rest of our analysis to factors re gulating the across-tissues protein v ariability . 6 Estimates of transcriptional and post-transcriptional regulation acr oss-tissues depend str ongly on data reliability Next, we sought to estimate the fractions of across-tissues protein v ariability due to transcriptional regulation and to post-transcriptional re gulation. This estimate depends crucially on noise in the mRN A and protein data, from sample collection to measurement error . Both RN A-seq [ 24 , 25 ] and mass-spectrometry [ 15 , 26 ] hav e relativ ely large and systematic error in estimating absolute le vels of mRN As and proteins, i.e., the ratios between dif ferent proteins/mRN As. These errors originate from DN A sequencing GC-biases, and v ariations in protein digestion and peptide ioniza- tion. Ho we ver , relati v e quantification of the same gene across tissue-types by both methods can be much more accurate since systematic biases are minimized when taking ratios between the inten- sities/counts of the same peptide/DN A-sequence measured in different tissue types [ 18 , 25 , 27 , 28 ]. It is this relati ve quantification that is used in estimating across-tissues variability , and we start by estimating the reliability of the relati ve quantification across human tissues, Fig 2 a-d. Reliabil- ity is defined as the fraction of the observ ed/empirical v ariance due to signal. Thus reliability is proportional to the signal strength and decreases with the noise le vels. T o estimate the within study reliability of mRN A lev els, we took advantage that each mRNA dataset contains data from multiple subjects. W e split the subjects in each dataset into two sub- sets, each of which containing measurements for all 12 tissues from sev eral subjects. The le v els of each mRN A were estimated from each subset by av eraging across subjects and the estimates from the two subsets correlated, Fig 2 a. These correlations provide estimates for the reliability of each mRN A and their median provides a global estimate for the reliability of relati ve RN A measurement, not taking into account noise due to sample collection and processing. T o estimate the within study reliability of protein lev els, we computed separate estimates of the relati ve protein le vels within a dataset. For each protein, Estimate 1 was deri ved from 50 % of the quantified peptides and Estimate 2 from the other 50 %. Since much of the analytical noise related to protein digestion, chromatographic mobility and peptide ionization is peptide-specific, such non-ov erlapping sets of of peptides provide mostly , albeit not completely , independent estimates for the relativ e protein lev els. The correlations between the estimates for each protein (av eraging across 12 tissues) are displayed as a distribution in Fig 2 b . 7 In addition to the within study measurement error , protein and mRN A estimates can be affected by study-dependable v ariables such as sample collection and data processing. T o account for these factors, we estimated acr oss study reliability by comparing estimates for relati v e protein and mRN A lev els deriv ed from independent studies, Fig 2 c-d. For each gene, we estimate the reliability for each protein by computing the the empirical correlation between mRN A ab undance reported by the ENCODE [ 29 ] and by [ 30 ]. The correlations in Fig 2 c have much broader distrib ution than the within-study correlations, indicating that much of the noise in mRNA estimates is study- dependent. T o estimate the acr oss study reliability of protein lev els, we compared the protein lev els es- timated from data published by [ 20 ] and [ 21 ]. T o quantify protein abundances, [ 20 ] used iB A Q scores and [ 21 ] used spectral counts. T o ensure uniform processing of the two datasets, we do wn- loaded the raw data and analyzed them with maxquant using identical settings, and estimated protein abundances in each dataset using iBA Q; see Methods. The corresponding estimates for each protein were correlated to estimate their reliability . Ag ain, the correlations depicted in Fig 2 d hav e a much broader distrib ution compared to the within-study protein correlations in Fig 2 b, indicating that, as with mRN A, the vast majority of the noise is study-dependent. As a representa- ti ve estimate of the reliability of protein le vels, we use the median of the across tissue correlations from Figures 2 c-d. The across tissues correlations and the reliability of the measurements can be used to esti- mate the across tissues variability in protein le vels that can be explained by mRN A levels (i.e., transcriptional re gulation) as sho wn in Fig 2 e; see Methods. As the reliabilities of the protein and the mRN A estimates decrease, the noise sensiti vity of the estimated transcriptional contri- bution increases. Although the av erage across-tissues mRN A protein correlation was only 0 . 29 ( R 2 = 0 . 08 ), the data are consistent with approximately 50% of the v ariance being explained by transcriptional regulation and approximately 50% coming from post-transcriptional regulation; see Fig S2 for reliability-corrected estimates for specific functional gene sets. Ho we ver , the low relia- bility of the data and lar ge sampling variability precludes making such estimate reliable. Thus, we next considered analyses that can pro vide estimates for the scope of post-transcriptional re gulation e ven when the reliability of the data is lo w . 8 Coordinated post-transcriptional r egulation of functional gene sets The low reliability of estimates across datasets limits the reliability of estimates of transcriptional and post-transcriptional regulation for individual proteins, Fig 2 . Thus, we focused on estimating the post-transcriptional regulation for sets of functionally related genes as defined by the gene ontology (GO) [ 31 ]. By considering such gene sets, we may be able to average out some of the measurement noise and see regulatory trends shared by functionally related genes. Indeed, some of the noise contributing to the across-tissues variability of a gene is likely independent from the function of the gene; see Methods. Con versely , genes with similar functions are likely to be regulated similarly and thus ha ve similar tissue-type-specific PTR ratios. Thus, we explored whether the across-tissues variability of the PTR ratios of functionally related genes reflects such tissue-type-specific and biological-function-specific post-transcriptional regulation. Since this analysis aims to quantify across-tissues v ariability , we define the “relativ e protein to mRN A ratio” (rPTR) of a gene in a giv en tissue to be the PTR ratio in that tissue divided by the median PTR ratio of the gene across the other 11 tissues. W e ev aluated the significance of rPTR v ariability for a gene-set in each tissue-type by comparing the corresponding gene-set rPTR distribution to the rPTR distribution for those same genes pooled across the other tissues ( Fig 3 ); we use the KS-test to quantify the statistical significance of differences in the rPTR distributions; see Methods. The results indicate that the genes from many GO terms hav e substantially higher rPTR in some tissues than in others. For example the ribosomal proteins of the small sub unit (40S) hav e high rPTR in kidne y but lo w rPTR in stomach ( Fig 3 a-c). While the strong functional enrichment of rPTR suggests functionally concerted post-transcriptional regulation, it can also reflect systematic dataset-specific measurement artifacts. T o in v estigate this possibility , we obtained two estimates for rPTR from independent datasets: Estimate 1 is based on data from [ 20 ] and [ 30 ], and Estimate 2 is based on data from [ 21 ] and [ 29 ]. These two estimates are reproducible (e.g., ρ = 0 . 7 − 0 . 8 ) for most tissues b ut less for others (e.g., ρ = 0 . 14 ), as sho wn by the scatter plots between the median rPTR for GO terms in Fig 3 d; Fig S3 shows the reproducibility for all tissues. The correlations between the two rPTR estimates remain statisti- cally significant albeit weak er (i.e., ρ = 0 . 1 − 0 . 4 ) when computed with all GO terms (not only those showing significant enrichment) as sho wn in T able S1 , as well as when computed between the rPTRs for all genes, T able S2 . 9 Consensus pr otein lev els Gi ven the low reliability of protein estimates across studies Fig 2 , we sought to increase it by deri ving consensus estimates. Indeed, by appropriately combining data from both protein studies, we can a v erage out some of the noise thus improving the reliability of the consensus estimates; see Methods. As e xpected for protein estimates with increased reliability , the consensus protein le v els correlate better to mRN A lev els than the corresponding protein lev els estimated from a either dataset alone, Fig 4 a,b . W e further v alidate our consensus estimates against 124 protein/tissue measurements from a tar geted MS study by [ 22 ]. W e computed the mean squared errors (MSE) between the protein le v els estimated from the targeted study and the other three datasets using only protein/tissue measurements quantified in all datasets, facilitating f air comparison ( Fig 4 c). The MSE are lower for the consensus dataset than for either [ 20 ] or [ 21 ] and are consistent with a 10% error reduction relativ e to the [ 21 ] dataset. In addition to increased reliability , the consensus dataset increased co verage, providing a more comprehensi ve quantification of protein le vels across human tissues than either draft of the human proteome taken alone (T able 1). Discussion Highly abundant proteins have highly abundant mRN As. This dependence is consistently observed [ 13 – 15 , 17 , 18 ] and dominates the explained variance in the estimates of absolute protein lev els ( Fig 1 and Fig S1). This underscores the role of transcription for setting the full dynamic range of protein le vels. In stark contrast, differences in the proteomes of distinct human tissues are poorly explained by transcriptional regulation, Fig 1 . This is due to measurement noise ( Fig 2 ) but also to post-transcriptional regulation. Indeed, large and partially reproducible rPTR ratios suggest that the mechanisms shaping tissue-specific proteomes in volv e post-transcriptional regulation, Fig 3 . This result underscores the role of translational regulation and of protein degradation for mediating physiological functions within the range of protein le vels consistent with life. As with all analysis of empirical data, the results depend on the quality of the data and the estimates of their reliability . This dependence on data quality is particularly strong given that some conclusions rest on the failure of across-tissues mRN A v ariability to predict across-tissues protein variability . Such inference based on unaccounted for variability is substantially weaker than 10 measuring directly and accounting for all sources of v ariability . The lo w across study reliability suggest that the signal is strongly contaminated by noise, especially systematic biases in sample collection and handling, and thus the data cannot accurately quantify the contributions of dif ferent regulatory mechanisms, Fig 2 . Another limitation of the data is that isoforms of mRN As and proteins are merged together , i.e., using razor proteins. This latter limitation is common to all approaches quantifying proteins and mRN As from peptides/short-sequence reads. It stems from the limitation of existing approaches to infer and distinctly quantify isoforms and proteoforms. The strong enrichment of rPTR ratios within gene sets ( Fig 3 ) demonstrates a functionally concerted regulation at the post-transcriptional lev el. Some of the rPTR trends can account for fundamental physiological differences between tissue types. For example, the kidney is the most metabolically activ e (energy consuming) tissue among the 12 profiled tissues [ 32 ] and it has very high rPTR for many gene sets in volv ed in ener gy production ( Fig 3 a). In this case, post- transcriptional regulation likely plays a functional role in meeting the high ener gy demands of kidneys. Quantifying and understanding mRNA and protein co v ariation in single cells is an im- portant frontier of this analysis [ 33 ]. The rPTR patterns and the across tissue correlations in Fig S1 indicate that the relati ve con- tributions of transcriptional and post-transcriptional re gulation can vary substantially depending on the tissues compared. Thus, the le vel of gene regulation depends strongly on the context. For example transcriptional re gulation is contributing significantly to the dynamical responses of den- dritic cells [ 18 ] and to the dif ferences between kidney and prostate gland (Fig S1h) but less to the dif ferences between kidney and liver (Fig S1g). All data, across all profiled tissues, suggest that post-transcriptional regulation contributes substantially to the across-tissues variability of protein le vels. The de gree of this contrib ution depends on the context. Indeed, if we only increase the lev els for a set of mRN As without any other changes, the cor- responding protein le vels must increase proportionally as demonstrated by gene inductions [ 34 ]. Ho we ver , the dif ferences across cell-types are not confined only to dif ferent mRN A le vels. Rather , these differences include dif ferent RN A-binding proteins, alternati ve untranslated regions (UTRs) with known re gulatory roles in protein synthesis, specialized ribosomes [ 35 – 38 ], and different protein degradation rates [ 39 – 43 ]. The more substantial these differences, the bigger the potential for post-transcriptional regulation. Thus cell-type differentiation and commitment may result in 11 much more post-transcriptional regulation than observed during perturbations preserving the cel- lular identity . Consistent with this possibility , tissue-type specific proteomes may be shaped by substantial post-transcriptional regulation; in contrast, cell stimulation that preserves the cell-type, may elicit a strong transcriptional remodeling but weak er post-transcriptional remodeling. Methods Data sour ces W e used RN A estimates based on RN A-seq from [ 29 , 30 ] and protein estimates based on shotgun mass-spectrometry from [ 20 , 21 ]. These large scale datasets contained N = 6104 genes measured in each of twelve dif ferent human tissues: adrenal gland, esophagus, kidney , ov ary , pancreas, prostate, saliv ary gland, spleen, stomach, testis, thyroid gland, and uterus. For these genes, about 8% of the mRN A measurements and about 40% of the protein measurements are missing. The mRN A datasets contain measurements from multiple subjects/people and the subjects were split into two subsets in estimating the within study reliability in Fig 2 a. W e also used a small scale targeted dataset from [ 22 ] containing data for 33 proteins measured across 5 tissues. The datasets were collected by dif ferent groups and measurements deri ved from dif ferent subjects. Sear ching raw MS data Raw data from [ 21 , 22 ] were searched by MaxQuant [ 44 ] 1.5.7.0 against a protein sequence database including all entries from a Human UniProt database from 2015 and known contaminants such as human keratins and common laboratory contaminants. MaxQuant searches were per- formed with trypsin specificity allo wing up to tw o missed clea v ages, with fixed Carbamidometh yl acetylation on cysteines, and with variable modifications allo wing methionine oxidation and acety- lation on Protein N-termminus. All razor peptides were used for quantifying the proteins to which they were assigned by MaxQuant. False discovery rate (FDR) was set to 1% at both the protein and the peptide le vels. 12 Scaling mRN A lev els First, denote m it the log mRN A le vels for gene i in tissue t . Similarly , let p it denote the corre- sponding log protein le vels. First, we normalize the columns of the data, for both protein and mRN A, to dif ferent amounts of total protein per sample. Any multiplicativ e factors on the raw scale correspond to additi v e constants on the log scale. Consequently , we normalize data from each tissue-type by minimizing the absolute differences between data from the tissue and the first tissue (arbitrarily chosen as a baseline). That is, for all t > 1 , we define p n it = ( p u it − ˆ µ t ) with ˆ µ t = argmin µ X i | p u i 1 − ( p u it − µ ) | Where p n it and p u it represent the normalized and non-normalized protein measurements respectiv ely . For each t , the v alue of µ t which minimizes the absolute dif ference is ˆ µ t = median u ( p i 1 − p u it ) W e use the same normalization for mRN A. This normalization, which corresponds to a location shift of the log abundances for each tissue, corrects for any multiplicative differences in the ra w (unlogged) mRN A or protein. W e normalize these measurements by aligning the medians rather than the means, as the median is more robust to outliers. After normalization, we define r it = p it − m it as the log PTR ratio of gene i in condition t . If the post-transcriptional regulation for the i th gene were not tissue-specific, then the i th PTR ratio would be independent of tissue-type and can be estimated as ˆ T i = median t ( p it − m it ) In such a situation the log “scaled mRN A ” (or mean protein le vel) can be defined as p it = m it + T i 13 On the raw scale this amounts to scaling each mRN A by its median PTR ratio and represents and estimate of the mean protein lev el. The residual dif ference between the log mean protein le v el and the measured log protein le vel, which we call the log rPTR ratio r it = p it − p it consists of both tissue-specific post-transcriptional regulation and measurement noise. Acr oss-tissues correlations For each gene, i , we compute the correlation between mRN A and protein across tissues. Unlike the between gene correlations which are consistently large after scaling for each tissue (Figure 1 a), across-tissues correlations are highly variable between genes. Although this could be in part because true mRN A/protein correlations vary significantly between genes, a huge amount of the heterogeneity can be explained by sampling variability . There are only 10 and 12 tissues in com- mon across datasets (depending on which datasets are used) and for many genes the abundances are missing, which means that the empirical estimates of across tissue correlation for each gene are very noisy . T o find a representativ e estimate of the across-tissues correlation we can take the median o ver all genes. As an alternati v e, if the correlation was roughly constant between genes, we could pool information to yield a representativ e estimate of this across-tissues correlation. For a gene i , we compute the Fisher transformation of the within-gene correlation. This Fisher trans- formation, z i = arctanh ( ˆ r i ) is approximately normally distributed: z i ∼ N 1 2 l og ( 1 + ρ 1 − ρ ) , 1 √ N i − 3 where N i are the number of observed mRN A-protein pairs for gene i (at most 11) and ρ corre- sponds to the population correlation. W e estimate the maximum likelihood estimate of the Fisher 14 transformed population correlation by weighting each observ ation by its v ariance: ω i = 1 n i − 3 W i = ω i P j ω j ˆ z pop = X W i z i W e then transform this estimate back to the correlation scale ˆ ρ = e 2 ˆ z pop − 1 e 2 ˆ z pop + 1 Depending on the data sets used, with this method we estimate the population across-tissues mRN A/protein correlation to be between 0.21 ( [ 20 ]) and 0.29 ( [ 21 ]). This correlation cannot be used as direct evidence for the relationship between mRN A and protein levels since both mRN A and protein datasets are unreliable due to measurement noise. This measurement noise attenuates the true correlation. Below we address this by directly estimating data reliability and correcting for noise. Noise corr ection Measurement noise attenuates estimates of correlations between mRNA and protein le vel [ 45 ]. A simple way to quantify this attenuation of correlation due to measurement error is via Spearman’ s correction. Spearman’ s correction is based on the fact that the v ariance of the measured data can be decomposed into the sum of v ariance of the noise and the signal. If the noise and the signal are independent, this decomposition and the Spearman’ s correction are exact [ 17 ]. Note that it is simple to sho w that the empirical v ariance is the sum of the v ariance of the signal and the v ariance of the noise: • e i - Expectation at the i th data point; ˜ e i = e i − h e i • ζ i - Noise at the i th data point; h ζ i = 0 15 • x i - Observ ation at the i th data point; ˜ x i = x i − h x i , x i = e i + ζ i ; σ 2 x = 1 n X i ˜ x 2 i = 1 n X i ( ˜ e i + ζ i ) 2 = = 1 n X i ˜ e 2 i | {z } σ 2 e + 1 n X i ζ 2 i | {z } σ 2 ζ + 2 n X i ˜ e i ζ i | {z } ≈ 0 Spearman’ s correction is based on estimates of the “reliability” of the measurements, which is defined as the fraction of total measured v ariance due to signal rather than to noise: Reliability = σ 2 sig nal σ 2 total (1) = 1 − σ 2 err σ 2 err + σ 2 sig nal (2) If X and Y are noisy measurements of two quantities, we can compute the noise corrected corre- lation between them as C or ( X , Y ) p Rel ( X ) Rel ( Y ) (3) (4) In practice, reliabilities are not kno wn but we can often estimate them. In this application, for both mRNA and protein we need measurements in which all steps, from sample collection to le vel estimation, are repeated independently . In order to estimate the mRNA reliabilities we use independent measurements from [ 30 ] and [ 29 ]. For estimating protein reliabilities we use mea- surements from [ 20 ] and [ 21 ]. across-tissues reliabilities are computed per gene whereas within- tissue reliabilities are computed per tissue across genes. If two independent measurements hav e the same reliability , it can be estimated by computing the correlation between the two measure- ments [ 17 , 46 , 47 ]. W e estimated the approximate across-tissues protein reliability to be 0.21 and the across-tissues mRN A reliability to be 0.77. Gi ven the estimated across-tissues mRNA/protein correlation of 0.29 (calculated using data from [ 21 ] and [ 30 ]) we estimated the noise-corrected fraction of across-tissues protein variance explained by mRN A to be approximately 50%, Figure 16 2 . Note that if both mRN A or both protein datasets share biases, then the estimated reliabilities will be too small, thus deflating the inferred fraction of protein v ariance explained by mRN A. More- ov er , because the reliabilities are low , sampling v ariability is large, missing data is prev alent, and mRN A/protein correlation likely v ary by gene there is uncertainty about this estimate. Cr eating a consensus protein dataset W e use the two independent protein datasets to create a single consensus data set which is of ar - guably higher reliability than either dataset indi vidually . T o create this dataset, we take a weighted av erage of the two protein abundance datasets, by tissue. W e compute the weights based on mea- surement reliabilities for each tissue in each of the two datasets. Assume we hav e two random variables, ∼ X 1 and ∼ X 2 , corresponding to measurements on the same quantity (e.g. two independent protein measurements) with ∼ X i = X + i where X ∼ N (0 , σ 2 X ) is the signal which is independent of i ∼ N (0 , σ 2 i ) , the measurement error for sample i . W e ha ve a third random v ariable corresponding to a different quantity (e.g. an mRN A measure- ment), ∼ Y that is typically positi vely correlated with ∼ X 1 and ∼ X 2 with the same co v ariance σ 2 X Y . T o create the consensus data set we first compute the reliability of ∼ X i Rel ( ∼ X i ) = σ 2 X σ 2 ∼ X i = σ 2 X σ 2 X + σ 2 i for both datasets. Note that Cor ( ∼ X 1 , ∼ X 2 ) = σ 2 X σ ∼ X 1 σ ∼ X 2 Cor ( ∼ X i , Y ) = σ 2 X Y σ ∼ X i σ Y 17 Thus, Cor ( ∼ X 1 , ∼ X 2 ) Cor ( ∼ X 1 , ∼ Y ) Cor ( ∼ X 2 , ∼ Y ) = σ 2 X σ 2 ∼ X 1 = σ 2 X σ 2 X + σ 2 1 = Rel ( ∼ X 1 ) Similarly , Cor ( ∼ X 1 , ∼ X 2 ) Cor ( ∼ X 2 , ∼ Y ) Cor ( ∼ X 1 , ∼ Y ) = Rel ( ∼ X 2 ) . W e use these facts and compute the empirical corre- lations between datasets to independently estimate the across gene reliabilities for each tissue from each dataset. W e then Fisher weight the protein abundances based on their reliabilities. That is, for each tissue t , the consensus dataset, X C t is X C t = w ∼ X t t + (1 − w ) ∼ X 2 t w = Rel ( ∼ X 1 t ) Rel ( ∼ X 1 t ) + Rel ( ∼ X 2 t ) When the reliability of ∼ X 1 t and ∼ X 2 t are close, each dataset is weighted equally . When one reliability dominates the other , that dataset contrib utes more to the aggreg ated dataset. W e found that the full consensus data set has a higher median per gene correlation with mRN A than either of the protein datasets indi vidually (0.34) and agreed more closely with v alidation data from [ 22 ] (T able 1 ). Functional gene set analysis T o identify tissue-specific rPTR for functional sets of genes, we analyzed the distrib utions of rPTR ratios within functional gene-sets using the same methodology as [ 48 ]. W e restrict our attention to functional groups in the GO ontology [ 31 ] for which at least 10 genes were quantified by [ 20 ]. Let k index one of these approximately 1600 functional gene sets. First, for e v ery gene in e very tissue we estimate the relati ve PTR (rPTR) or equiv alently , the difference between log mean protein lev el and measured protein le vel: ˆ r it = p it − median t 0 6 = t ( p it 0 − m it 0 ) 18 T o exclude the possibility that ˆ r it = 0 exactly , we require that t 0 6 = t . When the estimated rPTR is larger than zero, the measured protein lev el in tissue t is lar ger than the estimated mean protein le vel. Like wise, when this quantity is smaller than zero, the measured protein is smaller than e xpected. Measured de viations from the mean protein lev el are due to both measurement noise and tissue specific PTR. T o eliminate the possibility that all of the variability in the rPTR ratios is due to measurement error we conduct a full gene set analysis. For each of the gene sets we compute a v ector of these estimated log ratios so that a gene set is comprised of G kt = { ˆ r i 1 j , ..., ˆ r i n k t } where i 1 to i n k index the genes in set k and t index es the tissue type. Let K S ( G 1 , G 2 ) be the function that returns the p-value of the K olmogorov-Smirno v test on the distrib ution in sets G 1 and G 2 . The KS-test is a test for a dif ference in distrib ution between two samples. Using this test, we identify gene sets that show systematic dif ferences in PTR ratio in a particular tissue ( t ) relati ve to all other tissues. Specifically , the p-v alue associated with gene set k in condition j is ρ kt = KS ( G kt , ∪ t 0 6 = t G kt 0 ) T o correct for testing multiple hypotheses, we computed the false discov ery rate (FDR) for all gene sets in tissue t [ 49 ]. In Figure 3 a-c, we present only the functional groups with FDR less than 1% and report their associated p-v alues. Note that the test statistics for each gene set are pos- iti vely correlated since the gene sets are not disjoint, but [ 50 ] prov e that the Benjamini-Hochberg procedure applied to positively correlated test statistics is conserv ati ve. Thus, the significance of of certain functional groups suggests that not all of the v ariability in rPTR is due to measurement noise. W e also calculated rPTR using two pairs of measurements: one set of rPTR estimates w as calculated using protein data from [ 20 ] and mRN A from [ 30 ] and the other w as calculated using data from [ 21 ] and [ 29 ]. rPTR of the significant sets was largely reproducible across estimates from independent datasets (Figure 3 d) and less reproducible across genes (T able S2 ). Note that when computing the per tissue reliabilities for the construction of the consensus data set, we found 19 that the reliabilities of the lung and pancreas datasets from [ 20 ] were much less reliable than the data from [ 21 ]. This could explain why the independent estimates of the rPTR ratios for these tissues were less reproducible. Acknowledgments W e thank M. Jov ano vic, H. Specht, E. W allace, J. Schmiedel, and D. A. Drum- mond for discussions and constructi ve comments. Supplemental website: https://web.northeastern.edu/sla v o vlab/2016 PTR/ The code can be f ound at: https://github .com/afranks86/tissue-ptr Refer ences 1. Sørlie T , Perou CM, T ibshirani R, Aas T , Geisler S, Johnsen H, et al. Gene express ion patterns of breast carcinomas distinguish tumor subclasses with clinical implications. Pro- ceedings of the National Academy of Sciences. 2001;98(19):10869–10874. 2. Sla v ov N, Dawson KA. Correlation signature of the macroscopic states of the gene regulatory netw ork in cancer . Proceedings of the National Academy of Sciences. 2009;106(11):4079–4084. doi:10.1073/pnas.0810803106. 3. Spellman PT , Sherlock G, Zhang MQ, Iyer VR, Anders K, Eisen MB, et al. Comprehen- si ve identification of cell cycle–regulated genes of the yeast Sacc har omyces cere visiae by microarray hybridization. Molecular biology of the cell. 1998;9(12):3273–3297. 4. Sla v ov N, Macinskas J, Caudy A, Botstein D. Metabolic cycling without cell di vision cycling in respiring yeast. Proceedings of the National Academy of Sciences of the United States of America. 2011;108(47):19090–19095. 5. Sla v ov N, Airoldi EM, v an Oudenaarden A, Botstein D. A conserved cell growth cycle can account for the en vironmental stress responses of di ver gent eukaryotes. Molecular Biology of the Cell. 2012;23(10):1986 – 1997. doi:10.1091/mbc.E11-11-0961. 6. Djebali S, Da vis CA, Merkel A, Dobin A, Lassmann T , Mortazavi A, et al. Landscape of transcription in human cells. Nature. 2012;489(7414):101–108. 20 7. Alberts B, Johnson A, Mor gan JLD, Raff M, Roberts K, W alter P . Molecular Biology of the Cell. 6th ed. Garland; 2014. 8. K uersten S, Goodwin EB. The power of the 3 UTR: translational control and de velopment. Nature Re vie ws Genetics. 2003;4(8):626–637. 9. Hengst L, Reed SI. T ranslational control of p27Kip1 accumulation during the cell cycle. Science. 1996;271(5257):1861–1864. 10. Polymenis M, Schmidt EV . Coupling of cell di vision to cell gro wth by translational control of the G1 cyclin CLN3 in yeast. Genes & dev elopment. 1997;11(19):2522. 11. Daran-Lapujade P , Rossell S, van Gulik WM, Luttik MA, de Groot MJ, Slijper M, et al. The fluxes through glycolytic enzymes in Sacc har omyces cere visiae are predominantly reg- ulated at posttranscriptional lev els. Proceedings of the National Academy of Sciences. 2007;104(40):15753–15758. 12. Sla v ov N, Budnik B, Schw ab D, Airoldi E, van Oudenaarden A. Constant Growth Rate Can Be Supported by Decreasing Ener gy Flux and Increasing Aerobic Glycolysis. Cell Reports. 2014;7:705 – 714. 13. Gygi SP , Rochon Y , Franza BR, Aebersold R. Correlation between protein and mRN A abundance in yeast. Molecular and cellular biology . 1999;19(3):1720–1730. 14. Smits AH, Lindeboom RG, Perino M, van Heeringen SJ, V eenstra GJC, V ermeulen M. Global absolute quantification re veals tight re gulation of protein expression in single Xeno- pus eggs. Nucleic acids research. 2014;42(15):9880–9891. 15. Schw anh ¨ ausser B, Busse D, Li N, Dittmar G, Schuchhardt J, W olf J, et al. Global quantifi- cation of mammalian gene expression control. Nature. 2011;473(7347):337–342. 16. Li JJ, Bickel PJ, Biggin MD. System wide analyses hav e underestimated protein abundances and the importance of transcription in mammals. PeerJ. 2014;2:e270. 21 17. Cs ´ ardi G, Franks A, Choi DS, Airoldi EM, Drummond D A. Accounting for experimental noise rev eals that mRNA levels, amplified by post-transcriptional processes, largely deter- mine steady-state protein le vels in yeast. PLoS Genetics. 2015;11(5):e1005206. 18. Jo v anovic M, Rooney MS, Mertins P , Przybylski D, Che vrier N, Satija R, et al. Dynamic profiling of the protein life c ycle in response to pathogens. Science. 2015;347(6226):1259038. 19. Cheng Z, T eo G, Krue ger S, Rock TM, Koh HW , Choi H, et al. Dif ferential dynamics of the mammalian mRN A and protein e xpression response to misfolding stress. Molecular systems biology . 2016;12(1):855. 20. W ilhelm M, Schlegl J, Hahne H, Gholami A, Lieberenz M, et al . Mass-spectrometry-based draft of the human proteome. Nature. 2014;509:582–587. 21. Kim MS, Pinto SM, Getnet D, Nirujogi RS, Manda SS, Chaerkady R, et al. A draft map of the human proteome. Nature. 2014;509(7502):575–581. 22. Edfors F , Danielsson F , Hallstr ¨ om BM, K ¨ all L, Lundberg E, Pont ´ en F , et al. Gene-specific correlation of RN A and protein le vels in human cells and tissues. Molecular Systems Biol- ogy . 2016;12(10):883. 23. Blyth CR. On Simpson’ s paradox and the sure-thing principle. Journal of the American Statistical Association. 1972;67(338):364–366. 24. Marioni JC, Mason CE, Mane SM, Stephens M, Gilad Y . RNA-seq: an assessment of technical reproducibility and comparison with gene e xpression arrays. Genome research. 2008;18(9):1509–1517. 25. Consortium SI, et al. A comprehensi v e assessment of RN A-seq accuracy , reproducibility and information content by the Sequencing Quality Control Consortium. Nature Biotech- nology . 2014;32(9):903–914. 26. Peng M, T aouatas N, Cappadona S, v an Breukelen B, Mohammed S, Scholten A, et al. Protease bias in absolute protein quantitation. Nature methods. 2012;9(6):524–525. 22 27. Ong SE, Blagoev B, Kratchmaro v a I, Kristensen DB, Steen H, P andey A, et al. Stable isotope labeling by amino acids in cell culture, SILA C, as a simple and accurate approach to expression proteomics. Molecular & cellular proteomics. 2002;1(5):376–386. 28. Blagoe v B, Ong SE, Kratchmarova I, Mann M. T emporal analysis of phosphotyrosine- dependent signaling networks by quantitati ve proteomics. Nature biotechnology . 2004;22(9):1139–1145. 29. Djebali S, Da vis CA, Merkel A, Dobin A, Lassmann T , Mortazavi A, et al. Landscape of transcription in human cells. Nature. 2012;489(7414):101–108. 30. F agerberg L, Hallstr ¨ om BM, Oksvold P , Kampf C, Djureinovic D, Odeberg J, et al. Analysis of the human tissue-specific e xpression by genome-wide inte gration of transcriptomics and antibody-based proteomics. Molecular & Cellular Proteomics. 2014;13(2):397–406. 31. Consortium GO, et al. The Gene Ontology (GO) database and informatics resource. Nucleic acids research. 2004;32(suppl 1):D258–D261. 32. Hall JE. Guyton and Hall T e xtbook of Medical Physiology: Enhanced E-book. Else vier Health Sciences; 2010. 33. Budnik B, Levy E, Slav o v N. Mass-spectrometry of single mammalian cells quantifies proteome heterogeneity during cell dif ferentiation. bioRxi v . 2017; DOI: 10.1101/102681. 34. McIsaac RS, Silverman SJ, McClean MN, Gibney P A, Macinskas J, Hickman MJ, et al. Fast-acting and nearly gratuitous induction of gene expression and protein depletion in Sac- char omyces cer evisiae . Molecular biology of the cell. 2011;22(22):4447–4459. 35. Mauro VP , Edelman GM. The ribosome filter hypothesis. Proceedings of the National Academy of Sciences. 2002;99(19):12031–12036. 36. Mauro VP , Matsuda D. T ranslation re gulation by ribosomes: Increased complexity and expanded scope. RN A biology . 2016;13(9):748–755. 37. Sla v ov N, Semrau S, Airoldi E, Budnik B, v an Oudenaarden A. Dif ferential stoichiometry among core ribosomal proteins. Cell Reports. 2015;13:865 – 873. 23 38. Preiss T . All Ribosomes Are Created Equal. Really? Trends in biochemical sciences. 2016;41(2):121–123. 39. Gebauer F , Hentze MW . Molecular mechanisms of translational control. Nature revie ws Molecular cell biology . 2004;5(10):827–835. 40. Rojas-Duran MF , Gilbert WV . Alternativ e transcription start site selection leads to large dif ferences in translation acti vity in yeast. RN A. 2012;18(12):2299–2305. 41. Castello A, Fischer B, Eichelbaum K, Horos R, Beckmann BM, Strein C, et al. In- sights into RN A biology from an atlas of mammalian mRN A–binding proteins. Cell. 2012;149(6):1393–1406. 42. Arribere J A, Gilbert WV . Roles for transcript leaders in translation and mRN A decay re- vealed by transcript leader sequencing. Genome research. 2013;23(6):977–987. 43. Katz Y , Li F , Lambert NJ, Sokol ES, T am WL, Cheng A W , et al. Musashi proteins are post-transcriptional regulators of the epithelial-luminal cell state. eLife. 2014;3:e03915. 44. Cox J, Mann M. MaxQuant enables high peptide identification rates, individualized ppb- range mass accuracies and proteome-wide protein quantification. Nature biotechnology . 2008;26(12):1367–1372. 45. Franks AM, Cs ´ ardi G, Drummond D A, Airoldi EM. Estimating a structured cov ariance matrix from multi-lab measurements in high-throughput biology . Journal of the American Statistical Association. 2015;110(509):27–44. 46. Spearman C. The proof and measurement of association between two things. Am J Psychol. 1904;15:72–101. 47. Zimmerman D, Williams R. Properties of the spearman correction for attenuation for normal and realistic non-normal distrib utions. Applied Psychological Measurement. 1997;21(3):253270. 48. Sla v ov N, Botstein D. Coupling among growth rate response, metabolic cycle, and cell di vision cycle in yeast. Molecular Biology of the Cell. 2011;22(12):1997–2009. 24 49. Store y JD. The positive false discov ery rate: A Bayesian interpretation and the q-value. Annals of statistics. 2003; p. 2013–2035. 50. Benjamini Y , Y ekutieli D. The control of the false discov ery rate in multiple testing under dependency . Annals of statistics. 2001; p. 1165–1188. T ables W ilhelm et al. Kim et al. Consensus T issue type Proteins Peptides Proteins Kim pep Proteins Peptides Adrenal Gland 3,947 43,661 3,610 40,619 4,436 62,719 Colon 3,745 34,925 4,004 32,786 4,517 52,872 Esophagus 3,989 39,677 1,682 15,298 4,086 45,881 Kidney 3,045 34,740 2,814 26,499 3,526 45,865 Li ver 3,669 34,844 2,307 22,992 3,971 45,168 Lung 2,852 31,293 2,935 29,686 3,704 47,617 Ov ary 3,681 41,289 3,568 53,956 4,419 72,337 Pancreas 3,048 30,463 2,326 19,974 3,423 38,807 Prostate 3,467 38,562 3,118 33,765 3,932 51,891 T estis 3,950 51,369 3,505 42,865 4,478 70,952 Spleen 3,244 39,465 0 0 3,237 39,465 Stomach 3,957 44,609 0 0 3,949 44,609 Heart 3,957 0 2,227 27,205 2,227 27,205 All 5,719 113,069 5,326 105,158 5,786 150,830 T able 1. Proteome co verage. Number of quantified proteins and peptides in 3 datasets: [ 20 ], [ 21 ], and the consensus dataset deri ved here. The consensus data ha v e the highest cov erage and the best agreement with the v alidation dataset, Fig 4 . 25 Figur es a b T otal var iance, R } Across-tissue variance within a protein, R } 2 P 2 P 2 T c -1 -0.5 0 0.5 1 mRNA-Protein Correlation 0 0.2 0.4 0.6 0.8 1 Empirical Cumulative Density R T Wilhelm et al., all genes Kim et al., all genes Wilhelm et al. Kim et al. Edfors et al. { d Figure 1. The fraction of total protein variance explained by scaled mRN A lev els is not inf ormative about the acr oss-tissues v ariance explained by scaled mRNA le vels. ( a ) mRNA le vels correlate with measured protein le v els ( R T = 0 . 33 ov er all measured mRN As and proteins across 12 dif ferent tissues). ( b ) Protein le vels v ersus mRN A le v els scaled by the median protein-to-mRN A ratio (PTR); the only change from panel (a) is the scaling of mRN As which considerably improv es the correlation. ( c ) A subset of 100 genes are used to illustrate an example Simpson’ s paradox: regression lines reflect within-gene and across-tissues v ariability . Despite the fact that the o verall correlation between scaled mRN A and measured protein lev els is large and positi ve R T = 0 . 89 , for any single gene in this set, mRN A lev els scaled by the median PTR ratio are not correlated to the corresponding measured protein le v els ( R P ≈ 0 ). ( d ) Cumulati ve distributions of across-tissues scaled mRN A-protein correlations (R P ) for 3 datasets [ 20 – 22 ]. The smooth curves correspond to all quantified proteins by shotgun proteomics while the dashed curves correspond to a subset of proteins quantified in a small tar geted dataset [ 22 ]. The v ertical lines sho w the corresponding ov erall (conflated) correlation between scaled mRN A le v els and protein le vels, R T . See Methods and Fig S1. 26 Reliability V ariance explained by mRNA Within Studies Across Studies R 2 = C or ( RN A , protein ) 2 Rel ( RN A ) Rel ( protein ) 0 0.2 0.4 0.6 0.8 1 Across-tissues correlations 0 1 2 3 4 # mRNAs RNA Reliability = 0.84 x1000 Fagerberg et al. = 0.83 Djebali et al. = 0.85 a 0 0.2 0.4 0.6 0.8 1 Across-tissues correlations 0 1 2 3 RNA Reliability = 0.79 x1000 c 0 0.2 0.4 0.6 0.8 1 Across-tissues correlations 0 100 200 300 400 500 600 # Proteins Protein Reliability = 0.85 Wilhelm et al. = 0.85 Kim et al. = 0.86 b -1 -0.5 0 0.5 1 Across-tissue correlations 0 50 100 150 200 250 Protein Reliability = 0.25 d 0.0 0.2 0.4 0.6 0.8 1.0 0.0 0.2 0.4 0.6 0.8 1.0 Fraction of Across−Tissue Protein V ariance Explained By T ranscript Levels Reliability of mRNA Measurements Reliability of Protein Measurements X X 10% 20% 30% 40% 50% 60% 70% 80% 90% 100% e Figure 2. Data reliability crucially influences estimates of transcriptional and post-transcriptional regulation acr oss-tissues. ( a ) The within-study reliability – defined as the fraction of the measured v ariance due to the signal – of relati ve mRN A lev els is estimated as the correlation between the mRN A le v els measured in the twelve dif ferent tissues. Estimates for the le vels of each transcript measured in dif ferent subjects were correlated (a v eraging across the 12 tissue-types) and the results for all analyzed transcripts displayed as a distribution for each RN A dataset [ 29 , 30 ]. ( b ) The within-study reliability of relativ e protein le v els is estimated as the correlation between the protein le vels measured in 12 dif ferent tissues [ 20 , 21 ]. W ithin each dataset, separate estimates for each protein were deri ved from non-o verlapping sets of peptides and were correlated (av eraging across the 12 tissue-types) and the results for all analyzed proteins displayed as a distribution; see Methods. ( c ) The across-study reliability of mRNA w as estimated by correlating estimates as in (a) but these estimates came from dif ferent studies [ 29 ] and [ 30 ]. ( d ) The across-study reliability of proteins was estimated by correlating estimates as in (b) b ut these estimates came from dif ferent studies [ 20 ] and [ 21 ]. ( e ) The fraction of across-tissues protein v ariance that can be explained by mRN A lev els is plotted as a function of the reliability of the estimates of mRN A and protein le v els, gi ven an empirical mRN A/protein correlation of 0.29. The red Xs correspond to two estimates of reliability of the mRN A and protein measurements computed from both independent mRN A and protein datasets. 27 −4 0 2 4 P−V alue Rac GT Pase bi ndi ng 9 × 10 −5 tricarboxylic acid cyc le 2 × 10 −9 mitochondrial membrane 8 × 10 −6 respiratory electron transport < 10 − 15 pyruvate metabolic pr ocess 1 × 10 −4 oxidoreductase activity , acting on NADH or NADPH 1 × 10 −4 succinate metabolic process 1 × 10 −4 translational elongation 3 × 10 −7 acyl−CoA dehydrogenase activity 4 × 10 −5 ri bos oma l p rot ei ns 5 × 10 −7 log rPTR ratio 10 −2 a −4 0 2 4 P−V alue tra nsl ati on al ter min ati on 2 × 10 −7 ion tr ans po rt 5 × 10 −5 glu tat hio ne tr ans fer as e ac tiv ity 7 × 10 −5 rib oso mal p rot ein s 4 × 10 −5 respiratory electron transport 2 × 10 −5 glu cos e t ran sp ort re gul at ion 4 × 10 −5 tRN A a min oa cyl ati on for pro tei n t ra nsl ati on 7 × 10 −6 Ran GT Pase bi nd ing 2 × 10 −5 tRN A b ind in g 1 × 10 −7 Gol gi tra ns por t co mpl ex 5 × 10 −9 log rPTR ratio 10 −2 b adrenal gland colon esophagus kidney liver lung ovary pancreas prostate spleen stomach testis translation translational initiation translational elongation ribosome translational termination SRP cotranslational membrane targeting tRNA aminoacylation for translation mitochondrial ribosome cytochrome-c oxidase activity NADH to ubiquinone electron transport mitochondrial respiratory chain complex I NADH dehydrogenase (ubiquinone) activity respiratory electron transport chain 4 iron, 4 sulfur cluster binding mitochondrion mitochondrial inner membrane mitochondrial membrane generation of metabolites and energy electron carrier activity mitochondrial matrix tricarboxylic acid cycle fatty acid beta-oxidation acyl-CoA dehydrogenase activity branched chain amino acid catabolism stress fiber adhesion-dependent cell spreading extracellular matrix basement membrane cell-matrix adhesion extracellular matrix disassembly focal adhesion cell adhesion spherical HDL particle -1 -0.8 -0.6 -0.4 -0.2 0 0.2 0.4 0.6 0.8 1 c Adrenal Gland −1 0 1 −1 0 1 Cor = 0.63 Kidney −1 0 1 −1 0 1 Cor = 0.79 Lung −1 0 1 −1 0 1 Cor = 0.14 Prostate −1 0 1 −1 0 1 Cor = 0.8 Estimate 1 of rPTR ratios Estimate 2 of rPTR ratios d Figure 3. Concerted variability in the relati ve pr otein-to-RNA (rPTR) ratio of functional gene-sets across tissue-types ( a ) mRN As coding for the ribosomal proteins, N ADH dehydrogenase and respiratory proteins ha ve higher protein-to-mRN A ratios in kidney as compared to the median across the other 11 tissues (FDR < 1% ). In contrast mRN As genes functioning in Rac GTPase binding ha v e lo wer protein-to-mRN A ratios (FDR < 1% ). ( b ) The stomach also sho ws significant rPTR v ariation, with lo w rPTR for the ribosomal proteins and high rPTR for tRN A-aminoac ylation (FDR < 1% ). ( c ) Summary of rPTR variability , as depicted in panel (a-b), across all tissues and many gene ontology (GO) terms. Metabolic pathways and functional gene-sets that sho w statistically significant (FDR < 1% ) v ariability in the relativ e protein-to-mRN A ratios across the 12 tissue types. All data are displayed on a log 10 scale, and functionally related gene-sets are marked with the same color . ( d ) The reproducibility of rPTR estimates across estimates from dif ferent studies is estimated as the correlation between the median rPTRs for GO terms sho wing significant enrichment as sho wn in panels (a-c). See Methods, Fig S2 and Fig S3. 28 −0.4 −0.2 0.0 0.2 0.4 0.6 0.0 0.1 0.2 0.3 0.4 0.5 Median across−tissue correlations versus protein reliability (F agerberg et al) Median Protein/Protein Correlation Median mRNA/Protein Correlation Consensus Wilhelm et al. Kim et al. a −0.4 −0.2 0.0 0.2 0.4 0.6 0.0 0.1 0.2 0.3 0.4 0.5 Median across−tissue correlations versus protein reliability (ENCODE) Median Protein/Protein Correlation Median mRNA/Protein Correlation Consensus Wilhelm et al. Kim et al. b c Mean Squared Error T issue W ilhelm et al. Kim et al. Consensus Prostate 0.45 0.35 0.35 Lung 0.58 0.22 0.18 Li ver 0.81 0.16 0.16 Colon 0.39 0.32 0.28 Kidney 0.53 0.66 0.53 All 0.54 0.37 0.32 Figure 4. Deriving a consensus protein dataset f or impr ov ed quantification of human tissue proteomes W e compiled a consensus protein dataset by merging data from [ 20 ] and [ 21 ] as described in Methods. The relati ve protein le v els estimated from [ 20 ], [ 21 ], and the consensus dataset were correlated to mRN A le v els from [ 30 ] ( a ) or to mRN A le vels from [ 29 ] ( b ). The correlations are sho wn as a function of the median correlation between protein estimates from [ 20 ] and [ 21 ]. The consensus dataset exhibits the highest correlations, suggesting that it has av eraged out some of the noise in each dataset and pro vides a more reliable quantification of of human tissue proteomes. ( c ) The datasets from [ 20 ], from [ 21 ], and the consensus dataset were e v aluated by comparison to a targeted MS v alidation dataset quantifying 33 proteins o ver 5 tissues [ 22 ]. The similarity for each dataset was quantified by the mean squared error (MSE) relati ve to the tar geted MS v alidation data using 124 protein/tissue measurements that were observed in all datasets. The MSEs are reported for each of the five tissues and for all 5 tissues combined; they indicate that the consensus data ha v e the best agreement with the v alidation dataset. 29 Supplemental T ables and Figur es T able S1. Estimates of relati ve pr otein-to-RN A (rPTR) ratio f or GO terms repr oduce across differ ent datasets Pearson correlations between two estimates of the median rPTR ratios for all GO terms indicate reproducible ef fects in all tissues. As in Fig 2 , rPTR estimates are deri ved using independent data sources. The lo wer and upper estimates are the endpoints of the 95% confidence interv al. T able S2. Estimates of relati ve pr otein-to-RN A (rPTR) ratio f or genes repr oduce acr oss different datasets Correlations between the tw o estimates of rPTR ratios for all genes indicate reproducible ef fects in all tissues. The rPTR ratios were estimated independently from dif ferent datasets (as in Fig 2 ). The lo wer and upper estimates are the endpoints of the 95% confidence interv al. Dataset S1. Consensus dataset of protein lev els across human tissues A zip-archiv ed comma- delimited text file with consensus estimates of protein lev els across 13 human tissues: adrenal gland, colon, esophagus, kidney , li ver , lung, ov ary , pancreas, prostate, testis, spleen, stomach, and heart. Dataset S2. Peptide levels across human tissues A zip-archiv ed comma-delimited text file with estimates of peptide lev els across 13 human tissues: adrenal gland, colon, esophagus, kidney , li ver , lung, ov ary , pancreas, prostate, testis, spleen, stomach, and heart. This file contains all peptide le vels (integrated precursors areas) estimated from the MaxQuant searches described in the Methods. Figure S1. The total protein variance explained by scaled mRN A le vels is not indicativ e of the correlations between mRN A and pr otein f old-changes acr oss the corresponding tissue pairs. (a-c, top row), protein versus mRN A in kidney , liv er and prostate. (d-f, middle row) protein versus scaled mRN A in kidney , liv er and prostate. The only dif ference from the top ro w is that the mRN A was scaled by the median PTR. (g-i, bottom ro w) protein fold changes v ersus the corresponding mRN A fold changes between the tissues indicated on the top. While scaled mRN A is predicti ve of the absolute protein le v els the accuracy of these predictions does not generally reflect the accuracy of protein fold-changes across tissues that are predicted from the corresponding mRN A fold-changes. RN A fold changes in (g-i, bottom ro w) were computed between the mRN A le v els without PTR scaling. 30 Figure S2. Fraction of across-tissues variability in pr otein le vels explained by RN A variability f or differ ent functional gene sets. ( a ) The distrib utions of across-tissues correlations for gene sets defined by the gene ontology are sho wn as boxplots. The reliability of RN A and protein are estimated as the correlations between estimates from dif ferent datasets. ( b ) For each gene set, the median RN A-protein correlation was corrected by the median reliabilities and the results sho wn as a boxplot. Dif ferences between RN A-protein correlations for dif ferent gene-sets cannot be explained simply by dif ferences in the reliabilities. Figure S3. Reproducibility of rPTR ratios estimated fr om different datasets The x-ax es sho ws estimates from W ilhelm et al. [ 20 ] and the y-ax es estimates from Kim et al. [ 21 ].
Original Paper
Loading high-quality paper...
Comments & Academic Discussion
Loading comments...
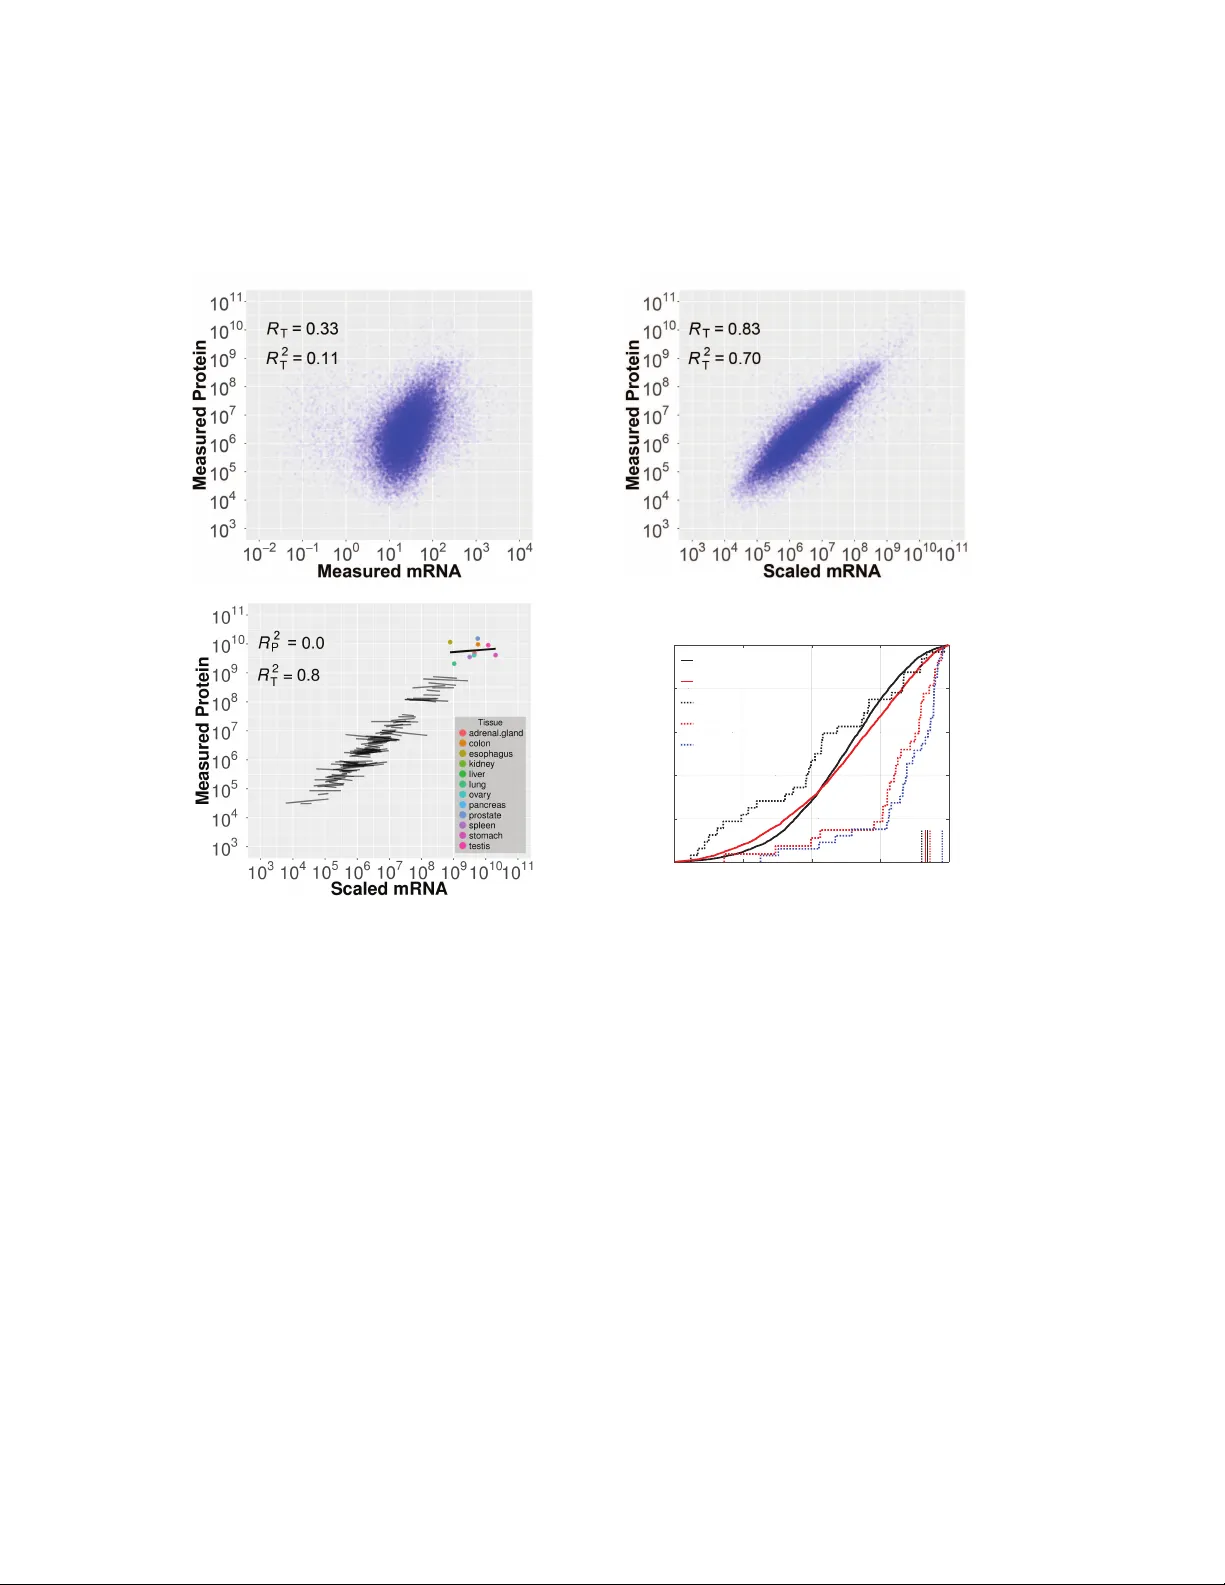
Leave a Comment