Spatio-Temporal Modeling of Users Check-ins in Location-Based Social Networks
Social networks are getting closer to our real physical world. People share the exact location and time of their check-ins and are influenced by their friends. Modeling the spatio-temporal behavior of users in social networks is of great importance f…
Authors: Ali Zarezade, Sina Jafarzadeh, Hamid R. Rabiee
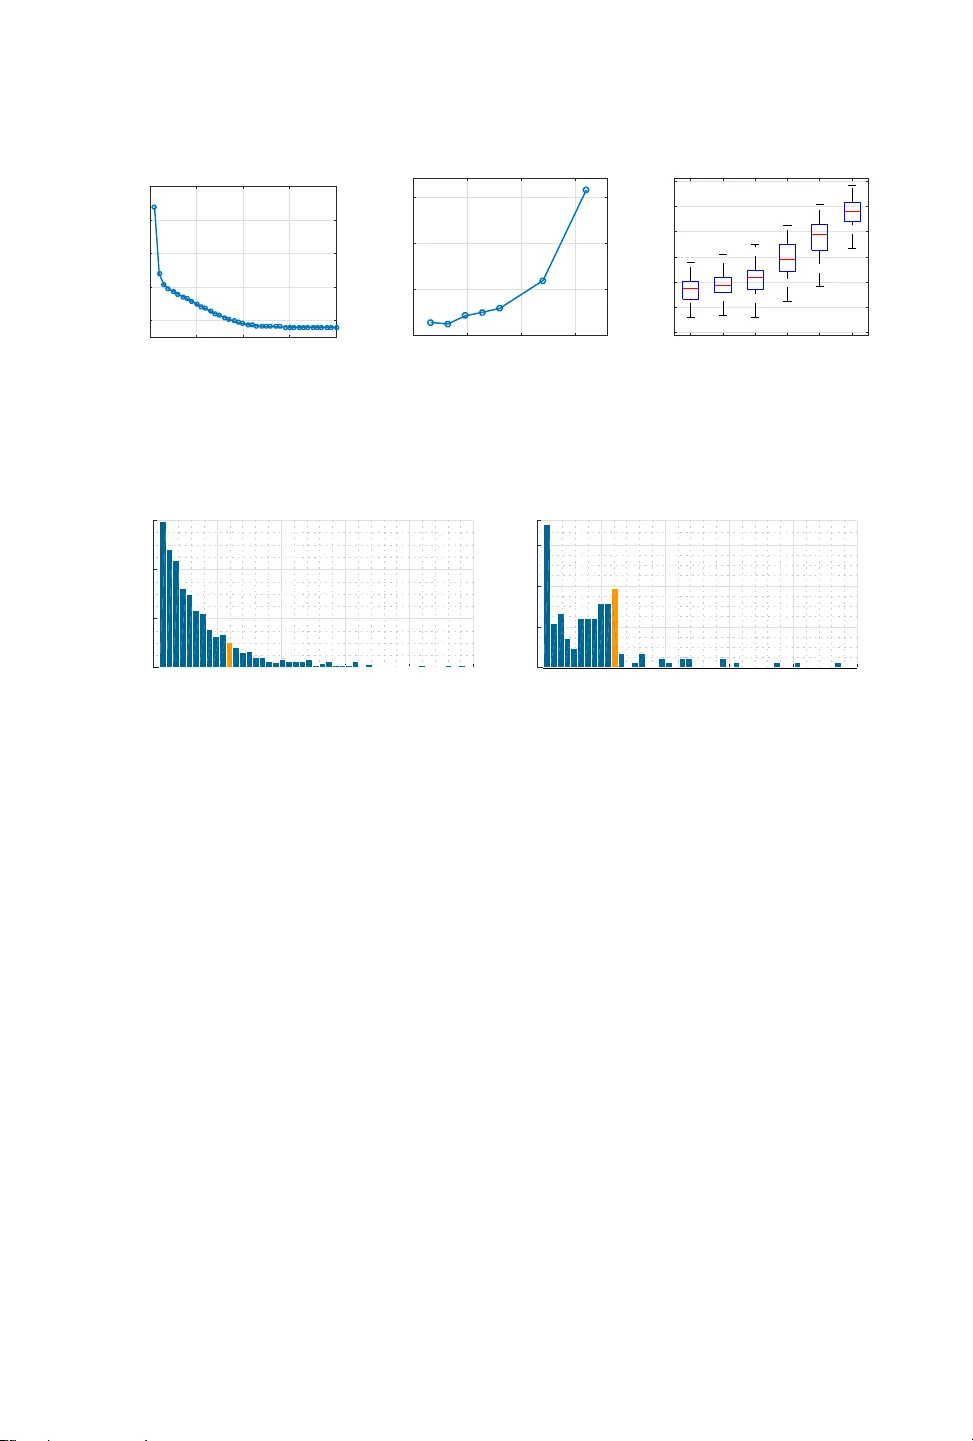
39 Spatio- T emporal Modeling of Users’ Check-ins in Location-Base d Social Networks ALI ZAREZADE, SINA JAF ARZADEH, and HAMID R. RABIEE, Sharif University of T echnology Social networks are getting closer to our real physical world. People share the exact location and time of their check-ins and are inuenced by their friends. Modeling the spatio-temporal behavior of users in social networks is of great importance for predicting the future behavior of users, controlling the users’ movements, and nding the latent inuence network. It is observed that users have periodic patterns in their movements. Also, they are inuenced by the locations that their close friends recently visited. Leveraging these two observations, we propose a probabilistic model based on a doubly stochastic point process with a periodic decaying kernel for the time of che ck-ins and a time-varying multinomial distribution for the location of check-ins of users in the location-based social networks. W e learn the model parameters using an ecient EM algorithm, which distributes over the users. Experiments on synthetic and real data gathered from Foursquar e show that the proposed inference algorithm learns the parameters eciently and our model outperforms the other alternatives in the prediction of time and location of check-ins. CCS Concepts: • Mathematics of computing → Pr obability and statistics ; • Human-centered comput- ing → Social networks ; • Computing methodologies → Machine learning ; Additional K ey W ords and Phrases: Spatio-temporal, location-based social networks, foursquare, check-in, stochastic point process, inuence network, periodic pattern, probabilistic model, EM algorithm A CM Reference format: Ali Zarezade, Sina Jafarzadeh, and Hamid R. Rabiee. 2017. Spatio- T emporal Modeling of Users’ Check-ins in Location-Based Social Networks. ACM Trans. Knowl. Discov . Data. 9, 4, Article 39 (March 2017), 17 pages. DOI: 0000001.0000001 1 INTRODUCTION The advances in location-acquisition techniques and the proliferation of mobile devices have generated an enormous amount of spatial and temp oral data of users activities [ 54 ]. People can upload a ge otagged vide o, photo or text to social networks like Faceb ook and T witter , share their present location on Foursquare or share their trav el route using GPS trajectories to GeoLife [ 49 ]. A considerable amount of this spatio-temporal data is generated by the activity of users in location-based social networks (LBSN). In a typical LBSN, like Foursquar e, users share the time and geolocation of their check-ins, comment ab out it, or unlock badges by exploring new venues. Many techniques have been proposed for processing, managing, and mining the traje ctory data in the past decade [ 55 ]. Several other studies tr y to leverage the spatial data in recommender systems [ 23 ]. Ho wever , a few w orks hav e attempted to model the spatio-temp oral behavior of users in LBSNs [ 5 , 6 ]. Given the history of users’ check-ins, the goal is to pr edict the time and location of This work is supported by ICT Innovation Center , Department of Computer Engineering, Sharif University of T echnology , T ehran, Iran . Permission to make digital or hard copies of all or part of this work for personal or classroom use is granted without fee provided that copies are not made or distributed for prot or commercial advantage and that copies bear this notice and the full citation on the rst page. Copyrights for components of this work owned by others than the author(s) must be honored. Abstracting with credit is permitted. T o copy otherwise, or republish, to post on servers or to redistribute to lists, requires prior specic permission and /or a fee. Request permissions from permissions@acm.org. © 2017 Copyright held by the owner/author(s). Publication rights licensed to A CM. 1556-4681/2017/3-ART39 $15.00 DOI: 0000001.0000001 A CM Transactions on Knowledge Discov ery from Data, V ol. 9, No. 4, Article 39. Publication date: March 2017. 39:2 G. Zhou et al. each user’s check-in utilizing a model. This model can also be use d to nd the inuence network between users which made up of their check-ins, dete ct the inuential users and p opular locations, predict the peak hours of a restaurant, recommend a location, and even contr ol the movement of users. In this paper , we propose a probabilistic spatio-temporal generative model for the check-ins of users in location-based social networks, which can be used in predicting the future check-ins of the users, and discovering the latent inuence network. People usually have periodic patterns in their movements [ 5 , 42 , 57 ]. For example, a typical user may check into her oce in the morning and to a nearby restaurant at noon then return home and repeat this behavior in the following days. W e model the time of check-ins of each user with a nov el periodic decaying doubly stochastic point process which leverages the periodicity in the mov ements of users and can also capture any drift in their patterns. T o model the location of che ck-ins we use the fact that users in social media are inuenced by the activities of their friends [ 11 , 16 , 52 ]. If many of your close friends have checke d into a specic restaurant recently , then there is a high probability that you select that r estaurant, next time. W e model the location of check-ins using a time-varying multinomial distribution. In summary , we pr opose: • a periodic point process for modeling the time of users’ check-ins, which captures the periodic behavior in the movement of users, • a time-var ying multinomial distribution for mo deling the location of users’ check-ins, which incorporates the mutually-exciting eect of the friends’ history of che ck-ins, • a scalable inference algorithm based on the EM algorithm to nd the model parameters, which is distributed over users, • a compelling dataset of Foursquar e users’ che ck-ins, curated fr om 12000 active users during three months in the year 2015. 2 PRIOR WORKS Modeling information diusion in social networks has attracted a lot of attentions in recent years [ 9 , 11 , 14 , 17 ]. Given the times that users hav e adopted to a contagion (information, behavior , or meme), the problem is to model the time and the user of next adoption, i.e. , predict the next event. Early methods [ 10 , 14 , 15 ] studied information diusion using a pair-wise probability distribution for each link from node j to i , which is the probability that node i generates an event in time t i due to the event of node j at time t j . These methods overlook the external eects on the generation of events. In addition, they assume that each no de adopts a contagion at most once, i.e. , ev ents are not recurrent. These issues were later addressed in [ 6 , 17 , 20 , 22 , 29 , 40 , 41 , 44 , 51 ], which use p oint processes for the modeling of events. In [ 15 , 22 , 29 , 44 ], cascades are assumed to be independent and are modeled by a special point process, calle d Hawkes [ 19 ]. The independence assumption is removed in [ 41 , 52 ], the y tried to model the correlation between multiple competing or cooperating cascades. Other studies [ 18 , 20 , 21 , 40 , 44 ], use the additional information of the diusion network such as topic of tweets or the community structure to better model the inuence network. Most of the previous w orks studied the information diusion on microblogging netw orks like T witter , whereas we try to model the time and lo cation of users’ check-ins in the lo cation-based networks like Foursquare. The prior works in location-based social networks can be categorized into thr ee groups: location recommendation, trajector y mining and location prediction. The main approaches in location recommendation systems [ 23 ] are: content-base d which uses data from a user’s prole and the features of locations [ 31 , 43 , 45 , 46 ]; link-based, which applies link analysis models like PageRank to identify the experienced users and interesting locations [ 4 , 30 , 38 , 47 , 56 ]; and collaborative A CM Transactions on Knowledge Discov ery from Data, V ol. 9, No. 4, Article 39. Publication date: March 2017. Spatio- T emporal Modeling of Users’ Check-ins in Location-Based So cial Networks 39:3 ltering which infers users’ preferences from their historical b ehavior , like the lo cation history [ 27 , 31 , 37 , 43 , 50 ]. In trajector y data mining, the source of data is usually generated by the GPS. These works include; trajectory pattern mining to nd the next location of an individual [ 5 , 28 , 39 , 53 ], anomaly detection to detect unexpected movement patterns [ 25 , 33 ], and trajectory classication to dierentiate between trajectories of dierent states, such as motions, transportation mo des, and human activities [ 48 ]. A comprehensive re view of these methods can be found in the recent survey [ 55 ]. W e also discriminate our work from location r ecommendation and traje ctory mining methods, because our goal is to model the check-ins of users not to recommend a lo cation or to nd the trajectory patterns of users with the p osition data of their routes. In lo cation prediction, the goal is to pr edict the next location, given the user’s prole data and the history of check-ins [ 13 , 32 , 34 , 51 ]. But these methods do not consider; the relation between friends (using the inuence matrix), aging eect in the histor y of checkins (using decaying kernel), exogenous ee cts on users’ decisions, and periodicity in users’ movement patterns. The most similar works to ours are: [ 6 ], which propose a spatio-temporal model for the interac- tions between a pair of users, but we mo del the che ck-ins of each user not the pair-wise interactions; and [ 32 ] which propose a discriminative method to predict the location of next check-in, but we propose a generative model for the location and time of check-ins. 3 PRELIMINARIES T o model the time of occurrences of a phenomenon, which are called events, we can use point processes on the real line. The phenomena can be, an earthquake [ 36 ], a viral disease [ 2 ] or the spread of information over a network [ 15 ]. The se quence of events, as dene d below , is the realization of a point process. Denition 3.1 (Point Process). Let { t i } i ∈ N be a sequence of non-negative random variables such that ∀ i ∈ N , t i < t i + 1 , then we call { t i } i ∈ N a point process on R , and F t = { t i | i ∈ N , t i < t } as its history or ltration. There are dier ent equivalent descriptions for the point processes such as; sequence of points { t i } , sequence of intervals (duration process) δ t i , counting process N ( t ) , or intensity process λ ( t ) [ 8 ]. In the following, we briey explain each denition. The counting process N ( t ) associated with the point pr ocess { t i } i ∈ N , counts the number of e vents occurred before time t , i.e. , N ( t ) = Í i ∈ N I ( t i < t ) , where I (·) is the indicator function 1 . The duration process δ t i associated with the point process { t i } i ∈ N is dened as ∀ i ∈ N , δ t i = t i − t i − 1 . Finally , the intensity process λ ( t ) is dene d as the expe cted number of events p er units of time, which generally depends on the history: λ ( t | F t ) = lim d t → 0 1 d t E [ N ( t , t + d t ] | F t ] = lim d t → 0 1 d t Pr [ N ( t , t + d t ] > 0 | F t ] where N ( t , s ] : = N ( s ) − N ( t ) . T o evaluate the likelihoo d of a sequence of events, f ( t 1 , t 2 , . . . , t n ) , we can use the chain rule of probability , f ( t 1 , t 2 , · · · , t n ) = Î i f ( t i | t 1: i − 1 ) . Therefore, it suce to describe only the conditionals, which are abbreviated to f ∗ ( t ) . According to the denition of point processes, we can write the probability of occurring the ( n + 1 ) ’th event in time t as: f ∗ ( t ) d t = Pr { N ( t n , t ] = 0 , N ( t , t + d t ] = 1 | t 1: n } . 1 The indicator function I ( x ∈ A ) is 1 if x ∈ A , and is 0 other wise. A CM Transactions on Knowledge Discov ery from Data, V ol. 9, No. 4, Article 39. Publication date: March 2017. 39:4 G. Zhou et al. If we divide both sides of the ab ove equation by 1 − F ∗ ( t ) , where F ∗ (·) is the cdf of f ∗ (·) , then in the limit as d t → 0 , we have: f ∗ ( t ) d t 1 − F ∗ ( t ) = Pr { N ( t n , t ] = 0 , N ( t , t + d t ] = 1 | t 1: n } Pr { N ( t n , t ] = 0 | t 1: n } = Pr { N ( t , t + d t ] = 1 | t 1: n , N ( t n , t ] = 0 } = Pr { N ( t , t + d t ] > 0 | F t } Therefore , according to the denition of intensity , we nd the relation between conditional distri- bution of the time of events and the intensity function as: λ ∗ ( t ) = f ∗ ( t ) 1 − F ∗ ( t ) (1) where we use ∗ superscript to show that a function is dependent on the history . W e can also express the relation of λ ∗ ( t ) and f ∗ ( t ) in the reverse direction [ 1 ]: f ∗ ( t ) = λ ∗ ( t ) exp − ∫ t t n λ ∗ ( s ) d s (2) Now , the cdf can be easily evaluated: F ∗ ( t ) = 1 − exp − ∫ t t n λ ∗ ( s ) d s . (3) A point pr ocess is usually dene d by sp ecifying its conditional distribution f ∗ ( t ) or equivalently its intensity λ ∗ ( t ) . In the simplest case, the intervals δ t i are assumed to be i . i . d . , therefore the process is memoryless, and hence λ ∗ ( t ) = λ ( t ) . The Cox process [ 7 ] is a doubly stochastic point processes, and conditioned on the intensity is a Poisson process [ 24 ]. Hawkes process [ 19 ] is a spe cial type of Cox process, where the intensity is expr essed by the history as: λ ∗ ( t ) = µ + ∫ t −∞ ϕ ( t − τ ) d N ( τ ) = µ + | F t | Õ i = 1 ϕ ( t − t i ) (4) where ϕ ( t ) is the kernel of the Hawkes process that denes the ee ct of past events on the current intensity , and µ is the base intensity . For example , the exponential kernel ϕ ( t ) = exp (− t ) , is used for the modeling of self-exciting events like earthquake [ 36 ]. In general, we have a multivariate process with a counting process vector N ( t ) = [ N 1 ( t ) , · · · , N n ( t )] T and an associated intensity vector λ ∗ ( t ) = [ λ ∗ 1 ( t ) , · · · , λ ∗ n ( t )] T dened as: λ ∗ ( t ) = µ + A ∫ t −∞ Φ ( t − τ ) d N ( τ ) (5) where Φ ( t ) is the matrix of mutual kernels, i.e. , Φ i j ( t ) models the eect of events of counting process N j ( t ) on N i ( t ) , µ = [ µ 1 , · · · , µ n ] T is the base intensity , and A = [ α i j ] is a matrix of mutual-excitation kernels. Often, the point process carries other information than the time of events, which is called mark. For example, the strength of an earthquake can be considered as a mark. The mark m , often a subset of N or R , is associated with each event through the conditional mark pr obability function f ∗ ( m | t ) : λ ∗ ( t , m ) = λ ∗ ( t ) f ∗ ( m | t ) (6) The mutually-exciting property of the Hawkes process makes it a common modeling tool in a variety of applications such as seismology , neurophysiology , epidemiology , reliability , and social network analysis [ 12 , 14 , 15 , 41 ]. A CM Transactions on Knowledge Discov ery from Data, V ol. 9, No. 4, Article 39. Publication date: March 2017. Spatio- T emporal Modeling of Users’ Check-ins in Location-Based So cial Networks 39:5 T able 1. List of symbols. Symbol Description ϕ l Identity of the l ’th location β u T emporal kernel parameter of user u µ u c Base temporal intensity of user u in category c α v u The inuence of users v on u η u c T endency of user u to explores new locations with category c w u c l W eight of lo cation l with category c for user u m c l Overall weight of location l with category c 4 PROBLEM DEFINITION Consider a directe d network G = (V , E ) , with | V | = N users and L locations in C dierent categories. Each user can check-in to a lo cation and inuence her neighbors. W e dene a che ck-in as a 4-tuple ( t , u , c , l ) , which shows the time t that user u check-in to location l with category c . W e observe the sequence of all che ck-ins in the network G , in the time interval [ 0 , T ] . The observation D = {( t i , u i , c i , l i )} K i = 1 , is composed of user’s che ck-ins where t i ∈ [ 0 , T ] , u i ∈ V , c i ∈ { 1 , 2 , . . . , C } and l i ∈ { ϕ 1 , ϕ 2 , . . . , ϕ L } , that ϕ i can be the id or geographical co ordinate of a location. W e use the following notation for the history of check-ins of user u in location l with category c up to time t : D u c l ( t ) = { ( t i , u i , c i , l i ) ∈ D | t i < t , u i = u , c i = c , l i = ϕ l } Moreover , we use the dot notation to represent the union over the dotted variable , e.g. , D u ·· ( t ) represents the e vents of user u , before time t , in any location with any category . Moreover , D ¯ u c · ( t ) represents the ev ents of all users except u , before the time t , in any location with categor y c . Given this observations, we want to infer the latent inuence network, and model the spatio- temporal behavior of users in the location-based so cial networks like Foursquare . In other wor ds, we want to model the location and time of the next check-in of a user , by observing the histor y of the user and her friends. In this paper , we assume that users have a periodic pattern in the time of their check-ins, and are inuenced by the behavior of their friends. Therefore, we model the time of check-ins by a perio dic point process which incorporates the perio dic pattern in the users’ movements, and the location of che ck-ins by a time-dependent multinomial distribution which incorporates the mutually exciting eect of friends. 5 PROPOSED METHOD 5.1 Modeling the Time of Check-ins In every working day , a user may check-in to her oce in the morning then go to a restaurant at noon, and also have a w eekly football practice program. By observing the history of the time of check-ins of a user , if she repeats some patterns recently (within several days), for example take a walk every afternoon, then it is more likely to repeat this pattern shortly in the upcoming days at approximately the same time. It means, there is a p eriodicity in the users’ b ehaviors. Moreover , there maybe also a drift or an addition of a new activity in the user’s behavior , for example, the working hour of her oce may change or there may be a new weekly social gathering. Therefore, we need a perio dic point process to model the time of user’s che ck-ins, which can also adapt to the new users’ check-ins. This is in contrast to the self-e xciting nature of the Hawkes process, which is used to model the diusion of information over a network [ 14 , 15 , 44 ]. W e propose a doubly stochastic point process which is periodic, and also has a diminishing property that enables the pr ocess to change its periodic pattern and adapt to the new behaviors. A CM Transactions on Knowledge Discov ery from Data, V ol. 9, No. 4, Article 39. Publication date: March 2017. 39:6 G. Zhou et al. t λ ( t ) × | | | | τ Fig. 1. An event at time t = 0 triggers a poisson process. The solid curve shows the intensity of the propose d periodic point process with a Gaussian kernel and perio d τ , and the dashed curve shows a Hawkes process with an exponential decaying kernel. The proposed process, is composed of a Poisson process with the base intensity µ , where each event t i of this process triggers a Poisson process with the following intensity: λ t i ( t ) = ∞ Õ k = 1 h ( t − t i − k τ ) д ( k ) (7) where h ( t ) is the kernel of the pr ocess, д ( k ) is a decreasing function to diminish the intensity in the future periods, and the hyper-parameter τ is the period. This intensity is illustrated in Fig. 1 . The self-exciting property of the Hawkes process can b e observed from its exponentially de caying kernel in Fig. 1 . In the Hawkes pr ocess when an event occurs, ther e is a high probability to have events just after it, and this probability decreases exponentially after ward. But in the propose d process, there is a high probability to hav e events in the upcoming periods and this probability also decreases exponentially . According to the superposition theorem [ 24 ], the intensity of the proposed process can be written as follows: λ ∗ ( t ) = µ + | F t | Õ i = 1 λ t i ( t ) = µ + | F t | Õ i = 1 ∞ Õ k = 1 h ( t − t i − k τ ) д ( k ) (8) T o preserve the locality in time, the kernel h ( t ) should have a peak at t = 0 and decay to zero in b oth sides when t → ±∞ . For example, the Gaussian kernel, h ( t ) = exp (− t 2 / 2 σ 2 ) meets this requirements. This model has three main features: (1) Periodic Nature . When an ev ent occurs in time s , then the intensity of events around this time in the upcoming periods, s + k τ , would increase. (2) T emporal Locality . The intensity is high around the p eak of the kernel and drops rapidly in both sides. (3) Adaptability . The peak of the kernel decreases by the increase of k , so the process can adopt its intensity to any new periodic patterns. If we use a truncated Gaussian kernel like h ( t ) = exp (− t 2 / 2 σ 2 ) I (− τ / 2 ≤ t ≤ τ / 2 ) , then we can substantially reduce the complexity of the intensity function. With this kernel we can show that: λ ∗ ( t ) = µ + | F t | Õ i = 1 h ( t − t i − k i τ ) д ( k i ) (9) where k i = b t − t i τ c is the perio d number of which the event in t i aects on the current intensity . W e propose the following point process for the time of che ck-ins of user u in any location with A CM Transactions on Knowledge Discov ery from Data, V ol. 9, No. 4, Article 39. Publication date: March 2017. Spatio- T emporal Modeling of Users’ Check-ins in Location-Based So cial Networks 39:7 category c : λ u ( t , c ) = µ u c + | D u c · ( t ) | Õ i = 1 β u exp − ( t − t i − k i τ ) 2 2 σ 2 exp (− k i ) (10) The rst term, µ u c is the base intensity that mo dels the external eect on user u to generates check-ins with category c , the se cond term is the p eriodic ee ct of the history , β u is the kernel parameter , and τ , σ are hyper-parameters. All parameters of the model are listed in T able 1 . The intuition of this model is that, if a user check-ins frequently , for example in the ”restaurant“ categor y at noon, then with high probability , she will checks in a restaurant at noon in the next day . 5.2 Modeling the Lo cation of Check-ins In this section, we propose a mo del for the location of users’ check-ins, given the histor y of check- ins. W e use the fact that, users in social networks are inuenced by the behavior of their neighbors. Let denote the weight of location l with category c for user u as: w u c l = | D · c l ( t ) | Õ i = 1 α u i u exp (−( t − t i )) (11) which incorporates α u i u , the inuence of user u i on u , and the time of check-ins with an exponen- tially decaying kernel. This kernel diminishes the ee ct of far past che ck-ins, so the model can adopt to any new b ehaviors of the users’ check-ins. Therefore , a location which checked in recently with many or even few but inuential friends would have high weight. W e also dene a weight for the popularity of a location l with categor y c from the perspective of all users: m c l = | D · c l ( t ) | Õ i = 1 exp (−( t − t i )) (12) where the location that is most checked in recently , has the highest weight. When a user decides to check-in for example, at a restaurant, she sele cts a location that herself or her friends have checked in frequently , recently (exploitation eect), and sometimes she check-ins to a new popular restaurant (exploration eect). Therefore, we use the following multinomial conditional distribution to dene the probability that user u check-ins to location ` , given the time t and category c : f u ( ` | c , t ) = L Õ l = 1 w u c l η u c + w u c · δ ϕ l ( ` ) | {z } exploitation + η u c η u c + w u c · G 0 ( ` ) | {z } exploration (13) The Dirac delta function δ ϕ l ( ` ) is 1 if ϕ l = ` , otherwise it is 0 , and the parameter η u c models the inclination of the user to explores new locations. This distribution means that, with probability w u c l /( η u c + w u c · ) the current location would be a previously checked in lo cation ϕ l by the user u or any of her friends (since for non visited locations the weight w u c l is zero), and with probability η u c /( η u c + w u c · ) it would be selected from all locations in the network, with a pr obability that is modeled by the following distribution: G 0 ( ` ) = L Õ l = 1 m c l m c · δ ϕ l ( ` ) (14) A CM Transactions on Knowledge Discov ery from Data, V ol. 9, No. 4, Article 39. Publication date: March 2017. 39:8 G. Zhou et al. ALGORI THM 1: Generative model of the check-ins. Input: N , C , L , all parameters { µ u c , η u c , α u v , β u } , histor y of check-ins. Output: Next check-in ( t i , u i , c i , l i ) . for u = 1 : N do λ u ( t ) = Í c λ u ( t , c ) end λ ( t ) = Í u λ u ( t ) t i ∼ P P ( λ ( t )) u i ∼ Multi ( λ 1 ( t i ) λ ( t i ) , . . . , λ N ( t i ) λ ( t i ) ) c i ∼ Multi ( λ u i ( t i , 1 ) λ u i ( t i ) , . . . , λ u i ( t i , C ) λ u i ( t i ) ) l i ∼ f u i ( ` | c i , t i ) return ( t i , u i , c i , l i ) Where according to the denition of coecient m c l , it assigns more probability to the popular or recently frequently visited locations. The main features of the proposed location model are: (1) Exploitation . The future check-ins of a user are inuenced by the histor y of check-ins of the user and her friends. (2) Exploration . There is a probability that users explore and check into new unseen locations. (3) Adaptability . Using e xponential decaying kernel for the weights, the model can adopt to new patterns in users’ behavior . 5.3 Summary of Generative Model The proposed generative model is summarized in Algorithm 1 . Using the superposition theorem, rst the time t of check-in is sampled fr om the pr oposed periodic point process λ ( t ) = Í u , c λ u ( t , c ) , then the user u which generated this ev ent is selected in proportion to its intensity λ u ( t ) . The category c of the check-in is also selected in proportion to λ u ( t , c ) . Finally , the location l is sampled from the proposed location model. 5.4 Inference W e propose a Bayesian inference algorithm base d on the EM algorithm to nd the model parameters. T o nd the maximum likelihood solution, for each check-in ( t i , u i , c i , l i ) , we dene a latent variable z i as the user that caused u i to che ck into location l i , given the time t i and categor y c i . W e use 1 -of- N coding to represent z i ’s. For notional convenient, lets dene: γ v u c ` = w v u c ` η u c + w u c · I ( v > 0 ) + m c ` η u c m c · ( η u c + w u c · ) I ( v = 0 ) (15) w v u c l = | D v c l ( t ) | Õ i = 1 α v u exp (−( t − t i )) = α v u | D v c l ( t ) | Õ i = 1 exp (−( t − t i )) (16) where γ v u c ` is the contribution or inuence of user v in the che ck-in of user u at location l with category c . Now , we dene: f u i ( l i , z i | t i , c i ) = N Ö v = 0 ( γ v u i c i ` i ) z i v (17) where z i v is the v ’th element of z i , or the index of the user that caused i ’th check-ins. But, v = 0 is not the index of a user , it represents the exploration eect. It can b e veried that marginalizing A CM Transactions on Knowledge Discov ery from Data, V ol. 9, No. 4, Article 39. Publication date: March 2017. Spatio- T emporal Modeling of Users’ Check-ins in Location-Based So cial Networks 39:9 out the z i , Í z i f u i ( l i , z i | t i , c i ) , results in the probability distribution ( 13 ). Now , to evaluate the complete likelihood p ( D , Z | θ ) of the data D and hidden variables Z = { z i } K i = 1 , given the parameters θ = { µ u c , η u c , α u v , β u } , u , v = 1 . . . N and c = 1 . . . C , we use the following proposition. Proposition 5.1 ([ 52 ]). Let N u , u = 1 , 2 , · · · , N be a multivariate marke d point process with the associated intensity λ u ( t ) , and the mark probability f u ( m | t ) . Let D = {( t i , u i , m i )} K i = 1 be a realization of the process over [ 0 , T ] . Then the likelihoo d of D on model N u with parameters θ can b e expressed as follows. p ( D | θ ) = exp − ∫ T 0 N Õ u = 1 λ u ( τ ) d τ ! | D | Ö i = 1 λ u i ( t i ) f u i ( m i | t i ) If w e consider ( c i , l i , z i ) as the mark m i of the process, according to this proposition the complete likelihood of our model is, p ( D , Z | θ ) = exp − ∫ T 0 N Õ u = 1 λ u ( τ ) d τ ! | D | Ö i = 1 λ u i ( t i ) f u i ( c i , l i , z i | t i ) (18) where using Bayes’ rule and Eq. ( 17 ) it can be evaluated as follows. p ( D , Z | θ ) = exp − ∫ T 0 N Õ u = 1 λ u ( τ ) d τ ! | D | Ö i = 1 λ u i ( t i ) f u i ( c i | t i ) f u i ( l i , z i | t i , c i ) = exp − N Õ u = 1 C Õ c = 1 ∫ T 0 λ u ( τ , c ) d τ ! | D | Ö i = 1 λ u i ( t i , c i ) f u i ( l i , z i | t i , c i ) = exp − N Õ u = 1 C Õ c = 1 ∫ T 0 λ u ( τ , c ) d τ ! | D | Ö i = 1 λ u i ( t i , c i ) N Ö v = 0 ( γ v u i c i l i ) z i v T o derive the second line, we use d the superposition theorem, and the fact that the probability of a category , according to our generative model is f u i ( c i | t i ) = λ u i ( t i , c i )/ λ u i ( t i ) . Given the joint distribution of the observed and latent variables p ( D , Z | θ ) , we use EM algorithm to maximize the likelihood function p ( D | θ ) with respe ct to θ . In the E-step we evaluate p ( Z | D , θ ) . Using Bayes’ rule we can write the posterior distribution of the latent variables as, p ( Z | D , θ ) ∝ | D | Ö i = 1 N Ö v = 0 ( γ v u i c i l i ) z i v (19) which factorizes over i , so that z i ’s ar e independent with multinomial distribution and we can write the expected of z i v under this distribution as follows. E [ z i v ] = Í z i v z i v ( γ v u i c i ` i ) z i v Í z i Î N v = 0 ( γ v u i c i ` i ) z i v = γ v u i c i ` i Í N v = 0 γ v u i c i ` i (20) A CM Transactions on Knowledge Discov ery from Data, V ol. 9, No. 4, Article 39. Publication date: March 2017. 39:10 G. Zhou et al. In the M-step we maximize E Z [ ln p (D , Z | θ )] the expected complete log-likelihood, which can b e decomposed to the sum of expe cted log-likelihoods of users E Z u [ ln p (D u , Z u | θ u )] . E Z [ ln p (D , Z | θ )] = − N Õ u = 1 C Õ c = 1 ∫ T 0 λ u ( τ , c ) d τ + | D | Õ i = 1 log λ u i ( t i , c i ) + | D | Õ i = 1 N Õ v = 0 E [ z i v ] log γ v u i c i ` i = Õ u − ∫ T 0 C Õ c = 1 λ u ( τ , c ) d τ + | D u | Õ i = 1 log λ u ( t i , c i ) + | D u | Õ i = 1 N Õ v = 0 E [ z i v ] log γ v u c i ` i ! = Õ u E Z u [ ln p (D u , Z u | θ u )] (21) Where Z u = { z i ∈ Z | u i = u } and θ u = { µ u c , η u c , α u v , β u } , v = 1 · · · N , c = 1 · · · C . Accordingly , the M-step can be decomposed to multiple maximizations over users, which can be done in parallel. The two steps of the EM algorithm can be summarized as follows. E-Step: E [ z i v ] = γ v u i c i ` i Í N v = 0 γ v u i c i ` i M-Step: θ ∗ u = arg max θ u ≥ 0 − ∫ T 0 C Õ c = 1 λ u c ( τ ) d τ + | D u | Õ i = 1 log λ u c i ( t i ) + | D u | Õ i = 1 N Õ v = 0 E [ z i v ] log γ v u c i l i In the following proposition, we prove that the maximization in M-step is concave, so it has a unique and optimal solution. Proposition 5.2. The expected log-likelihood of a user , E Z u [ ln p (D u , Z u | θ u )] as a function of { µ u c , ˜ η u c , ˜ α u v , β u } is concave, where α u v = exp ( ˜ α u v ) and η u c = exp ( ˜ η u c ) . Proof. . A ccording to Eq. ( 21 ) the log-likelihood of user u is: E Z u [ ln p (D u , Z u | θ u )] = − ∫ T 0 C Õ c = 1 λ u ( τ , c ) d τ + | D u | Õ i = 1 log λ u ( t i , c i ) + | D u | Õ i = 1 N Õ v = 0 E [ z i v ] log γ v u c i ` i The rst term is a linear function of { µ u c , β u } , so it is both convex and concave. The second term is the log of a linear function which is concave, according to composition rules [ 3 ]. The third term is composed of log γ v u c i l i , which for v > 0 , log γ v u c i ` i = ˜ α v u − log e ˜ η u c i + | D · c i · ( t ) | Õ j = 1 e ˜ α u j u e −( t − t j ) + const and for v = 0 , log γ v u c i ` i = ˜ η u c i − log e ˜ η u c i + | D · c i · ( t ) | Õ j = 1 e ˜ α u j u e −( t − t j ) + const . In both cases log γ v u c i l i is concave according to Lemma 1 of [ 52 ] which state that logarithm of sum of linear exponentials is convex. So, the ov erall expression is concave. A ctually , we use ˜ η u c , ˜ α u v instead of η u c , α u v in the implementations, and solve the resulting concave optimization. 6 EXPERIMENTS In this section, using both synthetic and real data, w e evaluate the performance of the proposed method. A CM Transactions on Knowledge Discov ery from Data, V ol. 9, No. 4, Article 39. Publication date: March 2017. Spatio- T emporal Modeling of Users’ Check-ins in Location-Based So cial Networks 39:11 # events p er user AvgPredLogLik 0 50 100 150 200 -5.8 -5.6 -5.4 -5.2 # events p er user × 10 − 4 MSE 0 50 100 150 200 2 3 4 5 6 7 Fig. 2. A verage predicted log-likelihood on the test data ( le ), and MSE of the learned parameters ( right ), in the temporal model for the dierent percentages of the train data. 0 50 100 150 200 \# events per user -2.3 -2.2 -2.1 -2 -1.9 -1.8 -1.7 -1.6 AvgPredLogLik Core-periphery Heterophily Hierarc hical Homophily Erdos-Renyi # events p er user AvgPredLogLik 0 50 100 150 200 -2.4 -2.2 -2 -1.8 -1.6 MSE # events p er user 0 50 100 150 200 0 10 20 30 40 Fig. 3. A verage predicted log-likelihood on the test data ( le ), and MSE of the learned parameters ( right ), in the spatial model for the dierent percentages of the train data and various random graph structures. 6.1 Experiments on Synthetic Data 6.1.1 Exp erimental setup. W e experiment with ve random Kronecker networks [ 26 ] with N = 64 no des, namely Core-peripher y , Heterophily , Hierarchical, Homophily , and Erdos-Renyi 2 . W e set the number of categories to C = 4 and consider eight locations in each category . The temporal and spatial model parameters are randomly drawn from the uniform distributions µ u c , η u c ∼ U ( 0 , 0 . 05 ) , α u v ∼ U ( 0 , 0 . 5 ) and β u ∼ U ( 0 , 0 . 1 ) . The period and standard deviation in the temporal model are τ = 12 and σ = 0 . 5 , respectively . W e generate 16000 check-ins from our model, using the Ogata method [ 35 ], and consider the rst 80% of them for the train and the remaining 20% for the test data. Then we learn the model with dierent percentages of the training data, and evaluate the average predicted log-likelihood on the test data ( A vgPredLogLik ) and the mean squared error b etween the estimated and real parameters ( MSE ). The inference algorithm is implemented in parallel for users. All source codes and datasets are available in our git repository 3 . 6.1.2 Results. In Fig. 2 the A vgPredLogLik and MSE of the temporal model is plotte d versus the size of train data, where the average estimation err or decreases to about 7 × 10 − 4 . These measures are also plotted for the spatial model with dierent random network structures in Fig. 3 , given the time of 2 Where the seed matrix parameters are [ 0 . 85 , 0 . 45; 0 . 45 , 0 . 3 ] , [ 0 . 3 , 0 . 89; 0 . 89 , 0 . 3 ] , [ 0 . 9 , 0 . 1; 0 . 1 , 0 . 9 ] , [ 0 . 89 , 0 . 3; 0 . 3 , 0 . 89 ] , and [ 0 . 60 , 0 . 60; 0 . 60 , 0 . 60 ] , respe ctively 3 https://github.com/azarezade/stp A CM Transactions on Knowledge Discov ery from Data, V ol. 9, No. 4, Article 39. Publication date: March 2017. 39:12 G. Zhou et al. EM iteration log MSE 0 10 20 30 40 0 10 20 30 40 Structure recovery AUC # events p er us er 0 50 100 150 0.5 0.55 0.6 0.65 Socia lity ¯ α/ ¯ η 0.001 0.01 0.1 1 10 100 0.3 0.4 0.5 0.6 0.7 0.8 0.9 Fig. 4. A verage predicted log-likelihood in logarithmic scale vs the iterations of EM ( le ), the network structure recovery for dierent percentages of the train data ( middle ), and the eect of spatial parameters on the users’ Sociality ( right ). Interev ent time Probability Pr { ∆ t i ∈ [11 . 5 , 12 . 5] } = 0 . 025 0 10 20 30 40 50 0 0.05 0.1 0.15 Interev ent time Pr { ∆ t i ∈ [11 . 5 , 12 . 5] } = 0 . 097 Probability 0 10 20 30 40 50 0 0.05 0.1 0.15 0.18 Fig. 5. The distribution of interevent in the temporal model with β = 0 ( le ) and β = 1 ( right ). W e can see that increasing β would cause a peak around 12 , which is the period of the simulated events. check-ins. W e can se e that the parameter estimation err or decreases and the average log-likelihood increases as we increase the size of train data, which sho ws the proposed inference algorithm can consistently learn the model parameters with a very small estimation error . Furthermore, in the left of Fig. 4 we sho w that for a xed number of events p er user , increasing the EM iterations would decrease MSE to ab out 0 . 1 . T o investigate the network structure prediction of our model, for each size of the train data, we use a threshold to convert the predicted weighted network ( i.e. , the α i j ’s) to a ( 0 , 1 ) -adjacency matrix and evaluate the percent of recov ered edges to form the ROC curve. Then, we nd the AUC curve, which is illustrated in the middle of Fig. 4 . T o study the eect of model parameters on the users’ behavior , we design two experiments. First, we dene a measure called Sociality . For each user , the Sociality is the percent of check-ins that their location has been previously visited by the user or her friends. According to our spatial model, Eq. ( 13 ), the exploration of users increase as we increase η or decrease α . T o empirically validate this property of our model, in the right of Fig. 3 the box plot of the users’ So ciality is illustrated for dierent parameters. Its average reaches up to 80% when the average ratio of spatial parameters, ¯ α / ¯ η is equal to 100 . It means that, users with high α / η are more aected by their friends. Moreover , to see the eect of temporal model parameters on the check-ins time of users, we plot the distribution of users’ interev ent time (the time dierence between two successive e vents in a specic categor y for each user). Accor ding to Eq. ( 10 ), parameters β and µ regulate the periodicity in the time of ev ents. The higher β , would result in more periodic events. W e x µ and set β = 0 and 1 in the left and right graphs of Fig. 5 , respe ctively . As we see, there is a p eak around 12 in A CM Transactions on Knowledge Discov ery from Data, V ol. 9, No. 4, Article 39. Publication date: March 2017. Spatio- T emporal Modeling of Users’ Check-ins in Location-Based So cial Networks 39:13 F requency Interev ent time (da y) 0 2 4 6 8 10 0 200 400 600 700 Socia lity History time window 0 5 10 20 30 40 50 100 ∞ 0 0.2 0.4 0.6 0.8 1 Fig. 6. The frequency of interevent times in the Food categor y of Foursquare dataset ( le ), and the Sociality box plot of users for dierent history window sizes ( right ). the right graph, which is the perio d of the simulated events but, in the left gure the frequency of events reduces exponentially and there is no peak except the initial one . 6.2 Experiments on Real Data 6.2.1 Dataset preparation. W e used both T witter and Foursquare APIs to crawl the che ck-ins data of the users in Foursquare, be cause Foursquare does not provide the check-ins data. Specically , we crawled the tweets of the users that have installed Swarm application. This app is connected to the T witter and Foursquare account of the user . When a user check-ins, using this app, she can tweet the URL of that lo cation in the Foursquare website. Therefore, we have access to the location details (via Foursquare API) and the time of che ck-ins (via T witter API). Using the T witter search API we found active users with high check-ins rate in Foursquare. By querying the API with “I am at” , the default template of Swarm app for check-ins, we selected the top 12000 users, and crawled their tweets in ten weeks during the year 2015 . W e pruned the data by sele cting 1000 active users that were in the same countr y (Brazil), to better see the inuence of users on each other . The average degree of the network is 6 . 4 . The total number of check-ins is ab out 60000 . The number of unique locations is ab out 10000 in 10 categories. 6.2.2 Exp erimental setup. W e use the rst eight weeks of the check-ins as the train data, and the remaining two weeks as the test data. The hyp er-parameters of the temporal mo del are set to τ = 24 and σ = 1 , by cross validation. W e learn model parameters by the train data and use dierent temporal and spatial measures for the evaluations. W e compare our proposed mo del with MultiHawkes [ 44 ] where the intensity of user’s check-ins is mo deled by a multivariate Hawkes process (the intensity depends on the user and her friends’ histor y), and Hawkes where the intensity , that is modeled by a Hawkes process, dep ends only on the user’s histor y . The spatial model is also compared with two competing metho ds. In the MostPopular method the most che cked in lo cations, disregarding the time of check-ins, are more probable to be selected as the next check-in location. The PeriodicLoc model assumes perio dicity in the location of che ck-ins, the locations that are more checked in previous periods are more probable to be visited in the current time. 6.2.3 Results. T o rev eal the motivation of the proposed method, we perform two empirical experiments on the real data. In summar y , Fig. 6 shows that: (i) most of the events are repeated after one, or more days (since there are peaks in the left graph at 1 , 2 , 3 , . . . ), which veries the use of a periodic point process for modeling the time of users’ check-ins; (ii) about 80% of users are aecte d by their friend’s location of check-ins ( blue b ox plot) which justies the use of the A CM Transactions on Knowledge Discov ery from Data, V ol. 9, No. 4, Article 39. Publication date: March 2017. 39:14 G. Zhou et al. 0 2 4 6 8 10 12 Interevent threshold ( hr ) 0 10 20 30 40 50 60 Event prediction accuracy Our Hawks MultiHa wkes Event prediction accuracy Interev ent thres hold (hr) 0 1 2 3 4 0 10 20 30 Mean interevent thresho ld (hr) Number o f users 6 7 8 9 10 11 12 10 30 50 70 90 110 # weeks CPU time (sec) × 10 3 2 4 6 8 0 2 4 6 8 Fig. 7. The percent of check-ins which their times are closer than a threshold to the real time ( le ). The number of users which their average distance of predicted check-in times to the real times ar e less than a threshold ( middle ). The time complexity of dierent temporal models ( right ). 0 5 10 15 20 25 30 35 40 k 0.05 0.1 0.15 0.2 0.25 0.3 Accuracy@k Our MostPopular Pe ri o di cL o c Accuracy@k k 10 20 30 40 0.05 0.1 0.15 0.2 0.25 0.3 k NDCG@k 10 20 30 40 0.07 0.09 0.11 0.13 0.15 0.17 Fig. 8. The accuracy ( le ) and NDCG ( right ) of location prediction, given the times of che ck-ins, at dierent values of k . proposed mutually-exciting spatial model; (iii) only 10% of users explor e new locations (red box plot), which these users are modeled by the parameter η in Eq. ( 13 ); (iv) as w e more increase the size of the history time window , the less Sociality increases, which validates the use of the exponential decaying kernel in Eq. ( 11 ) to reduce the eect of far past histor y . T o evaluate the prediction accuracy of check-in times we design two experiments. For each test event we estimate the time of the next event by dierent methods. The percent of check-ins which their times are closer than a threshold to the real time is plotted in the left graph of Fig. 7 . Our method achieved up to 35% improv ement for a 1 hr threshold compared to other methods. In the middle graph, the numb er of users where the average distance of their estimated events is less than a threshold is plotted. The proposed method performe d up to 20% better than the competing methods. W e did not plot this graph for the thresholds less than 6 hr , where all methods perform poorly . Finally , the right graph of Fig. 7 shows that the time complexity of our method is near the fastest method. Now , given the time of check-ins, we evaluate the prediction accuracy of the location of check-ins. For each test event, each method assigns a probability to each location, forming a v ector and sele cts the most probable location. Accuracy @ k is the percent of events that the true location is among the rst k high probable locations, and NDCG @ k is 1 N Í N i = 1 I ( 1 + r ( e i ) < k )/ log 2 ( r ( e i )) , where r ( e i ) is the (one-based) rank of the r eal location of i ’th check-in in the location probability vector . These A CM Transactions on Knowledge Discov ery from Data, V ol. 9, No. 4, Article 39. Publication date: March 2017. Spatio- T emporal Modeling of Users’ Check-ins in Location-Based So cial Networks 39:15 measures are plotted in Fig. 8 . For k = 1 the accuracy increase from ∼ 7% in other methods to ∼ 11% in our method 4 —about 43% improvement. For larger values of k the measure is less reliable, since all method would have the same accuracy . Our method arrived at 24% accuracy , and about 8% improvement at k = 40 . But in the NDCG which dose not have the mentioned undesirable eect (since the low-rank events are more signicant) w e see our method consistently outperform the others—about 30 - 50% improvement for the dierent values of k . 7 CONCLUSION T o model the check-ins of users in location-based so cial networks, we proposed a periodic point process for the time of check-ins, which leverages the periodicity in users’ behavior , and a multi- nomial distribution for the location of check-ins, which leverages the mutually-exciting eect of friends on the decision of users. The synthetic experiments show the proposed inference algorithm can learn the model parameters with high accuracy and its performance increases by the size of train data. Moreov er , we study the eect of mo del parameters on the users’ check-ins, from which one can interpret the users’ behavior in LSBNs from their inferr ed parameters. The real experiments on the curated Foursquare check-ins dataset, show the proposed method outperform the other competing methods in the time and location prediction of users’ future check-ins. Specically , we achie ved up to 35% in the time prediction and 43% in the location pr ediction accuracy . Furthermore, the empirical studies sho w the real data meets the assumptions of the pr oposed model that is, users are periodic in the time and mutually-exciting in the location of their checkins. Our work also opens many interesting v enues for future works. For example, w e can consider the home location of the users in dening the probability of the location of their check-ins, by modifying the weight of locations in Eq. ( 11 ). In addition, we can investigate the utilization of a non-parametric spatial model instead of the multinomial distribution. Finally , we can use the proposed model to control the check-in behavior of users by incentivization. REFERENCES [1] Odd Aalen, Ornulf Borgan, and Hakon Gjessing. 2008. Sur vival and event history analysis: a process point of view . Springer Science & Business Media. [2] Albert Laszlo Barabasi. 2015. Network Science . Cambridge university press. [3] Stephen Boy d and Lieven V andenberghe. 2004. Convex optimization . Cambridge university press. [4] Xin Cao, Gao Cong, and Christian S Jensen. 2010. Mining signicant semantic locations from GPS data. Proceedings of the VLDB Endowment 3, 1-2 (2010), 1009–1020. [5] Eunjoon Cho, Seth A Myers, and Jure Leskovec. 2011. Friendship and mobility: user movement in lo cation-based social networks. In Proceedings of the 17th ACM SIGKDD international conference on Knowledge discovery and data mining . A CM, 1082–1090. [6] Y oon-Sik Cho, Aram Galstyan, P . Jer ey Brantingham, and George Tita. 2014. Latent self-exciting point process model for spatial-temporal networks. Discrete and Continuous Dynamical Systems - Series B 19, 5 (2014), 1335–1354. [7] David Roxbee Cox and V alerie Isham. 1980. Point processes . V ol. 12. CRC Press. [8] D.J. Daley and D V ere-Jones. 2002. An Introduction to the Theory of Point Processes - V ol. I . Springer Ser . Statist., Springer , New Y ork. [9] Nan Du, Hanjun Dai, Rakshit T rivedi, Utkarsh Upadhyay , Manuel Gomez-Rodriguez, and Le Song. 2016. Recurrent marked temporal point processes: Embe dding event history to vector . KDD. ACM (2016). [10] Nan Du, Le Song, Ming Y uan, and Alex J Smola. 2012. Learning networks of heterogeneous inuence. In A dvances in Neural Information Processing Systems . 2780–2788. [11] Mehrdad Farajtabar , Nan Du, Manuel Gomez-Rodriguez, Isabel V alera, Hongyuan Zha, and Le Song. 2014. Shaping social activity by incentivizing users. In Advances in neural information processing systems . 2474–2482. 4 It should be noted that there are about 10,000 locations and the random guess has extremely low accuracy . A CM Transactions on Knowledge Discov ery from Data, V ol. 9, No. 4, Article 39. Publication date: March 2017. 39:16 G. Zhou et al. [12] Mehrdad Farajtabar , Manuel Gomez-Rodriguez, Nan Du, Mohammad Zamani, Hongyuan Zha, and Le Song. 2015. Back to the Past: Source Identication in Diusion Networks from Partially Observed Cascades. arXiv:1501.06582 (2015). [13] João Bártolo Gomes, Clifton Phua, and Shonali Krishnaswamy . 2013. Where will you go? mobile data mining for next place prediction. In International Conference on Data W arehousing and Knowledge Discovery . Springer , 146–158. [14] Manuel Gomez-Rodriguez, David Balduzzi, and Bernhar d Schölkopf. 2011. Uncovering the T emporal Dynamics of Diusion Networks. In Proceedings of the 28th International Conference on Machine Learning (ICML’11) . 561–568. [15] Manuel Gomez-Rodriguez, Jure Leskov ec, and Bernhard Schölkopf. 2013. Modeling Information Propagation with Survival Theor y . In Proce edings of The 30th International Conference on Machine Learning (ICML’13) . 666–674. [16] Manuel Gomez-Ro driguez, Le Song, Hadi Daneshmand, and B Schoelkopf. 2015. Estimating diusion networks: Recovery conditions, sample complexity & soft-thresholding algorithm. Journal of Machine Learning Research (2015). [17] Manuel Gomez-Rodriguez, Le Song, Nan Du, Hongyuan Zha, and Bernhard Schölkopf. 2016. Inuence Estimation and Maximization in Continuous- Time Diusion Networks. A CM Transactions on Information Systems (TOIS) 34, 2 (2016), 9. [18] Huan Gui, Yizhou Sun, Jiawei Han, and George Brova. 2014. Modeling topic diusion in multi-relational bibliographic information networks. In Proce edings of the 23rd A CM International Conference on Conference on Information and Knowledge Management . ACM, 649–658. [19] Alan G Hawkes. 1971. Spe ctra of some self-exciting and mutually exciting point processes. Biometrika 58, 1 (1971), 83–90. [20] Xinran He, Theodoros Rekatsinas, James Foulds, Lise Getoor , and Y an Liu. 2015. Hawkestopic: A joint model for network inference and topic modeling from text-based cascades. In Proc. 32nd Intl. Conf. on Machine Learning . [21] Seyed Abbas Hosseini, Ali Khodadadi, Soheil Arabzade, and Hamid R Rabiee. 2016. HNP3: A Hierarchical Nonparametric Point Process for Modeling Content Diusion over Social Media. In Data Mining (ICDM), 2016 IEEE International Conference on . IEEE. [22] T omoharu Iwata, Amar Shah, and Zoubin Ghahramani. 2013. Discovering latent inuence in online social activities via shared cascade poisson processes. In Proceedings of the 19th ACM SIGKDD international conference on Knowledge discovery and data mining . ACM, 266–274. [23] David Wilkie Mohamed F. Mokbel Jie Bao, Y u Zheng. 2014. Recommendations in Location-based Social Networks: A Survey . GeoInformatica 19 (November 2014), 525–565. [24] John Frank Charles Kingman. 1992. Poisson processes . Oxford university press. [25] Jae-Gil Lee, Jiawei Han, and Xiaolei Li. 2008. Trajectory outlier detection: A partition-and-detect framework. In 2008 IEEE 24th International Conference on Data Engineering . IEEE, 140–149. [26] Jure Leskovec, Deepayan Chakrabarti, Jon Kleinberg, Christos Faloutsos, and Zoubin Ghahramani. 2010. Kronecker graphs: An approach to modeling networks. The Journal of Machine Learning Research 11 (2010), 985–1042. [27] Justin J Levandoski, Mohame d Sar wat, Ahme d Eldaw y , and Mohamed F Mokbel. 2012. LARS: A lo cation-aware recommender system. In 2012 IEEE 28th International Conference on Data Engineering . IEEE, 450–461. [28] Moshe Lichman and Padhraic Smyth. 2014. Modeling human location data with mixtures of kernel densities. In Proceedings of the 20th ACM SIGKDD international conference on Knowledge discovery and data mining . ACM, 35–44. [29] Scott W Linderman and Ryan P Adams. 2014. Discovering Latent Network Structure in Point Process Data.. In ICML . 1413–1421. [30] Bin Liu, Y anjie Fu, Zijun Y ao, and Hui Xiong. 2013. Learning geographical preferences for point-of-interest r ecommen- dation. In Proceedings of the 19th A CM SIGKDD international conference on Knowledge discovery and data mining . ACM, 1043–1051. [31] Bin Liu and Hui Xiong. Point-of-Interest Recommendation in Location Based Social Networks with T opic and Location A wareness. In Proceedings of the 2013 SIAM International Conference on Data Mining . SIAM, 396–404. [32] Qiang Liu, Shu Wu, Liang W ang, and Tieniu T an. 2016. Predicting the Next Location: A Recurrent Model with Spatial and T emp oral Contexts. In Thirtieth AAAI Conference on Articial Intelligence . [33] Siyuan Liu, Lionel M Ni, and Ramayya Krishnan. 2014. Fraud detection from taxis’ driving behaviors. IEEE Transactions on V ehicular T echnology 63, 1 (2014), 464–472. [34] Eric Malmi, Trinh Minh Tri Do , and Daniel Gatica-Perez. 2013. From Foursquare to My Squar e: Learning Check-in Behavior from Multiple Sources.. In ICWSM . [35] Y osihiko Ogata. 1981. On Lewis’ simulation method for point processes. Information Theor y , IEEE Transactions on 27, 1 (1981), 23–31. [36] Y osihiko Ogata. 1988. Statistical models for earthquake occurrences and residual analysis for point processes. Journal of the A merican Statistical association 83, 401 (1988), 9–27. [37] Y ong Ge R. H. Huayu Li and H. Zhu. 2016. Point-of-interest recommendations: Learning potential check-ins from friends. In Proceedings of the 22th ACM SIGKDD international conference on on Knowledge discovery and data mining . A CM Transactions on Knowledge Discov ery from Data, V ol. 9, No. 4, Article 39. Publication date: March 2017. Spatio- T emporal Modeling of Users’ Check-ins in Location-Based So cial Networks 39:17 A CM. [38] Salvatore Scellato, Anastasios Noulas, and Ce cilia Mascolo. 2011. Exploiting place features in link prediction on location-based social networks. In Proceedings of the 17th ACM SIGKDD international conference on Knowledge discovery and data mining . ACM, 1046–1054. [39] Lu- An T ang, Y u Zheng, Jing Y uan, Jiawei Han, Alice Leung, Chih-Chieh Hung, and W en-Chih Peng. 2012. On discovery of traveling companions from streaming trajectories. In 2012 IEEE 28th International Conference on Data Engineering . IEEE, 186–197. [40] Long Tran, Mehrdad Farajtabar , Le Song, and Hongyuan Zha. 2015. NetCodec: Community Detection from Individual Activities. In SIAM International Conference on Data Mining (SDM) . SIAM. [41] Isabel V alera and Manuel Gomez-Rodriguez. 2015. Modeling adoption and usage of competing products. In Data Mining (ICDM), 2015 IEEE International Conference on . IEEE, 409–418. [42] Matthew James Williams. 2013. Periodic patterns in human mobility . Ph.D. Dissertation. Cardi University . [43] Xiangye Xiao, Y u Zheng, Qiong Luo, and Xing Xie. 2014. Inferring social ties between users with human location history . Journal of A mbient Intelligence and Humanize d Computing 5, 1 (2014), 3–19. [44] Shuang Hong Y ang and Hongyuan Zha. 2013. Mixture of mutually exciting pr ocesses for viral diusion. In Proceedings of the 30th International Conference on Machine Learning (ICML’13) . 1–9. [45] Mao Y e, Dong Shou, W ang-Chien Lee, Peifeng Yin, and Krzysztof Janowicz. 2011. On the semantic annotation of places in location-based social networks. In Proceedings of the 17th ACM SIGKDD international conference on Knowledge discovery and data mining . ACM, 520–528. [46] Josh Jia-Ching Ying, Eric Hsueh-Chan Lu, W ang-Chien Lee, Tz-Chiao W eng, and Vincent S T seng. 2010. Mining user similarity from semantic trajectories. In Proceedings of the 2nd ACM SIGSP A TIAL International W orkshop on Location Based Social Networks . ACM, 19–26. [47] Hyoseok Y oon, Yu Zheng, Xing Xie, and W oontack W oo. 2010. Smart itinerary recommendation based on user- generated GPS trajectories. In International Conference on Ubiquitous Intelligence and Computing . Springer , 19–34. [48] Longhao W ang Xing Xie Y u Zheng, Like Liu. 2008. Learning Transportation Mode from Raw GPS Data for Geographic Application on the W eb. In WW W . [49] W ei- Ying Ma Y u Zheng, Xing Xie. 2010. GeoLife: A Collaborative Social Networking Service among User , Location and Trajectory . IEEE Data(base) Engineering Bulletin 33, 2 (2010), 32–39. [50] Quan Y uan, Gao Cong, Zongyang Ma, Aixin Sun, and Nadia Magnenat Thalmann. 2013. Time-aware point-of-interest recommendation. In Proce edings of the 36th international ACM SIGIR conference on Research and development in information retrieval . A CM, 363–372. [51] Quan Y uan, Gao Cong, Zongyang Ma, Aixin Sun, and Nadia Magnenat Thalmann. 2013. Who, where, when and what: discover spatio-temporal topics for twitter users. In Proceedings of the 19th ACM SIGKDD international conference on Knowledge discovery and data mining . ACM, 605–613. [52] Ali Zarezade, Ali Khodadadi, Mehr dad Farajtabar , Hamid R Rabiee, and Hongyuan Zha. 2016. Correlated Cascades: Compete or Cooperate. In Thirty-First AAAI Conference on A rticial Intelligence . [53] Kai Zheng, Y u Zheng, Nicholas J Yuan, Shuo Shang, and Xiaofang Zhou. 2014. Online discovery of gathering patterns over trajectories. IEEE Transactions on Knowledge and Data Engine ering 26, 8 (2014), 1974–1988. [54] Y u Zheng. 2011. Location-based social networks: Users. Computing with Spatial Trajectories, Yu Zheng and Xiaofang Zhou, Eds . Springer . [55] Y u Zheng. 2015. Trajectory Data Mining: An O verview . ACM Transaction on Intelligent Systems and T echnology (September 2015). [56] Y u Zheng, Lizhu Zhang, Xing Xie, and W ei- Ying Ma. 2009. Mining interesting locations and travel sequences from GPS trajectories. In Proceedings of the 18th international conference on W orld wide web . ACM, 791–800. [57] Jiawei Han Roland K ays Peter Nye Zhenhui Li, Bolin Ding. 2010. Mining periodic behaviors for moving objects. In Proceedings of the 16th ACM SIGKDD International Conference on Knowledge Discovery and Data Mining (KDD 2010) . A CM, 1099–1108. Received March 2017 A CM Transactions on Knowledge Discov ery from Data, V ol. 9, No. 4, Article 39. Publication date: March 2017.
Original Paper
Loading high-quality paper...
Comments & Academic Discussion
Loading comments...
Leave a Comment