Classifiers for centrality determination in proton-nucleus and nucleus-nucleus collisions
Centrality, as a geometrical property of the collision, is crucial for the physical interpretation of nucleus-nucleus and proton-nucleus experimental data. However, it cannot be directly accessed in event-by-event data analysis. Common methods for ce…
Authors: Igor Altsybeev, Vladimir Kovalenko
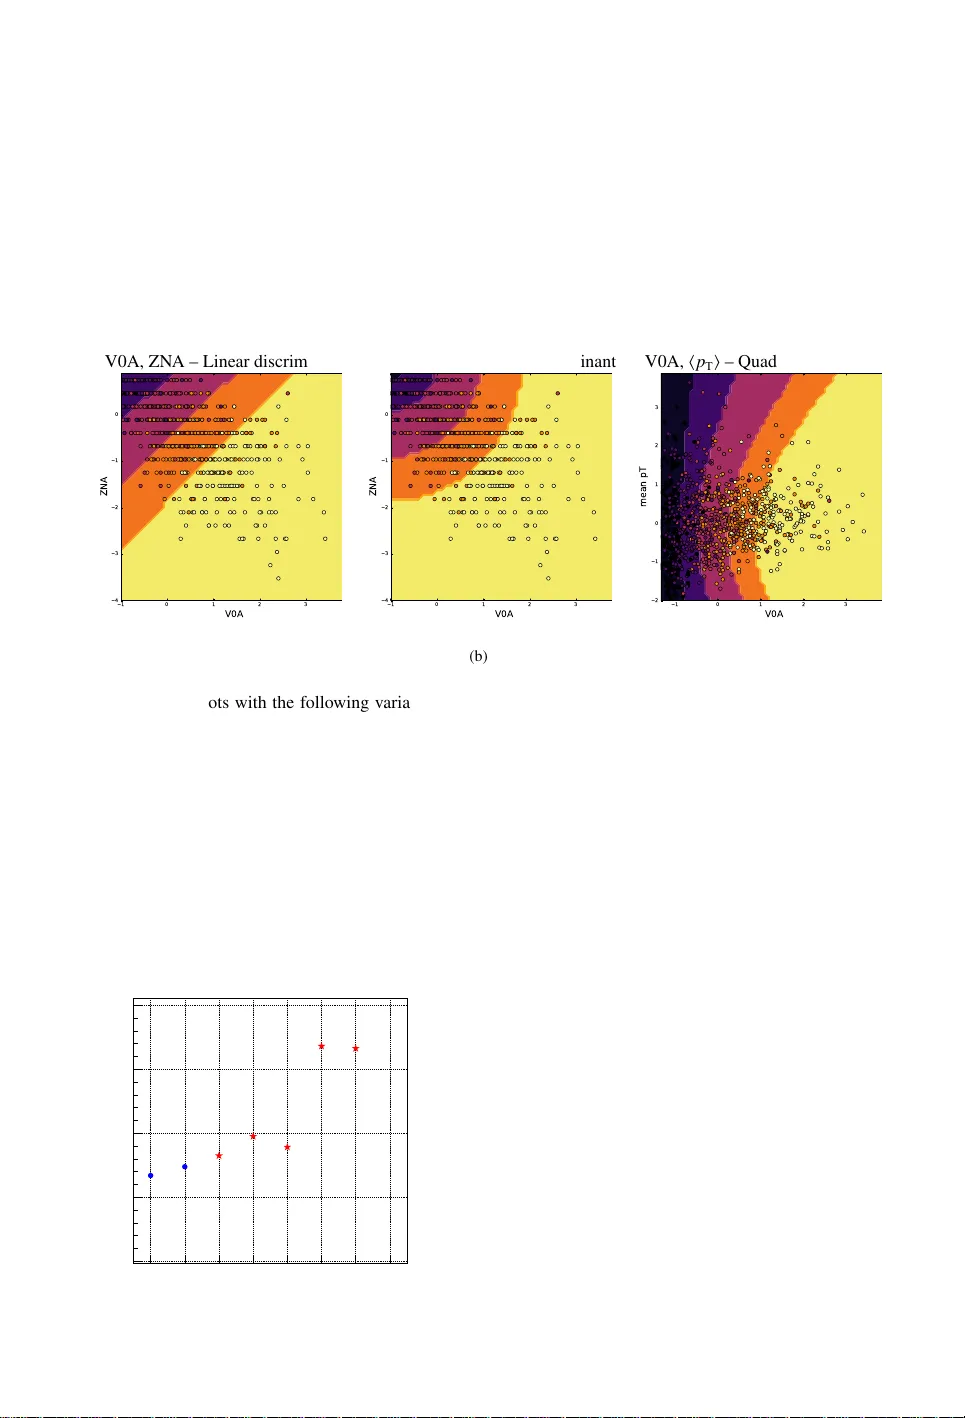
Classifiers f or centrality determination in pr oton-nuc leus and nuc leus-n uc leus collisions Igor Altsybee v 1 , a and Vladimir K o valenk o 1 , b 1 Saint-P etersb urg State University , 7/9 Universitetska ya nab ., St. P etersburg, 199034 Russia Abstract. Centrality , as a geometrical property of the collision, is crucial for the physical interpretation of nucleus-nucleus and proton-nucleus experimental data. Howe ver , it can- not be directly accessed in ev ent-by-event data analysis. Common methods for centrality estimation in A-A and p-A collisions usually rely on a single detector (either on the signal in zero-degree calorimeters or on the multiplicity in some semi-central rapidity range). In the present work, we made an attempt to de velop an approach for centrality determina- tion that is based on machine-learning techniques and utilizes information from se veral detector subsystems simultaneously . Di ff erent event classifiers are suggested and ev alu- ated for their selectivity power in terms of the number of nucleons-participants and the impact parameter of the collision. Finer centrality resolution may allo w to reduce impact from so-called volume fluctuations on physical observables being studied in heavy-ion experiments like ALICE at the LHC and fix ed target experiment N A61 / SHINE on SPS. 1 Introduction Machine-learning (ML) techniques have been used in High-Energy Physics (HEP) so far in a limited number of ways. The most common application of the ML is a search for rare processes (for example, boosted decision trees were used in searches for B 0 s → µ + µ − decay [1]). Another use case is a trigger optimization [2]. In experiments dedicated to studies of hea vy-ion collisions, like ALICE at the LHC, ML is used mainly for detector response optimization, as described in overvie w [3]. F or example, the Bayesian approach is used to more e ff ectiv ely combine the particle identification capabilities of various detectors [4]. It is interesting to find new applications of ML for physics analysis in experiments of heavy-ion collisions. In the present work, we tried to address the task of the centrality determination. The centrality is a ke y parameter in the study of the properties of QCD matter at extreme temperature and energy density , because it is directly related to the initial overlap region of the colliding nuclei [5]. The centrality is usually expressed as a percentage of the total nuclear interaction cross section σ : c = R b 0 d σ d x d x , where impact parameter ( b ) is the distance between the centers of the two colliding nuclei. T aking the full impact parameter range as 0-100%, peripheral collisions ha ve centrality closer to 100%, while the most central ev ents are close to 0%. a e-mail: i.altsybeev@spbu.ru b e-mail: v .kovalenk o@spbu.ru Impact parameter b is not directly accessible in experiment. In order to obtain estimation of cen- trality experimentally , a signal distribution in some detecting system is usually used: the distribution is di vided into centrality classes , which are then related to some interval of the impact parameter, with some estimated resolution. T o make this relation, the geometrical Glauber model [6] is usually used, which treats a nuclear collision as a superposition of binary nucleon-nucleon interactions. A nucleon that undergoes one or more collisions with nucleons of the other nucleus, is usually called a partic- ipant nucleon . The volume of the initial overlap region is e xpressed via the number of participant nucleons N part . A number of binary nucleon-nucleon collisions is usually denoted as N coll . A number of spectator nucleons N spec constitutes the part of the nuclear volume not in v olved in the interaction. Any increase in centrality resolution would be beneficial for certain types of physics analysis. For example, higher centrality resolution is desirable in class 0-1% of Pb-Pb collisions to select the most central ev ents, where double-peaked structure was observed in azimuthal profile of two-particle correlation function [7]. The present exploratory w ork is dedicated to ML-based task for centrality determination. The aim is to select “centrality classes” with improved resolution in terms of the impact parameter b in Pb- Pb and N part in p-Pb collisions using signals from several subsystems of the detector simultaneously . The task is performed using simulated e vents. Dealing with detector-induced losses in e ffi ciency , contamination by secondary particles and application of this technique to real data are out of the scope of this article. 2 Centrality determination in ALICE experiment In the ALICE experimental setup [8], the most commonly used detecting system for centrality de- termination is a pair of so-called VZERO detectors, two forward scintillator arrays with coverage − 3 . 7 < η < − 1 . 7 (VZERO-C) and 2 . 8 < η < 5 . 1 (VZERO-A). Since these are non-tracking detectors, signal in each VZER O is proportional to char ged particle multiplicity of primary tracks and secondary tracks from weak decays and detector material. The summed signal in both VZERO scintillators is usually denoted as V0M. Distribution of the V0M amplitude sho wn in figure 1 (a) is fitted with the (a) (b) Figure 1. (a): Distrib ution of the sum of amplitudes in the VZERO scintillators (V0M). The distribution is fitted with the NBD-Glauber fit shown as a line, obtained centrality classes are indicated. (b): Spectator energy deposited in the ZDCs as a function of ZEM amplitude [5]. Glauber model coupled with ne gative binomial distrib ution (NBD), and di vided into centrality classes [5]. V alues of N part and N coll in each centrality class are extracted from the fit. Another set of detectors used for centrality determination are the Zero-Degree Calorimeters (ZDC) placed at ≈ ± 110 m in the LHC tunnel. The energy deposited in the ZDCs is directly related to the number of spectator nucleons N spec . Combining signal from ZDCs with the energy measured by small EM calorimeters (ZEM) placed at A-side of ALICE at 4 . 8 < η < 5 . 7, a two-dimensional distribution can be plotted (figure 1, b). The centrality classes are determined from this plot by splitting it with lines, which are assumed to intersect at some common point [5]. Charged primary particles are reconstructed in ALICE with the central barrel detectors combining information from the Inner Tracking System (ITS) and the Time Projection Chamber (TPC). The TPC, together with the ITS, pro vides charged particle momentum measurement, particle identification and vertex determination. Both detectors are located inside the 0.5 T solenoidal field and hav e full azimuthal cov erage for track reconstruction within a pseudo-rapidity window of | η | < 0 . 8. 3 ML task for sim ulated Pb-Pb events in the conditions of ALICE experiment The AMPT Monte Carlo event generator [9] was used to simulate Pb-Pb collisions at √ s NN = 2 . 76 T eV . The simulation contains no detector response, so “signals” of the real detector were em- ulated directly by taking generated particles in certain areas of the phase space. Fiv e main features were selected for the ML task in correspondence with the subsystems of the ALICE detector (figure 2). These are multiplicities of charged particles obtained in AMPT simulation within acceptances of each of the VZERO scintillators (A, C) and the TPC, and also numbers of neutrons-spectators, which in the “ideal world" would be measured in each of the ZDCs (A and C). Also, three additional features were introduced in order to study their importance for improvement of the final centrality res- olution: av erage transverse momentum of particles in the TPC within each e vent ( h p T i ), kaon-to-pion (K /π ) and proton-to-pion (p /π ) ratios in each e vent. These observ ables are kno wn to be dependent on centrality of heavy-ion collisions and possibly possess some discriminati ve po wer . Figure 2. Detecting systems, from which fiv e features for the ML task were taken: multiplicities in acceptances of VZER O-A, C, TPC, and numbers of nucleons-spectators in each of two ZDCs. 3.1 Regression task It is interesting to find out whether we ha ve some improvement in centrality resolution if, instead of V0M, we perform e vent selection for centrality classes using ML regressor . T o perform ML re gression task for centrality determination, TMV A package [10] of v ersion 4.2.0 was used. For this task, a feature set of five variables, described abov e, was taken, with the impact parameter b as a target for regression. Among sev eral probed regressors, good performance was obtained, in particular , with a Boosted Decision Tree with gradient boosting (denoted as BDTG), results from which are used here for illustration. Booking in TMV A was done with the following line: factory->BookMethod( TMVA::Types::kBDT, "BDTG", "!H:!V:NTrees=2000::BoostType=Grad: Shrinkage=0.1:UseBaggedBoost:BaggedSampleFraction=0.5:nCuts=20:MaxDepth=3:MaxDepth=4"); T o focus on more central collisions, e vents for the analysis were preselected using V0M estimator to be within 0-10% centrality class (see centrality classes in figure 1, a). This preselected set contains 400k of e vents, and it was randomly split into two halv es: 200k ev ents for training and 200k for testing. Distribution of the truth impact parameter b in e vents, preselected by V0M, is sho wn in figure 3 as a blue shaded area. Output from BDTG regressor , which is a distribution of estimated values of b , is shown on the same plot in red. It is “squeezed" from both left and right sides, demonstrating inability of the regressor to reach left and right e xtremes of the truth distribution. Figure 3. Distribution of impact parameter b for events in 0-10% centrality class preselected by simulated V0M signal (wide distribution, sho wn in blue). Output from BDTG regressor with impact parameter b as a target is narrower and is shown in red. In order to use BDTG regressor as another (alternativ e) centrality estimator , its output was split into “centrality bins” in the same manner as it is done for con ventional V0M distribution (recall figure 1, a). T o compare performance of the new BDTG estimator with the V0M in terms of impact parameter resolution, outputs from both estimators were split into 10 centrality bins (this was done for 0-10% preselected by V0M ev ents, so obtained classes are of 1% width). Figure 4 shows truth (a) (b) (c) Figure 4. Distributions of impact parameter within centrality classes 0-1, 1-2 and 2-3% selected by V0M and BDTG estimators (color code is di ff erent from figure 3). For comparison, grey distrib utions show slices of 1% width when slicing into centrality classes is done by truth b itself. impact parameter distributions for e vents within 0-1%, 1-2% and 2-3% centrality classes selected by V0M (in blue) and selected using new BDTG estimator (in red). It can be seen that when selection is done with the BDTG estimator , distributions of b are narro wer than with V0M selection, which means higher resolution in terms of b . Also, in most central 0-1% e vent class selected with the BDTG estimator , the b -distribution goes closer tow ards b = 0 (figure 4, a), indicating that within this class we indeed select more central ev ents than with V0M. The same information is summarized in figure 5, where each colored region cov ers the mean values of b distributions ± their RMS in centrality classes of 1%-width in 0-10% range: the red area stands for centrality selection by the BDTG estimator , and it is narrower than the green area for selection using V0M, especially for the most central events. For comparison, the blue area is for the case when slicing into centrality classes is done by truth b itself. Event class (%) 0 1 2 3 4 5 6 7 RMS), fm ± (mean true b 0 0.5 1 1.5 2 2.5 3 3.5 4 4.5 V0M BDTG true b Figure 5. Mean ± RMS of impact parameter b distributions for e vents within centrality classes of 1% width, which are selected using simulated multiplicity distribution in V0M acceptance (in green) and BDTG (in red) estimators. Blue area covers mean ± RMS of b distributions, when slicing into centrality classes is done by truth b itself. 3.2 Classification task for the most central e vents In this section, centrality determination task is considered as a classification problem. Namely , within 0-10% class of e vents, preselected with simulated multiplicity distribution in VZERO acceptance, the most central 0-1% ev ents (with b impact < 1 . 5 fm) are considered as a signal, all other ev ents – as a background. Purity is defined as a fraction of e vents, selected by classifier , for which impact parameter is indeed < 1 . 5 fm. The challenge is to increase the purity of 0-1% selected events. The same set of fiv e descriminating features was used. Figure 6 (a) shows signal e ffi ciency v s background rejection for a large set of classifiers, probed using TMV A package. It can be seen, that, except for simple cut-based classifiers, all estimators pro- vide similar performance, with slightly better results for neural networks (MLP) and boosted decision trees. Pad (b) of the same figure presents purity in terms of impact parameter in 0-1% centrality class. The purity le vel of ≈ 0.53 (red star on the plot) is obtained for e vents with con ventional V0M selec- tion, while best ML classifiers show values ≈ 0.66, showing increase in purity by about 13%. This increase is expected since classifiers use information from 5 distinct detecting systems, not just from two VZER O scintillators. The same classification task was repeated with an extended set of variables (three additional fea- tures, mentioned in section 3, are e vent-a verage transverse momentum h p T i , K /π and p /π ratios). Feature importance histogram is sho wn in figure 7, it can be seen that the additional features do not contribute to performance improv ement much. Of course, dependence of the results on h p T i and particle ratios strongly depend the ev ent generator used for the study , so these features may still be interesting if this approach will be applied to real data. (a) MLPBNN BDTG MLP BoostedFisher FisherG BDT Fisher KNN LikelihoodPCA LD Likelihood V0M purity 0.5 0.55 0.6 0.65 0.7 (b) Figure 6. (a): Signal e ffi ciency v s background rejection for a set of classifiers (TMV A). (b): Purities reached with classifiers in 0-1% centrality class in terms of impact parameter . Red star is for purity of 0-1% event class with V0M selection. Figure 7. Feature importance for BDTG in classification task for selection of ev ents in 0-1% centrality class. 4 ML task for sim ulated p-Pb events In proton-nucleus collisions, observed multiplicities and other phenomena are much stronger corre- lated with N part than in Pb-Pb collisions, while the impact parameter b is only loosely correlated to N part . Therefore, N part is a more reliable target for machine-learning classification challenge for p-Pb collisions than b . Let us split truth N part distribution and the output from some trained ML estimator into 5 classes 0-20, 20-40, 40-60, 60-80, 80-100% (0-20% – for the most central events). Let us also state ML classification task for p-Pb collisions as follo ws: what is the purity of 0-20% class selected by ML estimator? In other words, what is the fraction of events, selected by estimator, which indeed belong to the truth 0-20% class of the highest values of N part ? Scikit-learn package [11] was used for this task. Training and testing were done using 5 mln simulated AMPT e vents of p-Pb collisions. Again, charged particles for analysis were taken directly from the generator, without simulation of the detector response. At first, only two features were used in the task, which correspond to “measurements” in Pb-fragmentation direction: multiplicity in VZER O-A scintillator (denoted here as V0A) and number of neutrons-spectators in ZDC-A (denoted as ZN A). Figure 8 (a) is a two-dimensional plot, where scattered points visualize signals in these two detectors (a small part of the whole generated event-sample is shown), and decision boundaries, obtained after training of linear discriminant classifier, which drawn by colored areas. Similar plot is in pad (b) for quadratic discriminant classifier . Note that decision boundaries between centrality classes are not dra wn by hand, as in ZEM-ZDC histogram from figure 1 (b), b ut instead are calculated as optimal borders between classes. In the last pad (c) in figure 8, the boundaries are sho wn for two another features taken for the classification task – multiplicity in VZER O-A and averaged momentum h p T i of particles in TPC. − 1 0 1 2 3 V 0 A − 4 − 3 − 2 − 1 0 Z N A V0A, ZN A – Linear discriminant (a) − 1 0 1 2 3 V 0 A − 4 − 3 − 2 − 1 0 Z N A V0A, ZN A – Quadr . discriminant (b) − 1 0 1 2 3 V 0 A − 2 − 1 0 1 2 3 m e a n p T V0A, h p T i – Quadr . discriminant (c) Figure 8. 2D plots with the following v ariables on axes: V0A and ZN A in pads (a, b) and V0A and h p T i in pad (c). Features are standardized (centered to the mean and scaled to unit variance). Scattered points represent a small fraction of the whole statistics. Decision boundaries are drawn for five centrality classes determined by classifiers: by linear disriminant (a) and by quadratic discriminant (b, c). What are the purities of classification with di ff erent combination of features? For figure 9, the quadratic discriminant was taken as a classifier . Blue circles indicate purity in 0-20% class of ev ents selected by only one feature: V0A (first point) or ZN A (second point), giving similar v alues ≈ 0.72. For each of the next three points, one additional feature was included in ML task, namely , mean momentum h p T i or multiplicity within TPC. It can be seen, that both these additional features are V0A ZNA ZNA_meanPt V0A_meanPt V0A_multTPC V0A_ZNA V0A_ZNA_meanPt purity 0.65 0.7 0.75 0.8 0.85 Quadratic Discriminant Figure 9. Purity in 0-20% centrality class with Quadratic discriminant classifier , for several combinations of features. weak and provide minimal increase in purity , by ∼ 2-3%. At the same time, when two strong features V0A and ZN A are combined, purity rises by 10% to ≈ 0.82. A similar beha viour of the purity is obtained for sev eral other classifiers – k nearest neighbours ( k NN) with di ff erent number of k and for the linear discriminant, see figure 10 (a). Pad (b) of this figure shows purities of 0-20% class obtained by using single-feature classification (blue circles) in comparison with the best ML result with many features (red star). KNN5 KNN10 KNN20 KNN40 KNN100 KNN200 KNN500 LDA QDA purity 0.7 0.75 0.8 0.85 0.9 V0A, V0C V0A, V0C, multTPC V0A, V0C, multTPC, ZNA V0A, V0C, multTPC, ZNA, meanPt (a) meanPt V0C multTPC V0A ZNA ML BEST purity 0 0.2 0.4 0.6 0.8 1 (b) Figure 10. (a): Purities of 0-20% centrality class, reached with k NN, LD A and QDA classifiers for several feature configurations. (b): Purities obtained with single-feature classification, in comparison with best ML result with many features. 5 P ossible application of ML estimators in NA61/SHINE e xperiment ML-based classifiers can potentially be useful for centrality estimation in fixed target experiments, such as N A61 / SHINE experiment at CERN [13]. In that e xperiment, the Projectile Spectator Detector (PSD) has a modular structure shown in figure 11 and measures the energy of projectile spectators in A-A collisions. Centrality is determined by energy in modules of PSD. Possible improvement can be achiev ed if the PSD is used in combination with data from se veral TPC’ s, and the machine-learning techniques can be applied for that. Moreov er, it may be useful to utilize energy deposition in the PSD module-by-module, and try to benefit from all intrinsic correlations between modules. Unfortunately , training of ML estimators requires very robust MC simulations of the PSD. Situation is complicated by the fact that modules in the PSD are fired not only by spectators, b ut also by particles born in A-A collision. Possibly , methods of unsupervised learning could be adopted for this challenge. Figure 11. Modular structure of the Projectile Spectator Detector of the N A61 / SHINE facility [13] . 6 Conclusions Accurate centrality determination is a baseline for many physics analyses in heavy-ion collision ex- periments, for e xample, for fluctuations and correlations studies of A-A and p-A collisions. In the presented e xploratory work, we tried to increase resolution of centrality classes in terms of the impact parameter b and the number of nucleons-participants by using machine-learning techniques, which utilizes signals from sev eral detector subsystems simultaneously . Compared with con ventional cen- trality estimators, ML-based estimators allo w increasing the resolution and thus the “purity” of cen- trality classes without losses in statistics (i.e., each centrality class contains the same number of ev ents, but with higher purity). It could be seen that impro vement in centrality resolution was achie ved espe- cially for the most central e vents, with increase in purity ∼ 10-13% compared to conv entional centrality selection methods. If centrality selection is performed using cuts on the signal from a single detecting system, results are obviously worse than if combination of signals from several subdetectors is used. At the same time, simultaneous usage of just two “strong” features may be already enough to significantly increase the purity of centrality class, while additional “weak” features provide very moderate improvement. ML classifiers allo w to draw optimized decision boundaries between centrality classes, and obtained boundaries can have non-trivial shapes. It can be especially useful in a multidimensional case when more than two features are used, which would make manual parameterization of decision boundaries very challenging. Since the presented work is based on simulations, e ffi cienc y of the “detectors” is taken to be unity and contamination by secondary particles is zero, which makes some features unrealistically strong. For instance, the “ZDC”, used in this study , ideally counts all the neutrons-spectators, which is not the case at all in a real e xperiment (real ZDC usually has a finite resolution, it loses some neutrons due to combination of spectators into nuclei fragments, and su ff ers from contamination by non-spectators). Additionally , there was no attempt made to incorporate intrinsic correlations between selected features, while these correlations are highly dependent on the physics model of the chosen e vent generator . Also, no attempt w as made to train and use ML-based estimators for centrality selection in real data, since it is not easy at all to tune event generator and simulated detector response to match data from real detector . Application of the ML-based centrality estimators to real data needs further in vestigation. 7 Ackno wledgements. This work is supported by the Russian Science Foundation, GRANT 16-12-10176. References [1] CMS and LHCb Collaborations, Nature 522 , 68-72 (2015) [2] T . Likhomanenk o et al. , J. Phys.: Conf. Ser . 664 , 082025 (2015) [3] M. Floris, DataScience@LHC2015 W orkshop (report), http: // indico.cern.ch / e vent / 395374 / contributions / 939892 / (2015) [4] J. Adam et al. (ALICE Collaboration), Eur . Phys. J. Plus 131 168 (2016) [5] B. Abelev et al. (ALICE Collaboration), Phys. Rev . C 88 , 044909 (2013) [6] M. Miller et al. , Ann. Rev . Nucl. P art. Sci. 57 , 205 (2007) [7] K. Aamodt et al. (ALICE Collaboration), Physics Letters B 708 , 249-264 (2012) [8] B. Abelev et al. (ALICE Collaboration), Int. J. Mod. Phys. A 29 , 1430044 (2014) [9] Zi-W ei Lin et al. , Phys.Rev . C 72 , 064901 (2005) [10] A. Hoecker et al. , PoS A CA T 040 (2007) [11] F . Pedregosa et al. , JMLR 12 , 2825-2830 (2011) [12] J. Adam et al. (ALICE Collaboration), Phys. Rev . C 91 , 064905 (2015) [13] N.Abgrall et al. (N A61 / SHINE Collaboration), JINST 9 , P06005 (2014)
Original Paper
Loading high-quality paper...
Comments & Academic Discussion
Loading comments...
Leave a Comment