Predicting Student Dropout in Higher Education
Each year, roughly 30% of first-year students at US baccalaureate institutions do not return for their second year and over $9 billion is spent educating these students. Yet, little quantitative research has analyzed the causes and possible remedies …
Authors: Lovenoor Aulck, Nishant Velagapudi, Joshua Blumenstock
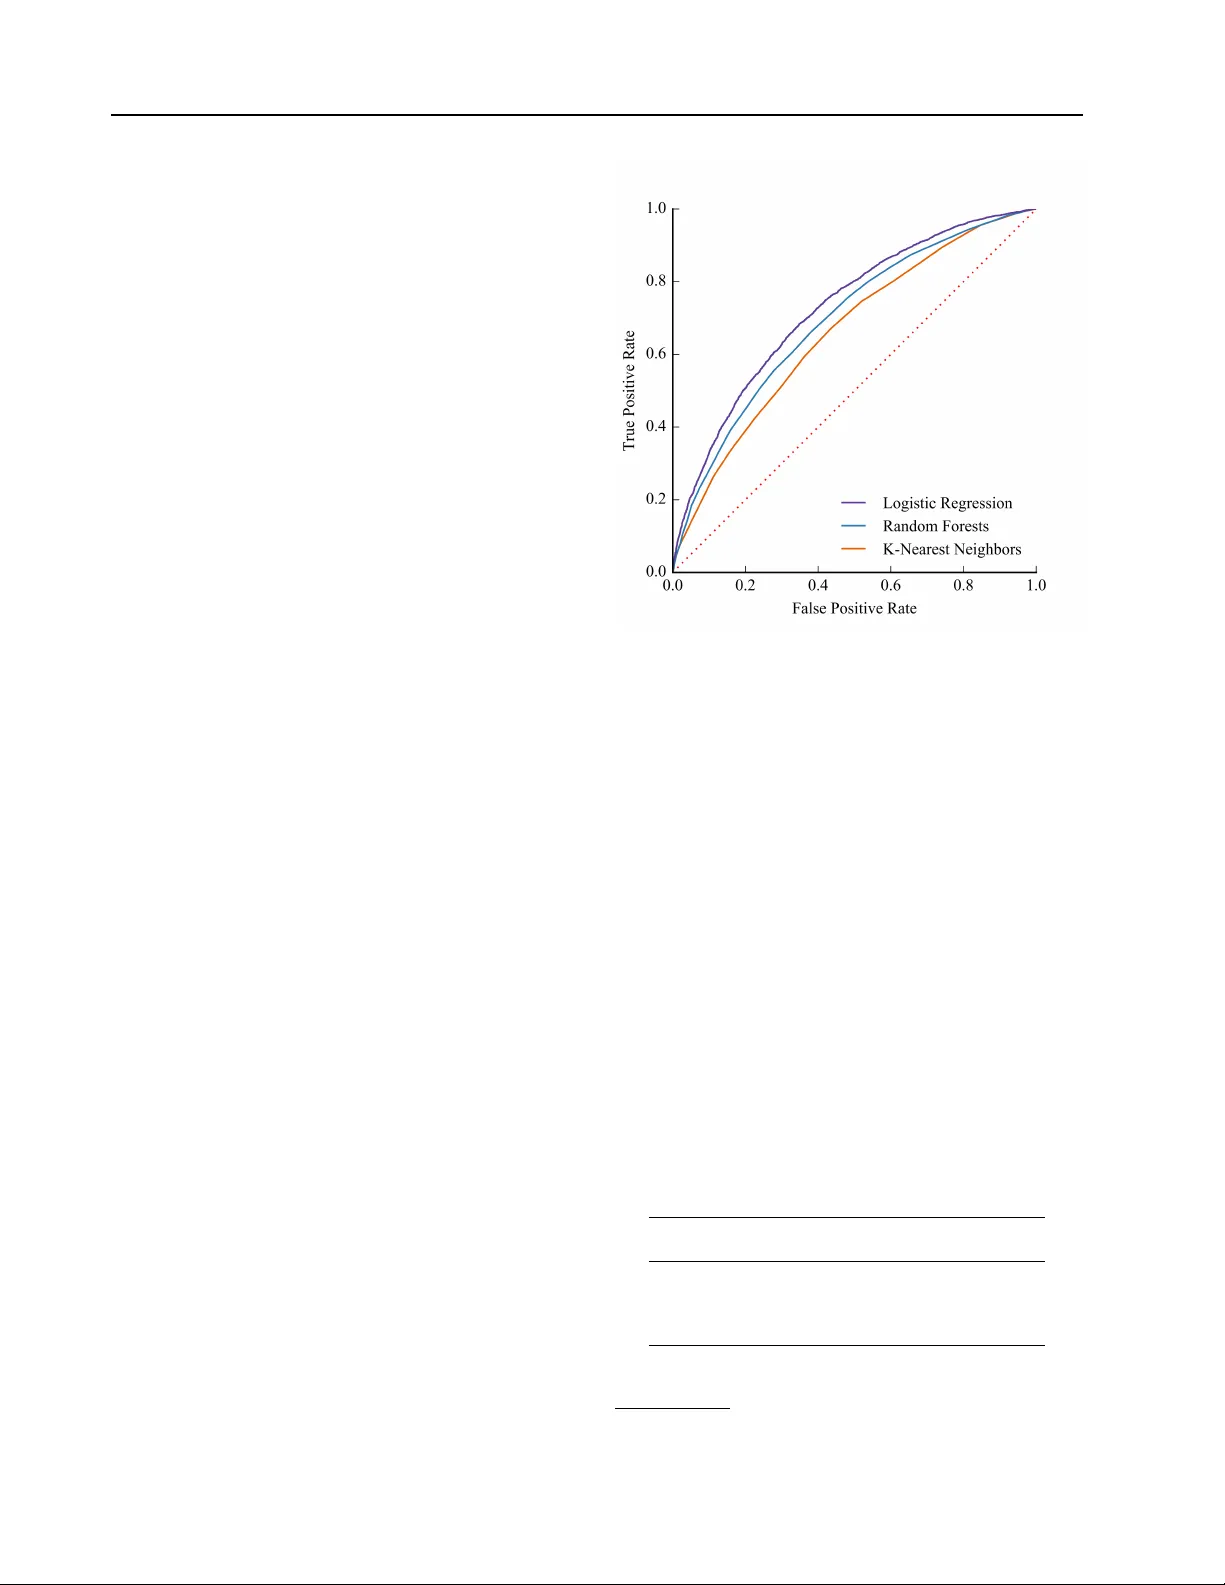
Pr edicting Student Dr opout in Higher Education Lovenoor A ulck L AU L C K @ U W . E D U Nishant V elagapudi N I S H R A Y @ U W . E D U Joshua Blumenstock J O S H B L U M @ U W . E D U Je vin W est J E V I N W @ U W . E D U DataLab, The Information School, Univ ersity of W ashington, Seattle, W A 98195, USA Abstract Each year , roughly 30% of first-year students at US baccalaureate institutions do not return for their second year and ov er $9 billion is spent educating these students. Y et, little quantitative research has analyzed the causes and possible remedies for student attrition. Here, we de- scribe initial efforts to model student dropout using the largest known dataset on higher ed- ucation attrition, which tracks ov er 32,500 stu- dents’ demographics and transcript records at one of the nation’ s largest public univ ersities. Our results highlight sev eral early indicators of student attrition and show that dropout can be accurately predicted even when predictions are based on a single term of academic transcript data. These results highlight the potential for machine learning to hav e an impact on student retention and success while pointing to sev eral promising directions for future work. 1. Introduction Student dropout is a major concern in the education and policy-making communities ( Demetriou & Schmitz- Sciborski , 2011 ; Tinto , 2006 ). About 40% of students seeking bachelor’ s degrees do not complete their degree within 6 years ( NCES , 2015 ) with uni v ersities losing tens of billions of dollars in re venue each year ( Raisman , 2013 ). First-year student attrition is of particular importance, as United States (US) state and federal gov ernments spent ov er $9 billion from 2003-2008 on educating the 30% of full-time first-year students seeking baccalaureate degrees who do not return for a second year ( Schneider , 2010 ). Much of the groundwork for theories on student post- 2016 ICML W orkshop on #Data4Good: Machine Learning in Social Good Applications , Ne w Y ork, NY , USA. Cop yright by the author(s). secondary attrition was laid in the 1970s-1980s with the work of Tinto ( 1975 ; 1987 ), Spady ( 1970 ), and Bean ( 1980 ), to name a few . Despite long-standing theory , student drop out continues to be a large concern to the ed- ucation community and policy makers as attriting students lose time and effort in their f ailed pursuits while institutions hav e no recourse to recoup the scarce resources they dev oted to the students. In recent years, the rise of massi ve online open courses (MOOCs) and other online educational en vironments has seen an increase in the application of data mining and machine learning techniques to educational data, particularly in the domains of educational data mining and learning analytics ( Baker & Y acef , 2009 ; Siemens & Long , 2011 ; Siemens & Baker , 2012 ; Romero & V entura , 2013 ; Baker & In ventado , 2014 ). Howev er , in part due to the lack of appropriate data, much less quantitativ e research has focused on student dropout in the traditional classroom en vironment. Here, we model student dropout using data gathered from the registrar databases of a large, publicly-funded, four- year univ ersity in the US. T o our knowledge, this is the largest dataset used to study student attrition at scale. Our broader objectiv e is to understand the key determinants of dropout, to accurately identify students likely to attrite, and to recommend policy interventions to reduce student attrition. In this workshop paper, we focus on results from our initial attempts to predict student dropout using demographic information as well as transcript records from the student’ s first academic term at the university . Our work relates to recent ef forts to analyze student dropout in small, homogeneous populations. For instance, Dekker et al. use a host of machine learning approaches to predict student drop out among a group of 648 students in the Electrical Engineering department at the Eindhoven Univ ersity of T echnology using the first semester’ s grades ( 2009 ). K ov a ˘ ci ´ c use tree-based learning methods while focusing on feature selection to conduct a similar analysis within the Open Polytechnic of New Zealand, relying on socio-demographic features of 453 students ( 2010 ). 16 Predicting Student Dr opout in Higher Education Moseley and Mead, meanwhile, use rule induction to predict dropout at the course le vel among 528 nursing students ( 2008 ). Lin et al. rely on neural networks to model retention in engineering with 1,508 students ( 2009 ). Most closely related to our work, Delen and Thammasiri use machine learning techniques to predict whether freshmen will enroll for a second term (not their e v entual graduation) ( Delen , 2011 ; Thammasiri et al. , 2014 ). While promising, most of these pre vious studies hav e focused on subsets of very homogeneous students in particular fields of study . Our approach, by contrast, considers an extremely heterogeneous population at one of the nation’ s largest public uni v ersities. 2. Methods 2.1. Data De-identified, psuedonymized data were g athered from the Univ ersity of W ashington’ s (UW) registrar databases in the summer of 2013. The data contain the demographic information (race, gender , birth date, resident status, and identification as Hispanic), pre-college entry information (SA T and A CT scores, if a v ailable), and complete transcript records (classes taken, time at which they were taken, grades receiv ed, and majors declared) for all students in the University of W ashington (UW) system (consisting of a main campus at Seattle and two satellite campuses: Bothell and T acoma). Our focus is on matriculated undergraduate students at the main campus who first enrolled between 1998 and 2006. The year 2006 was used as an upper bound to allow for 6 full years to graduate from the time of first enrollment. In all, this was 69,116 students. Of these 69,116, 5 students did not hav e birth years av ailable and were consequently excluded from the analysis. The ov erall graduation rate in this dataset was about 76.5% based on the definition of non-completion (NC) presented in Section 2.2 . W e randomly sampled from the majority class to create a balanced dataset consisting of 32,538 students for this preliminary work. In all, about half the data was comprised of freshmen entrants, while transfers from 2-year colleges and transfers from 4-year colleges each comprised about one-quarter of the dataset. An ov ervie w of the demographics and graduation rates across those demographic groups are presented in T able 1 . 2.2. Defining Non-Completion Students who dropped out (non-completions or NCs) are defined as those students who did not complete at least one under graduate de gree within 6 calendar years of first enrollment. In the dataset, this consisted of a single, binary outcome feature. The UW uses a quarter-based system of enrollment and this 6-year time to completion translated to 24 calendar quarters after the quarter of first enrollment. T able 1. Demographics in (balanced) dataset G R A D S N C S G R A D R A T E A L L 1 6 , 2 6 9 1 6 , 2 6 9 5 0 . 0 0 % Gender F E M A L ES 8 , 7 9 0 8 , 1 3 4 5 1 . 9 4 % M A L E S 7 , 4 6 2 8 , 1 2 9 4 7 . 8 6 % O T H E R / U N K NO W N 1 7 6 7 3 . 9 1 % Pr evious Schooling F R E S H ME N 8 , 6 8 5 7 , 4 8 8 5 3 . 7 0 % T R A N S . F R O M 2 - Y R 4 , 12 5 4 , 1 6 2 4 9 . 7 8 % T R A N S . F R O M 4 - Y R 3 , 45 9 4 , 6 1 9 4 2 . 8 2 % Race/Ethnicity A F R . A M E R I C AN 4 3 9 6 4 2 4 0 . 6 1 % A M E R . I N D I A N 1 9 6 3 2 2 3 7 . 8 4 % A S I A N 3 , 8 4 3 3 , 5 7 1 5 1 . 8 3 % C AU C A S I AN 9 , 3 1 7 9 , 1 5 5 5 0 . 4 4 % H AW A I I A N / P A C . I S . 8 9 1 4 2 3 8 . 5 3 % O T H E R / U N K NO W N 2 , 3 8 5 2 , 4 3 7 4 9 . 4 6 % Hispanic H I S P A N I C 6 5 7 8 2 1 4 4 . 4 5 % N OT H I S P A N I C 1 5 , 6 1 2 1 5 , 4 4 8 5 0 . 2 6 % Residency Status R E S I D EN T 1 4 , 5 3 3 1 4 , 1 1 6 5 0 . 7 3 % N O N - R ES I D E N T 1 , 7 3 6 2 , 1 5 3 4 4 . 6 4 % Enrollment in this case was defined as when a student receiv ed at least one transcript grade (re gardless of whether it is numeric or passing) for a term. T ransfer students’ time in the uni versity system was accounted for by dividing the number of credits transferred to the uni versity by the number of credits needed per quarter to graduate in 12 quarters (i.e. 4 years without taking summer classes). 2.3. Featur e Mapping Race, gender , and resident status were cate gorical variables where each student only belonged to a single category and the inclusion in cate gories was mutually exclusiv e across variables. Each possible race (6 total), gender (3 total), and resident status (7 total but grouped in T able 1) were mapped across dummy variables. SA T and A CT scores, meanwhile, were only a v ailable for 40% and 12% of the data, respectively . T o impute missing SA T and A CT scores, we used a linear regression model with other demographic and pre-college entry data. W e also used mean imputation for these missing v alues and obtained results similar to those presented. The top 150 most frequently declared majors during the 17 Predicting Student Dr opout in Higher Education first term were similarly mapped across dummy vari- ables. Each department in which students took classes was mapped across four features for each student: a binary variable indicating whether the student took a class in that department, a count of the number of credits taken in that department by the student, a count of the number of classes taken in that department by the student, and the grade point av erage (GP A) of the student for all graded classes taken in that department. This resulted in 784 additional features. The same four categories of features were also used to look at “gatekeeper” classes in science, technology , engineering, and math (STEM) fields, namely: entry-le vel physics, chemistry , biology , and math classes, which are typically taken as year-long sequences. Indicators of whether the student took remedial classes during the first term or were part of a first-year interest group (FIG) 1 were also included. It should be noted that we did not have any information regarding students’ financial standing or history , though we understand this to be a large part of the motiv ation behind students’ decisions to stop their studies ( Cabrera et al. , 1992 ). 2.4. Experiments Below , we report results from three machine learning mod- els (regularized logistic regression, k-nearest neighbors, and random forests) to predict the binary dropout variable on the features described in Section 2.3 . In all experiments, we report measures of performance on a 30% random sample of test data, which is not used in cross-validation or model selection. W ith the remaining 70% of the data, we use 10-fold cross-validation to tune the model parameters (e.g. the regularization strength for logistic regression, the number of neighbors in kNN, and the depth of the tree in random forests). W e are also interested in understanding which elements in a student’ s data are the best predictors of dropout. For this, we run k separate logistic re gressions of dropout on the k th feature, trained on the training set, and with performance calculated on the test data. Finally , we use a regularized linear regression to predict the number of terms each non- completing student enrolled in before dropping out. K-fold cross validation was used to determine the regularization strength of the model. As before, we randomly sample 70% of the data (in this case, all non-completions) to tune the regularization parameter and performance is reported on the remaining 30% of the data. Figure 1. R OC curves 3. Results 3.1. Predicting dr opout Receiv er operating characteristic (R OC) curves for each of the three models are sho wn in Figure 1 . The prediction accuracies and A UC for the R OC curves are shown in T able 2 . Performance was comparable across models (A UC between 0.66 and 0.73), with modest gains in the case of logistic regression. As we discuss below , while we believ e these initial results indicate a strong signal in the transcript data for predicting student dropout, we vie w them as relativ ely nai ve baselines to be improv ed upon in future work. In particular , we are acti vely exploring alternativ e approaches to the learning task (e.g., neural and spectral methods). T able 2. Prediction Accuracy and R OC for Models M O D E L A C C U R AC Y AU C L O G I S TI C R E G R E S S IO N 6 6 . 5 9 % 0 . 7 2 9 R A N D O M F O R E ST S 6 2 . 2 4 % 0 . 6 9 4 K - N E A RE S T N E I G H B OR S 64 . 6 0 % 0 . 6 6 0 1 For more information, see here 18 Predicting Student Dr opout in Higher Education 3.2. Correlates of Dr opout Examining individual features reveals sev eral interesting trends. Firstly , GP A in math, English, chemistry , and psychology classes were among the strongest individual predictors of student retention. From preliminary analysis of our data, we know that baccalaureate transfers tend to graduate at much lower rates than their peers in our dataset ( Aulck & W est , 2016 ). As such, indicators of students’ pre vious schooling were also among those with the highest performance. Interestingly , birth year was also a strong predictor of e ventual attrition as was the year of first enrollment. This is reflectiv e of the fact that our data exhibits a declining ov erall trend in attrition across time, with overall attrition rates at 27.6% for the 1998 entering class and 20.2% for the 2006 entering class. Interestingly , the first quarter in which a student enrolled (e.g. Autumn, W inter , Spring, or Summer) was also a strong predictor of attrition. In all, ho we ver , no single feature yielded a predictiv e accuracy higher than 54%. The 7 features with the highest predictiv e performance in isolation are shown in T able 3 . T able 3. Features with Highest Predictiv e Performance F E A T UR E A C C U R AC Y AU C G P A I N M ATH C L A S S E S 5 2 . 9 5 % 0 . 5 7 1 G P A I N E N G L I S H C L A S S E S 5 3 . 0 0 % 0 . 5 6 7 F I R S T Q T R . O F E N RO L L M E N T 5 3 . 4 9 % 0 . 5 4 9 G P A I N C H E M I S T RY C L A S S E S 5 1 . 7 9 % 0 . 5 4 9 F I R S T Y E A R O F E N R OL L M E N T 5 3 . 5 8% 0. 5 4 7 B I RT H Y E A R 5 3 . 4 9 % 0 . 5 4 5 G P A I N P S Y C H O L O G Y C L A S SE S 5 3 . 4 9 % 0 . 5 4 1 3.3. Timing of Dr opout Finally , we were sensitiv e to the fact that univ ersity ad- ministrators are eager to know not just who is likely to drop-out or factors likely to influence student attrition, but also when at-risk students are most likely to attrite. Thus, in addition to predicting student attrition, we also sought to predict when a non-completion would ev entually stop pursuing their degree using a single term’ s data. This yielded marginally successful results. W e obtained a root mean squared error (RMSE) value of 5.03 quarters when using data on all non-completions. When excluding the bottom 5% and 10% of least accurate predictions, RMSE was 4.14 and 3.74 quarters, respectively . On av erage, non- completions enrolled in 7.35 (SD: ± 5.65) quarters before stopping their studies. 4. Future Dir ections The early-stage results described abov e point to several promising directions for future work. First, we are extend- ing our analysis to the full dataset and to other univ ersities, including dealing with issues related to class imbalances ( Thammasiri et al. , 2014 ). W e also intend to expand our analysis beyond the first term’ s transcript data and take a more comprehensive look at the processes of attrition. Doing so will allow us to better understand the nuances as- sociated with dropout across different disciplines, thereby providing some theoretical conte xt to early w arning signs of attrition. As an extension to this, we hope to le v erage this work for possible interventions at the polic y lev el to reduce attrition. W e are in discussions with administrators at the Univ ersity of W ashington to better interpret our results and pinpointing possible intervening policies. W e are also interested in technical improvements to our prediction models. As shown in this work, our three initial prediction models yielded similar results. In hopes of improving these models, we intend to first use feature engineering on our existing feature space. Feature engi- neering is often used in the analysis of customer churn from businesses, as shown recently by Huang et al., for example ( 2015 ), and we see a direct analog with student attrition. W e also intend to e v entually look at con v olutional and recurrent neural networks, thereby reducing the need for hand-engineered features. 5. Conclusions In this work, we show preliminary results for predicting student attrition from a large, heterogeneous dataset of student demographics and transcript records. Predicting ev entual student attrition yielded promising results from a balanced dataset of over 32,500 students with regular - ized logistic regression pro viding the strongest predictions. GP A in math, English, chemistry , and psychology courses were among the strongest indi vidual predictors of attrition, as were year of enrollment and birth year , thus highlighting time effects in our data. Predicting the number of quar- ters non-completions take prior to dropping out yielded marginal results, as predictions had an RMSE of about 5 quarters of enrollment. Next steps will in v olve discussions with univ ersity administrators, improving our predictiv e models, and possibly even expanding our dataset to other univ ersities and community colleges where attrition rates tend to be much higher . 19 Predicting Student Dr opout in Higher Education References Aulck, Lovenoor and W est, Jevin. Attrition and Performance of Community College T ransfers to a Large Public Univ ersity . JEDM-Journal of Educational Data Mining (in r e view) , 2016. Baker , Ryan SJD and In ventado, Paul Salv ador . Educa- tional data mining and learning analytics. In Learning Analytics , pp. 61–75. Springer , 2014. Baker , Ryan SJD and Y acef, Kalina. The state of educational data mining in 2009: A revie w and future visions. JEDM-Journal of Educational Data Mining , 1 (1):3–17, 2009. Bean, John P . Dropouts and turnover: The synthesis and test of a causal model of student attrition. Researc h in higher education , 12(2):155–187, 1980. Cabrera, Alberto F , Nora, Amaury , and Castaneda, Maria B. The role of finances in the persistence process: A structural model. Researc h in Higher Education , 33 (5):571–593, 1992. Dekker , Gerben W , Pechenizkiy , Mykola, and Vleeshouw- ers, Jan M. Predicting students drop out: A case study . International W orking Gr oup on Educational Data Mining , 2009. Delen, Dursun. Predicting student attrition with data mining methods. Journal of Colle ge Student Retention: Resear c h, Theory & Practice , 13(1):17–35, 2011. Demetriou, Cynthia and Schmitz-Sciborski, Amy . Inte- gration, motiv ation, strengths and optimism: Retention theories past, present and future. In Pr oceedings of the 7th National Symposium on Student Retention, Charleston, SC , pp. 300–312, 2011. Huang, Y iqing, Zhu, Fangzhou, Y uan, Mingxuan, Deng, Ke, Li, Y anhua, Ni, Bing, Dai, W enyuan, Y ang, Qiang, and Zeng, Jia. T elco churn prediction with big data. In Pr oceedings of the 2015 ACM SIGMOD International Confer ence on Management of Data , pp. 607–618. A CM, 2015. K ov a ˇ ci ´ c, Zlatko J. Early prediction of student success: mining students enrolment data. In Pr oceedings of Informing Science & IT Education Conference (InSITE) , pp. 647–665. Citeseer , 2010. Lin, JJ, Imbrie, PK, and Reid, K enneth J. Student retention modelling: An ev aluation of different methods and their impact on prediction results. Resear ch in Engineering Education Sysmposium , pp. 1–6, 2009. Moseley , Laurence G and Mead, Donna M. Predicting who will drop out of nursing courses: a machine learning ex ercise. Nurse education today , 28(4):469–475, 2008. NCES. Fast Facts (Retrieved April. 2016). T echnical report, National Center for Education Statistics, 2015. URL https://nces.ed.gov/fastfacts/ display.asp?id=40 . Raisman, Neal. The cost of college attrition at four-year colleges & univ ersities. policy perspectiv es. Educational P olicy Institute , 2013. Romero, Cristobal and V entura, Sebastian. Data mining in education. W ile y Inter disciplinary Revie ws: Data Mining and Knowledge Discovery , 3(1):12–27, 2013. Schneider , Mark. Finishing the first lap: The cost of first year student attrition in america’ s four year colleges and univ ersities. American Institutes for Researc h , 2010. Siemens, Geor ge and Bak er , Ryan SJD. Learning analytics and educational data mining: towards communication and collaboration. In Pr oceedings of the 2nd international confer ence on learning analytics and knowledge , pp. 252–254. A CM, 2012. Siemens, Geor ge and Long, Phil. Penetrating the fog: Analytics in learning and education. EDUCA USE r e view , 46(5):30, 2011. Spady , William G. Dropouts from higher education: An interdisciplinary re view and synthesis. Inter c hange , 1 (1):64–85, 1970. Thammasiri, Dech, Delen, Dursun, Meesad, Phayung, and Kasap, Nihat. A critical assessment of imbalanced class distribution problem: The case of predicting freshmen student attrition. Expert Systems with Applications , 41 (2):321–330, 2014. T into, V incent. Dropout from higher education: A theoretical synthesis of recent research. Review of educational r esear ch , 45(1):89–125, 1975. T into, V incent. Leaving colle ge: Rethinking the causes and cur es of student attrition. ERIC, 1987. T into, V incent. Research and practice of student retention: what next? J ournal of Colle ge Student Retention: Resear c h, Theory & Practice , 8(1):1–19, 2006. 20
Original Paper
Loading high-quality paper...
Comments & Academic Discussion
Loading comments...
Leave a Comment