Quantifying the Effect of Sentiment on Information Diffusion in Social Media
Social media have become the main vehicle of information production and consumption online. Millions of users every day log on their Facebook or Twitter accounts to get updates and news, read about their topics of interest, and become exposed to new opportunities and interactions. Although recent studies suggest that the contents users produce will affect the emotions of their readers, we still lack a rigorous understanding of the role and effects of contents sentiment on the dynamics of information diffusion. This work aims at quantifying the effect of sentiment on information diffusion, to understand: (i) whether positive conversations spread faster and/or broader than negative ones (or vice-versa); (ii) what kind of emotions are more typical of popular conversations on social media; and, (iii) what type of sentiment is expressed in conversations characterized by different temporal dynamics. Our findings show that, at the level of contents, negative messages spread faster than positive ones, but positive ones reach larger audiences, suggesting that people are more inclined to share and favorite positive contents, the so-called positive bias. As for the entire conversations, we highlight how different temporal dynamics exhibit different sentiment patterns: for example, positive sentiment builds up for highly-anticipated events, while unexpected events are mainly characterized by negative sentiment. Our contribution is a milestone to understand how the emotions expressed in short texts affect their spreading in online social ecosystems, and may help to craft effective policies and strategies for content generation and diffusion.
💡 Research Summary
The paper investigates how sentiment influences information diffusion on social media, using a large-scale Twitter dataset from September 2014. The authors processed 19,766,112 English tweets (approximately a 10 % sample of the public stream) with SentiStrength, a sentiment analysis tool optimized for short, informal text. Each tweet received a positive score (S⁺) and a negative score (S⁻), both ranging from 1 (neutral) to 5 (strongly emotional). The polarity score S = S⁺ − S⁻, ranging from –4 to +4, was used to classify tweets into three sentiment categories: negative (S ≤ –1), neutral (S = 0), and positive (S ≥ 1). The distribution was 21.59 % negative, 42.46 % neutral, and 35.95 % positive, with a slight skew toward positivity.
Sentiment and diffusion metrics
Three diffusion indicators were examined as functions of polarity: (A) average number of retweets, (B) average number of favorites, and (C) average time (in seconds) until the first retweet. Only tweets that were retweeted at least once (4,147,519 tweets) or favorited at least once (2,434,523 tweets) were considered for A and B; for C, 1,619,195 tweets with observed first retweet timestamps were used. The authors relied on metadata‑reported retweet counts to avoid bias from the 10 % sampling.
Key findings:
- Positive tweets achieve the highest average retweet and favorite counts, confirming a “positive bias” (also known as the Pollyanna effect) where users preferentially share and bookmark uplifting content.
- Negative tweets do not receive significantly more or fewer retweets or favorites than neutral tweets, indicating that the bias operates mainly at the level of content popularity rather than initial spread.
- The time to first retweet is shortest for negative tweets, roughly half that of positive tweets, suggesting that negative information captures attention more quickly and propagates faster in the early stage of diffusion. The speed advantage of negative content over neutral content is modest and not statistically significant.
Temporal dynamics of conversations
The study further explores how sentiment interacts with the temporal evolution of entire discussions, defined by hashtags. Active discussions were those with at least 200 tweets in the sampled month, and exclusive discussions were hashtags that did not appear in the preceding or following month. This yielded 1,522 active, exclusive topics. For each topic, three features were computed: the proportion of tweets before the peak (p_b), during the peak, and after the peak (p_a). Using the Expectation‑Maximization algorithm, the authors fitted Gaussian Mixture Models (GMM) in the (p_b, p_a) space, testing spherical, diagonal, and full covariance structures with 1‑6 components. Bayesian Information Criterion (BIC) cross‑validation identified four components as optimal, consistent with prior literature.
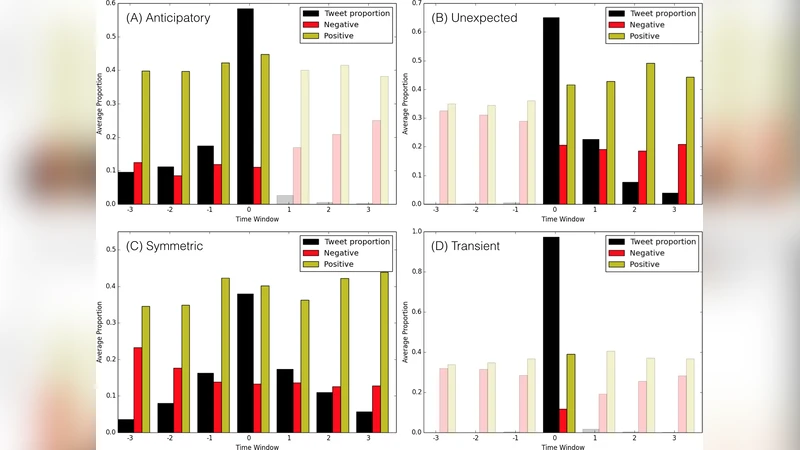
The four conversation classes are:
- Anticipatory – most activity occurs before and during the peak; sentiment analysis shows a steady rise in positive tweets (40‑44 % of posts) and a low, stable negative proportion (9‑12 %). These discussions are typically about events that are expected and generate excitement.
- Unexpected – activity spikes sharply at the peak with little pre‑peak activity; negative sentiment remains around the dataset average, indicating that surprise events tend to elicit more negative reactions.
- Symmetric – activity is balanced before, during, and after the peak; negative sentiment declines from ~23 % at inception to ~12 % by the end, while positive sentiment rises correspondingly, reflecting a gradual emotional shift as the story unfolds.
- Transient – brief, intense bursts of activity that fade quickly; sentiment proportions stay close to overall dataset averages, showing no strong emotional swing.
Examples illustrate each class: a college football game (#TENNvsOU) as anticipatory, a sudden interview release (#MileyPor40Principales) as unexpected, a tragic accident followed by memorial (#PrayForRise) as symmetric, and a lottery announcement (#KDWBmeetEd) as transient.
Methodological strengths and limitations
- SentiStrength’s reported accuracy (≈ 60 % for positive, ≈ 73 % for negative) and its handling of slang, emoticons, and negations make it suitable for large‑scale tweet sentiment labeling.
- The reliance on polarity scores collapses the nuanced spectrum of emotions into a single dimension, potentially obscuring mixed or subtle affective states.
- Excluding tweets with URLs, images, or videos simplifies sentiment extraction but omits a substantial portion of expressive content, limiting generalizability to multimodal communication.
- The 10 % gardenhose sample, while large, may still miss rare but influential cascades; however, using metadata retweet counts mitigates sampling bias for popularity measures.
Implications
The findings suggest distinct strategic considerations for content creators, marketers, and policymakers. In crisis communication, leveraging the rapid early spread of negative messages can ensure swift dissemination of warnings. Conversely, for sustained engagement and broader reach, crafting positive, hopeful narratives is more effective. Real‑time sentiment monitoring can detect the onset of unexpected events characterized by heightened negativity, enabling timely interventions. Moreover, recognizing the emotional trajectory of different conversation types can inform platform design (e.g., algorithmic promotion of anticipatory, positively‑charged content) and public‑health messaging (e.g., counteracting negative sentiment spikes during emergencies).
Conclusion
By quantifying the relationship between sentiment and diffusion speed, breadth, and temporal evolution, the paper provides a comprehensive empirical foundation for understanding affective dynamics in online social ecosystems. Negative sentiment accelerates initial spread, while positive sentiment drives larger overall audience exposure. Temporal patterns of discussions further modulate emotional composition, revealing that anticipation, surprise, symmetry, and transience each carry distinct sentiment signatures. These insights advance computational social science and offer actionable guidance for designing effective information campaigns in the digital age.
Comments & Academic Discussion
Loading comments...
Leave a Comment