A reaction-diffusion model for the progression of Parkinsons disease
The temporal and spatial development of Parkinson’s disease has been characterised as the progressive formation of {\alpha}-synuclein aggregations through susceptible neuronal pathways. This article describes a new model for this progression mechanism in which Parkinsonian damage moves over time through the nervous system by the combined effect of the reaction kinetics of pathogenesis and molecular diffusion. In the reaction-diffusion model, the change from a healthy state to the disease state advances through the nervous system as a wave front of Parkinsonian damage, marking its path by accumulations of damaged {\alpha}-synuclein and neurotoxic levels of oxidative species. Progression according to this model follows the most vulnerable routes through the nervous system as described by Braak’s staging theory and predicts that damage will advance at differing speeds depending upon the level and number of risk factors, in a manner that gives new insights into the variations with which Parkinson’s disease develops.
💡 Research Summary
The paper introduces a novel quantitative framework for understanding the spatiotemporal progression of Parkinson’s disease (PD) by casting the disease spread as a reaction‑diffusion process. Building on Braak’s staging hypothesis—which posits that α‑synuclein (α‑syn) pathology propagates through a stereotyped sequence of vulnerable neuronal pathways—the authors propose that the transition from a healthy neuronal state (H) to a diseased state (D) can be described by a nonlinear reaction term coupled with molecular diffusion along axons and synapses. The governing equation is written as ∂C/∂t = D∇²C + R(C), where C(x,t) denotes the local concentration of misfolded or aggregated α‑syn, D is an effective diffusion coefficient that captures axonal transport, extracellular spread, and possibly intercellular tunneling, and R(C) = k·Cⁿ (n>1) represents a self‑amplifying aggregation reaction. The non‑linearity (n>1) ensures that once a critical concentration is reached, a rapid, wave‑like front of pathology emerges, reminiscent of a Fisher‑KPP front.
To embed anatomical realism, the authors map Braak’s four major stages onto a graph of neuronal tracts: (1) the dorsal motor nucleus of the vagus and olfactory bulb, (2) brainstem nuclei (including the locus coeruleus and substantia nigra), (3) the mesencephalic and thalamic relay stations, and (4) the neocortical association areas. Each edge of the graph is assigned its own diffusion coefficient D_i and reaction rate k_i, reflecting differences in axonal caliber, myelination, local oxidative stress, and exposure to environmental toxins. Risk factors—genetic mutations (e.g., LRRK2, SNCA), pesticide exposure, aging, and comorbidities—are incorporated by scaling D and k: higher risk translates into larger D (faster spread) and larger k (more aggressive aggregation).
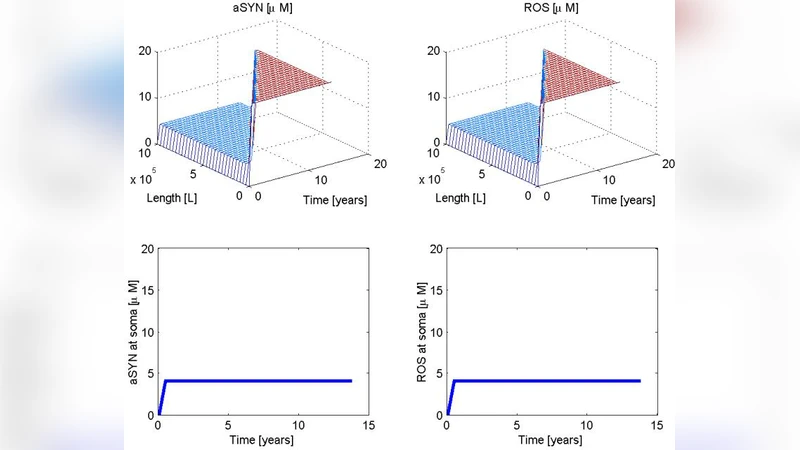
Numerical simulations are performed using finite‑difference discretization on both one‑dimensional linear tracts and two‑dimensional network representations. Initial conditions consist of a small seed of pathological α‑syn (C₀) placed in the most peripheral node (the olfactory bulb or vagus nerve). The simulations reproduce a traveling wave front that advances through the network in the order predicted by Braak, but with variable velocities. The analytical approximation for front speed, v ≈ 2√(D·k·C₀^{n‑1}), matches the simulated velocities across a range of parameter sets. Importantly, the model predicts that increasing the number or intensity of risk factors accelerates the front, potentially explaining why some patients exhibit rapid progression while others remain in a prodromal state for decades.
The authors validate the model qualitatively against imaging data (e.g., PET/SPECT studies showing α‑syn deposition) and post‑mortem staging, demonstrating that the predicted spatial pattern and timing align with observed disease heterogeneity. They also explore therapeutic “what‑if” scenarios: reducing D (e.g., by blocking extracellular vesicle release) or lowering k (e.g., with small‑molecule aggregation inhibitors) both flatten the wave front, delaying the arrival of pathology to cortical regions. Such virtual trials illustrate how the reaction‑diffusion framework can serve as a pre‑clinical testbed for candidate disease‑modifying strategies.
Limitations are acknowledged. First, the model collapses multiple pathogenic mechanisms—mitochondrial dysfunction, neuroinflammation, calcium dysregulation—into a single scalar field C, potentially oversimplifying interactions. Second, true axonal transport is directional (anterograde vs retrograde) and involves active motor proteins, which a pure diffusion term cannot fully capture. Third, accurate estimation of D and k for individual patients requires large‑scale biomarker datasets that are not yet available.
Despite these constraints, the paper makes a compelling case that reaction‑diffusion mathematics provides a unifying language for PD progression, bridging molecular kinetics with whole‑brain network anatomy. Future work is suggested to (i) extend the model to three‑dimensional realistic brain connectomes, (ii) incorporate additional fields for inflammation and oxidative stress, and (iii) calibrate patient‑specific parameters using longitudinal imaging and fluid biomarkers. If achieved, such a model could enable personalized forecasts of disease trajectory, inform optimal timing for intervention, and accelerate the rational design of therapies aimed at halting or slowing the wave of neurodegeneration.
Comments & Academic Discussion
Loading comments...
Leave a Comment