The Quantified City: Sensing Dynamics in Urban Setting
The world is witnessing a period of extreme growth and urbanization; cities in the 21st century became nerve centers creating economic opportunities and cultural values which make cities grow exponentially. With this rapid urban population growth, city infrastructure is facing major problems, from the need to scale urban systems to sustaining the quality of services for citizen at scale. Understanding the dynamics of cities is critical towards informed strategic urban planning. This paper showcases QuantifiedCity, a system aimed at understanding the complex dynamics taking place in cities. Often, these dynamics involve humans, services, and infrastructures and are observed in different spaces: physical (IoT-based) sensing and human (social-based) sensing. The main challenges the system strives to address are related to data integration and fusion to enable an effective and semantically relevant data grouping. This is achieved by considering the spatio-temporal space as a blocking function for any data generated in the city. Our system consists of three layer for data acquisition, data analysis, and data visualization; each of which embeds a variety of modules to better achieve its purpose (e.g., data crawling, data cleaning, topic modeling, sentiment analysis, named entity recognition, event detection, time series analysis, etc.) End users can browse the dynamics through three main dimensions: location, time, and event. For each dimension, the system renders a set of map-centric widgets that summarize the underlying related dynamics. This paper highlights the need for such a holistic platform, identifies the strengths of the “Quantified City” concept, and showcases a working demo through a real-life scenario.
💡 Research Summary
The paper introduces QuantifiedCity, a comprehensive platform designed to capture, fuse, analyze, and visualize the complex dynamics of rapidly growing urban environments. Recognizing that modern cities generate massive amounts of data from both physical sensors (Internet of Things) and human-generated social media streams, the authors argue that a holistic approach is required to support informed urban planning and real‑time operational decisions.
The core technical contribution is the use of a spatio‑temporal blocking function to link records originating from disparate sources. Inspired by Jaro’s blocking methods for record linkage, the authors define spatial cells (e.g., high‑resolution grid squares) and fine‑grained temporal intervals (e.g., hourly windows). Any two data points that fall within the same cell and time window are considered related and are grouped together for downstream processing. This strategy dramatically reduces the combinatorial explosion of pairwise matching while preserving the semantic proximity needed for meaningful cross‑modal analysis.
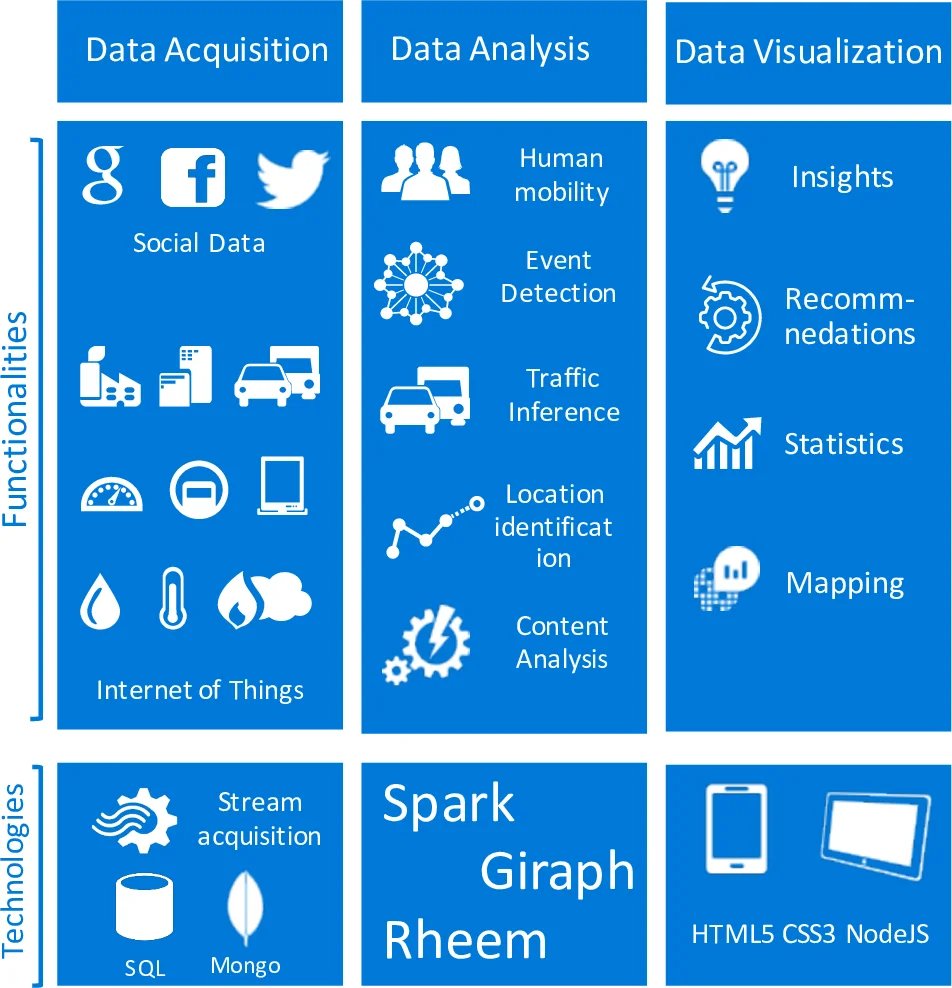
QuantifiedCity’s architecture is organized into three layers:
-
Data Acquisition – A suite of crawlers, API connectors, and streaming parsers continuously harvest data from IoT deployments (traffic counters, air‑quality monitors, power meters) and from social platforms (Twitter, Instagram, location‑based check‑ins). The raw streams are processed in real time using Apache Spark Streaming, indexed by the spatio‑temporal keys, and stored in a centralized geo‑enabled MongoDB repository.
-
Data Analysis – The analysis layer applies both content‑driven techniques (named‑entity recognition, sentiment analysis, topic modeling, event detection) and structure‑driven techniques (network community detection, time‑series forecasting, regression). By operating on the fused data blocks, the system can, for example, attribute a traffic jam to a specific cause (accident, weather, or a social event) by correlating sensor counts with sentiment spikes and keyword bursts in nearby social posts.
-
Data Visualization – An interactive, map‑centric dashboard presents the results. Two sub‑views are provided: a traditional dashboard with scrollable panels displaying charts, word clouds, and timelines; and a map view where colored polygons represent aggregated metrics for each spatio‑temporal block. Users can filter by time range, geographic region, or specific events, and obtain detailed statistics on demand.
The authors demonstrate the platform with a real‑world case study: the 2023 Qatar ExxonMobil Open tennis tournament. By ingesting traffic sensor data, air‑quality readings, and millions of social media posts about the event, QuantifiedCity automatically identifies crowd movement patterns, detects sentiment trends (e.g., frustration about congestion), and links these to specific stadium locations and time slots. The system then suggests adaptive traffic‑signal timing, issues air‑quality alerts, and feeds a recommendation engine that can re‑route spectators or trigger evacuation plans if needed.
In the conclusion, the paper emphasizes three main contributions: (1) a novel spatio‑temporal blocking framework for multi‑modal urban data integration, (2) a modular, scalable pipeline that can be extended with additional sensors or analytics modules, and (3) an intuitive map‑centric UI that enables city officials, traffic managers, and public safety officers to explore city dynamics in real time. Limitations discussed include the sensitivity of block granularity (coarse blocks may hide fine‑grained events, while very fine blocks increase computational load), privacy and security concerns when handling personal social data, and the dependence on the availability of high‑quality sensor streams in different cities. Future work is outlined as dynamic block sizing, privacy‑preserving data fusion techniques, and the development of cross‑city metadata standards to facilitate broader adoption.
Comments & Academic Discussion
Loading comments...
Leave a Comment