Scale effects on spatially embedded contact networks
Spatial phenomena are subject to scale effects, but there are rarely studies addressing such effects on spatially embedded contact networks. There are two types of structure in these networks, network structure and spatial structure. The network structure has been actively studied. The spatial structure of these networks has received attention only in recent years. Certainly little is known whether the two structures respond to each other. This study examines the scale effects, in terms of spatial extent, on the network structure and the spatial structure of spatially embedded contact networks. Two issues are explored, how the two types of structures change in response to scale changes, and the range of the scale effects. Two sets of areal units, regular grids with 24 different levels of spatial extent and census units of three levels of spatial extent, are used to divide one observed and two reference random networks into multiple scales. Six metrics are used to represent the two structures. Results show different scale effects. In terms of the network structure, the properties of the observed network are sensitive to scale changes at fine scales. In comparison, the clustered spatial structure of the network is scale independent. The behaviors of the network structure are affected by the spatial structure. This information helps identify vulnerable households and communities to health risks and helps deploy intervention strategies to spatially targeted areas.
💡 Research Summary
This paper investigates how the spatial extent of a study area influences both the network structure and the spatial structure of spatially embedded human contact networks. While the importance of network structure for disease spread is well‑established, the role of spatial scale—particularly the effect of changing the size of the study area—has received little attention. The authors define two complementary structures: (1) the network structure, describing how nodes are linked, and (2) the spatial structure, describing where nodes and edges are located in geographic space. To quantify these, six metrics are employed: (i) relative size of the largest component (S), (ii) average size of the remaining components (), (iii) clustering coefficient (cc), (iv) relative average path length (l′), (v) the distribution of edge distances (Dist), and (vi) the distribution of distances of edges lost when the network is partitioned (Loss).
Three networks are examined. The primary “observed” network is built from detailed demographic, employment, and commuting data for a metropolitan residential area in the northeastern United States. It contains 64,726 individuals (nodes) and 194,683 contacts (edges), split into family edges (zero geographic distance) and co‑worker edges (non‑zero distances). Two reference random networks are generated: a “random‑node” network that preserves the exact connectivity pattern of the observed network but randomizes node locations, and a “random‑edge” network that preserves node locations (and thus the edge‑distance distribution) but randomizes which nodes are connected. Both random networks retain the same number of nodes, edges, and degree distribution as the observed network. Each random network is simulated 1,000 times and averaged to obtain stable metric values.
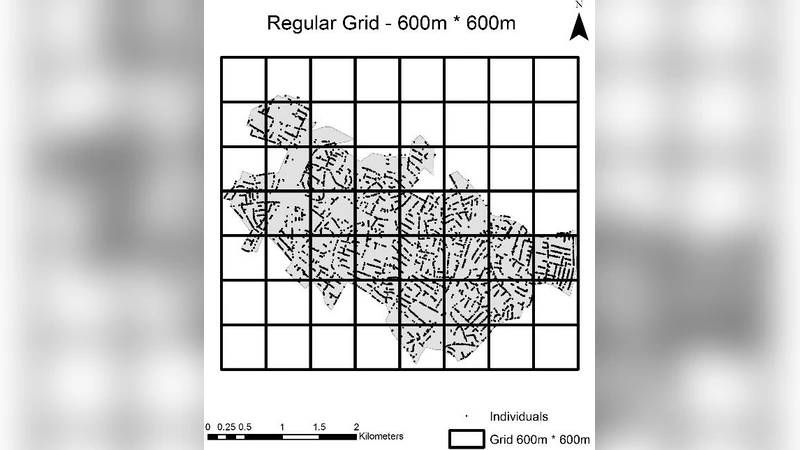
To explore scale effects, the study area is divided using two sets of areal units. The first set consists of regular square grids ranging from 100 m × 100 m up to 2,400 m × 2,400 m in 100 m increments, yielding 24 distinct spatial extents. The second set uses actual administrative boundaries: census blocks, block groups, and tracts, providing three hierarchical extents. For each extent, the networks are partitioned into “unit networks” that lie wholly within a single grid cell or administrative unit. Edges crossing a boundary are removed; the remaining edges constitute the network for that scale, and the removed edges contribute to the Loss metric.
The analysis reveals distinct scale sensitivities for the two structures. Network‑structure metrics (S, , cc, l′) are highly sensitive at fine spatial extents. When the grid size is below roughly 500 m, the largest component shrinks dramatically (S drops), the average size of other components rises, clustering diminishes, and average path length increases—indicating fragmentation and reduced local cohesion. By contrast, the spatial‑structure metric Dist remains remarkably stable across all extents for the observed and random‑edge networks; the edge‑distance distribution retains its shape and mean (~327 m) regardless of how the area is subdivided. This suggests that the underlying geographic clustering of contacts is scale‑independent.
The random‑node network, having randomized locations, shows a markedly different Dist: the mean edge distance expands to ~1,687 m and the distribution becomes more uniform, yet its network‑structure metrics still respond to scale in a manner similar to the observed network. The random‑edge network, which preserves the original Dist, exhibits a higher relative size of the largest component (≈92 %) and a much lower clustering coefficient (≈0.08) compared with the observed network, indicating a more globally connected but locally less clustered topology. Its network‑structure metrics also vary with scale, but the magnitude of change differs from the observed case.
These findings lead to several key insights. First, the network’s topological cohesion is vulnerable to changes in spatial extent, especially at fine resolutions, whereas its geographic clustering is robust. Second, the two structures can behave independently: a network may become topologically fragmented while its spatial clustering remains intact. Third, the choice of areal units (regular grids versus administrative boundaries) does not fundamentally alter the observed patterns, implying that the scale effects are not artifacts of the Modifiable Areal Unit Problem but reflect genuine structural properties.
From a public‑health perspective, the results imply that interventions targeting “structurally vulnerable” households or neighborhoods (identified by low S, high , low cc at fine scales) may need to be applied at a finer spatial resolution than those targeting “spatially high‑risk” zones (identified by dense short‑distance edges). Because the spatial structure is scale‑independent, policies based on geographic clustering (e.g., targeting dense residential blocks) remain valid across different administrative delineations, while policies that rely on network connectivity (e.g., contact tracing, vaccination of highly connected individuals) must consider the scale at which the network is analyzed.
In summary, the paper provides a rigorous methodological framework for dissecting scale effects on spatially embedded contact networks, demonstrates that network topology and spatial embedding respond differently to changes in spatial extent, and offers practical guidance for designing scale‑adaptive disease‑control strategies.
Comments & Academic Discussion
Loading comments...
Leave a Comment