HyperTools: A Python toolbox for visualizing and manipulating high-dimensional data
Data visualizations can reveal trends and patterns that are not otherwise obvious from the raw data or summary statistics. While visualizing low-dimensional data is relatively straightforward (for example, plotting the change in a variable over time as (x,y) coordinates on a graph), it is not always obvious how to visualize high-dimensional datasets in a similarly intuitive way. Here we present HypeTools, a Python toolbox for visualizing and manipulating large, high-dimensional datasets. Our primary approach is to use dimensionality reduction techniques (Pearson, 1901; Tipping & Bishop, 1999) to embed high-dimensional datasets in a lower-dimensional space, and plot the data using a simple (yet powerful) API with many options for data manipulation [e.g. hyperalignment (Haxby et al., 2011), clustering, normalizing, etc.] and plot styling. The toolbox is designed around the notion of data trajectories and point clouds. Just as the position of an object moving through space can be visualized as a 3D trajectory, HyperTools uses dimensionality reduction algorithms to create similar 2D and 3D trajectories for time series of high-dimensional observations. The trajectories may be plotted as interactive static plots or visualized as animations. These same dimensionality reduction and alignment algorithms can also reveal structure in static datasets (e.g. collections of observations or attributes). We present several examples showcasing how using our toolbox to explore data through trajectories and low-dimensional embeddings can reveal deep insights into datasets across a wide variety of domains.
💡 Research Summary
The paper introduces HyperTools, an open‑source Python toolbox designed to simplify the visualization and manipulation of high‑dimensional datasets. Recognizing that traditional 2‑D plots are insufficient for data with dozens or hundreds of features, the authors built a library that integrates a wide range of dimensionality‑reduction algorithms (PCA, PPCA, ICA, MDS, t‑SNE) and alignment techniques (hyperalignment, Shared Response Model) into a single, user‑friendly API.
At its core, HyperTools expects data in a samples × features matrix (NumPy array or Pandas DataFrame). When the plot function is called, missing values are automatically estimated using probabilistic PCA (PPCA) via an EM algorithm, and the data are reduced to three dimensions by default using standard PCA. Users can select alternative reduction methods through the method argument, and can also specify the target dimensionality with ndims.
Visualization is split into two modes: static and animated. Static plots generate an interactive 3‑D line plot (or 2‑D if the feature count is less than three) using Matplotlib and Seaborn. A rich set of styling options—color, palette, format strings, group‑wise coloring, custom labels, and an “explore” mode that shows labels only on mouse hover—are exposed via simple keyword arguments (color, palette, labels, explore). The library also supports plotting multiple datasets simultaneously, each rendered in a distinct color.
Animated plots are activated with animate=True. The animation iterates over rows of the data matrix, displaying a moving window (the “tail”) of the trajectory while the virtual camera rotates around a surrounding cube. Parameters such as duration, tail_duration, rotations, zoom, and chemtrails let users fine‑tune speed, tail opacity, camera motion, and whether past points are shown faintly. Both static and animated outputs can be saved directly (save_path) as PDF or MP4; MP4 export requires ffmpeg.
Beyond visualization, HyperTools provides powerful alignment capabilities. Hyperalignment, a generalization of Procrustes analysis, computes linear transformations (translation, rotation, reflection, scaling) that bring a list of datasets into a common representational space, minimizing pairwise Euclidean distances. This is especially valuable for neuroimaging, where each subject’s brain‑activity patterns occupy a different coordinate system. The toolbox also bundles the Shared Response Model (SRM) from BrainIAK as an alternative alignment method. Once aligned, datasets can be jointly reduced and plotted, making cross‑subject or cross‑modality comparisons straightforward.
The codebase is modular: plot/plot.py handles argument parsing and dispatches to plot/static.py or plot/animate.py; the tools/ package contains utilities for reduction (reduce.py), alignment (align.py), clustering (cluster.py), normalization (normalize.py), missing‑value indexing (missing_inds.py), DataFrame‑to‑array conversion (df2mat.py), and PCA‑explained‑variance diagnostics (describe_pca.py). This organization facilitates maintenance and allows advanced users to call individual functions directly when needed.
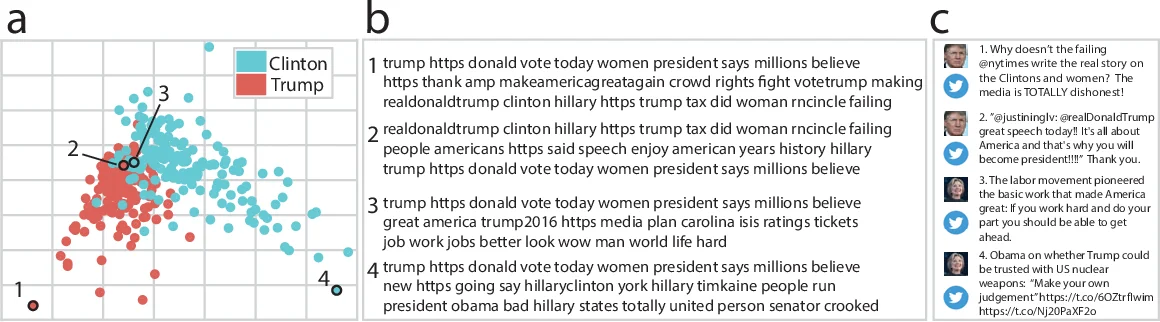
The authors demonstrate HyperTools on diverse real‑world datasets, including fMRI time series, word‑embedding trajectories, and motion‑capture recordings. In each case, dimensionality reduction reveals latent geometric structure, while hyperalignment uncovers shared patterns across subjects or modalities. The toolbox’s ability to produce publication‑quality figures with a single line of code (hypertools.plot(data)) is highlighted as a major productivity boost for researchers.
In summary, HyperTools unifies dimensionality reduction, missing‑data imputation, alignment, static and animated visualization, clustering, and PCA variance analysis into a coherent, easy‑to‑use Python interface. It lowers the barrier for exploratory analysis of complex, high‑dimensional data and enables rapid generation of high‑impact visualizations suitable for papers, presentations, and interactive data exploration. Future extensions could add more non‑linear alignment methods or plug‑in support for additional reduction techniques, further broadening its applicability.
Comments & Academic Discussion
Loading comments...
Leave a Comment