Dynamic Mortality Risk Predictions in Pediatric Critical Care Using Recurrent Neural Networks
Viewing the trajectory of a patient as a dynamical system, a recurrent neural network was developed to learn the course of patient encounters in the Pediatric Intensive Care Unit (PICU) of a major tertiary care center. Data extracted from Electronic …
Authors: M Aczon, D Ledbetter, L Ho
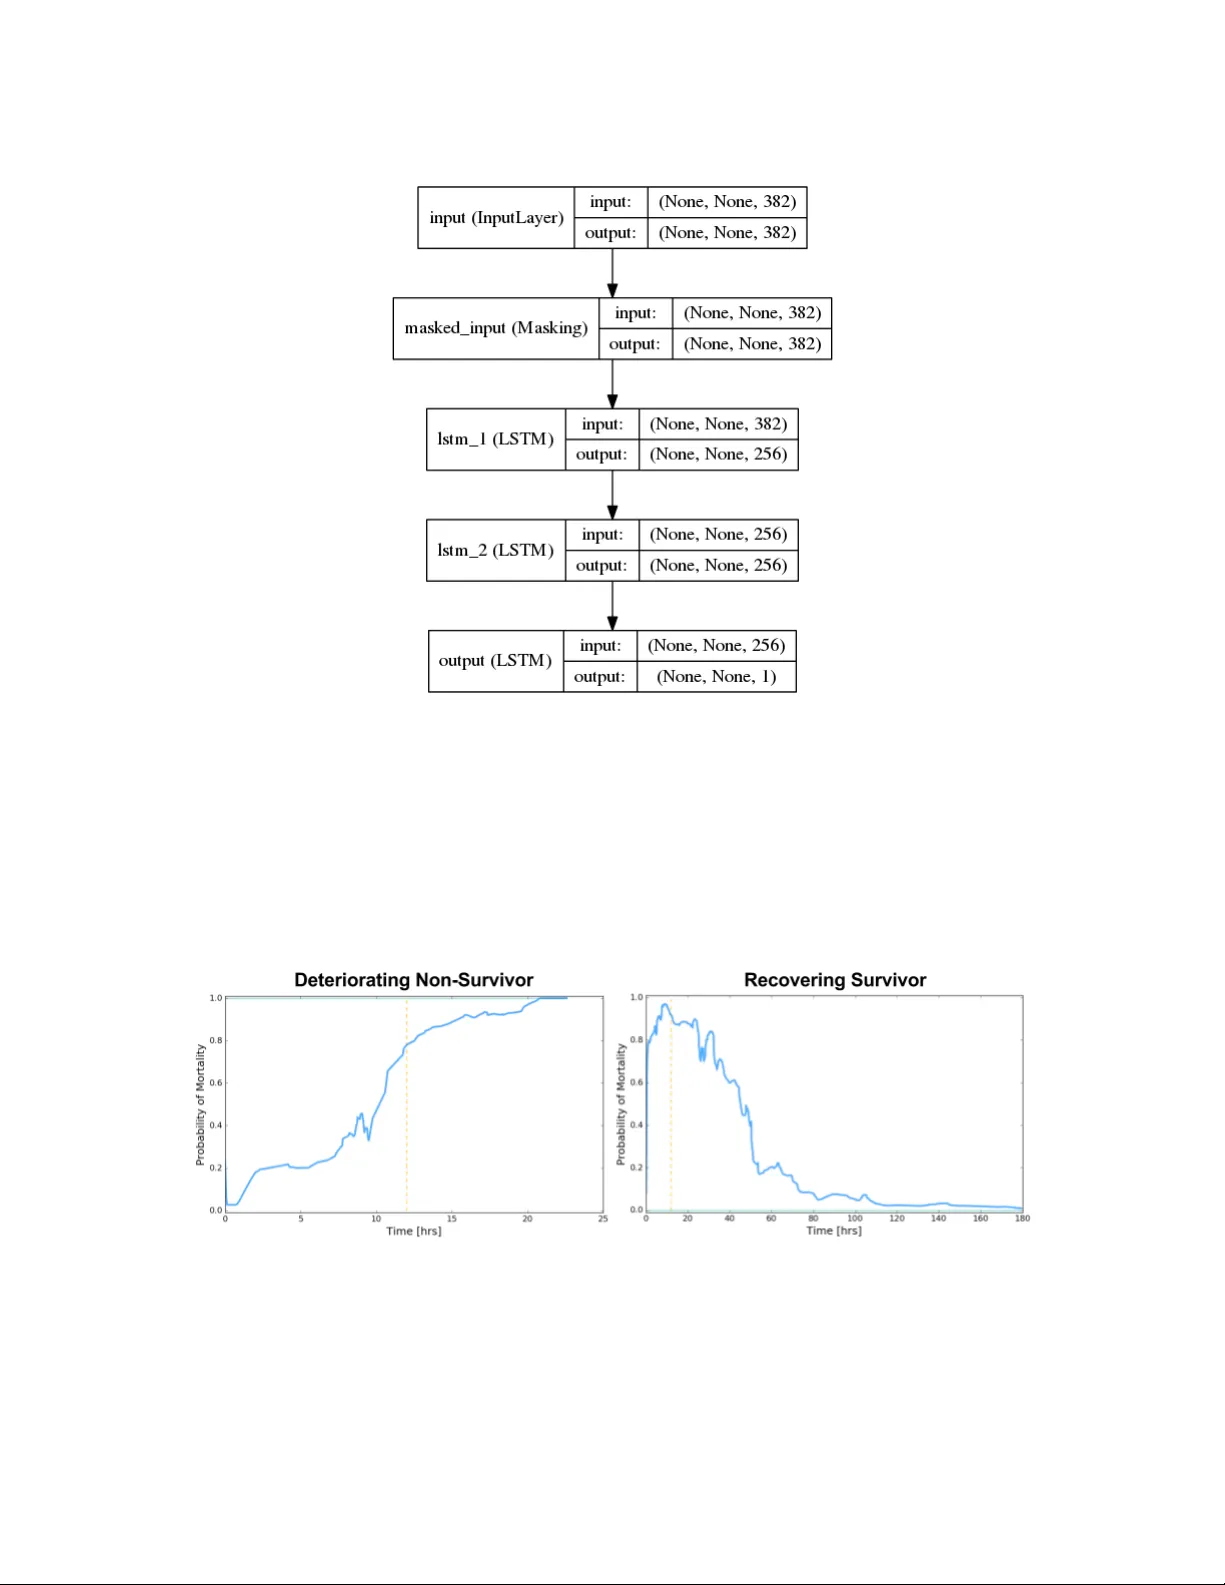
D ynamic Mor t ality Risk Prediction Dynamic Mortalit y Risk Predictions in Pediatric Critical Care Using Recurren t Neural Netw orks Melissa Aczon † , Da vid Ledb etter ∗ , Long V an Ho, Alec Gunn y , Alysia Flynn, Jon Williams, Randall W etzel The Laura P . and Leland K. Whittier Virtual Pediatric In tensiv e Care Unit Children’s Hospital Los Angeles Abstract Viewing the tra jectory of a patien t as a dynamical system, a recurrent neural netw ork was dev elop ed to learn the course of patien t encounters in the P ediatric Intensiv e Care Unit (PICU) of a ma jor tertiary care center. Data extracted from Electronic Medical Records (EMR) of ab out 12000 patients who were admitted to the PICU ov er a p erio d of more than 10 years were leveraged. The RNN mo del ingests a sequence of measurements which include physiologic observ ations, laboratory results, administered drugs and interv en tions, and generates temp orally dynamic predictions for in-ICU mortality at user-sp ecified times. The RNN’s ICU mortalit y predictions offer significan t improv ements ov er those from tw o clinically-used scores and static machine learning algorithms. 1. In tro duction 1.1 Bac kground on sev erit y and mortality scores Numerous sev erity of illness (SOI) and mortality scoring systems ha ve b een developed o v er the past three decades [Le Gall (2005); Strand and Flaatten (2008)]. Tw o of the earliest and commonly used scores are Acute Physiology and Chronic Health Ev aluation (AP A CHE I I), [Knaus et al. (1985)] and Simplified Acute Ph ysiology Score (SAPS) [Le Gall et al. (1984)], b oth of which rely on routine ph ysiologic measuremen ts and the deviations of those measuremen ts from expert-defined normal v alues. In p ediatric critical care, the P ediatric Risk of Mortalit y (PRISM), [Pollac k et al. (1988)] score and P ediatric Index of Mortalit y (PIM), [Shann et al. (1997)] were dev elop ed. Both leverage physiologic data, with PIM incorp orating in to its calculations additional information suc h as pre-ICU pro cedures and in-ICU ven tilation data from the first hour. Larger databases led to refinements of these systems; for some examples, see AP ACHE II I in Knaus et al. (1991); SAPS 3 in Moreno et al. (2005); PRISM 3 in Pollac k et al. (1996); PRISM 4 in P ollac k et al. (2016); PIM 2 in Slater et al. (2003); PIM 3 in Straney et al. (2013). P ollack (2016) makes a distinction b et w een scoring for severit y of illness or predicting mortality . Regardless of this distinction, ho w ev er, the effectiv eness of these mo dels are measured via their ability to discriminate b et w een surviving and non-surviving patients. † Corresp ondence: { maczon, dledbetter, loho, agunny , aflynn, jonwilliams, rw etzel } @c hla.usc.edu ∗ The first tw o authors contributed equally to this w ork. 1 A czon, Ledbetter, Ho, et. al 1.2 EMR and adv anced computing metho ds The adoption of Electronic Medical Records (EMR) has enabled ready access to more v ari- ables and more patients. In resp onse to this ever-gro wing amount of data, machine learning tec hniques increasingly hav e been used to develop models whic h forecast patient condition. The Gaussian pro cess-based scores in Ghassemi et al. (2015) and Alaa et al. (2016) leverage time-series measurements instead of static v alues from a fixed time window of the systems describ ed earlier. T ow ards p ersonalized scoring, the latter attempts to account for hetero- geneit y b y disco v ering, via unsupervised learning, some n umber of classes in the population, then learns the parameters that gov ern each class. The Rothman index [Rothman et al. (2013)] also offers contin uously updated scores but still generates predictions using a static snapshot. The use of neural netw orks in ICU applications actually go es back more than 20 years, as reviewed in Hanson II I and Marshall (2001) . In general those studies were relativ ely small in scale (h undreds of patients). Since then, t w o primary factors ha v e c hanged the landscap e. First, larger datasets con taining tens of thousands of patients with millions of measuremen ts are no w av ailable. Second, computing hardw are adv ances in the last decade, particularly Graphics Processing Units (GPUs), hav e enabled larger, deep er net w orks to b e trained. These more sophisticated netw orks ha v e demonstrated remark able success in wide- ranging applications such as computer vision [Krizhevsky et al. (2012); He et al. (2015)], sp eec h recognition [Hinton et al. (2012)], and natural language pro cessing [Mesnil et al. (2015)]. 1.3 Summary of RNN-based mortalit y mo del/framew ork Recurren t Neural Net w orks (RNN) w ere designed to pro cess sequen tial data. A k ey feature is a fe e db ack lo op which allo ws in tegration of information from previous steps with newly acquired data. Thus, they pro vide an elegan t infrastructure to process ev er-evolving streams of clinical data. Figure 1 gives a high-lev el illustration of data ingestion and prediction with a RNN, and Section 3.1 will describ e the mathematical formulation. Each input vector ( x ) con tains clinical measurements (e.g. ph ysiology and medications). The infrastructure also allo ws the user to sp ecify ho w long into the future predictions are for. Eac h output vector ( y ) con tains forecasts such as mortalit y risk at the sp ecified future time. This w ork fo cused on predicting in-ICU mortality of p ediatric patien ts. Hospital mortalit y is used b ecause it is an ob jective function to assess p erformance despite its inabilit y to capture more sub jectiv e comp onen ts of care suc h as qualit y of surviv al [Knaus et al. (1985)]. Also, the sequen tial nature of the RNN’s mortality risk predictions pro vides a dynamic tracking of patien t condition. 2. Data and pre-pro cessing W e leveraged anon ymized EMR from the PICU at Children’s Hospital Los Angeles b et w een Decem b er 2002 and Marc h 2016. The data for eac h patien t included static information suc h as demographics, diagnoses, and disp osition (aliv e or not) at the end of the ICU encoun ter. An encoun ter is defined as a con tiguous admission in to the PICU. Each encounter con tained irregularly , sparsely and asynchronously sampled measuremen ts of ph ysiologic observ ations 2 D ynamic Mor t ality Risk Prediction Figure 1: Flow of data in RNN-based framework. When measurements (vector X ) b ecome a v ailable at time t n , they are ingested as inputs to the RNN kernel. The RNN then generates a prediction Y corresp onding to a future time sp ecified b y the user through ∆ t n . (e.g. heart rate, bloo d pressure), laboratory results (e.g. creatine, glucose level), drugs (e.g. epinephrine, furosemide) and interv entions (e.g. in tubation, oxygen lev el). A single patient can hav e m ultiple encoun ters, and this is an important p oin t for v alida- tion. When the database w as split in to training and testing sets, all encoun ters from a single patien t b elonged to exactly one of these sets to prev en t p ossible leak age. Encoun ters that did not include disp osition information were excluded from the final database used for the results presented here. This database consisted of 12020 patien ts with 16559 encounters. Sev en t y-fiv e percent of the patien ts were randomly selected and placed in to the training set, and the remaining t wen t y-fiv e p ercent into a holdout set for testing. This splitting resulted in 12460 encounters (with 4.85% mortality) in the training set, and 4099 encounters (with 5.12% mortality) in the holdout set. T o leverage existing deep learning frameworks, the data were first conv erted into the matrix format illustrated in Figure 2 with a pre-pro cessing pip eline describ ed b elow. 2.1 Constituen t Aggregation and Normalization Similar physiologic observ ations or lab oratory measurements w ere aggregated into a single v ariable. F or example, non-in v asiv e and inv asiv e measurements of systolic blo o d pressures w ere group ed together into a single systolic blo o d pressure v ariable. This aggregation resulted in approximately 300 different physiologic and treatment v ariables, a complete list of which can b e found in App endix A. 3 A czon, Ledbetter, Ho, et. al Figure 2: After pre-pro cessing, data for a single patient encounter is in a matrix format. A single row of data con tains v alues (actual and imputed measurements) from a single v ariable. A column of data comprises all measuremen ts at one time p oint. All quantities under the same v ariable were con v erted into the same unit of measure. Drugs and some in terv en tions w ere conv erted to a binary v ariables corresp onding to ab- sence or presence of administration. V ariables that w ere not binarized w ere Z-normalized. The mean and standard deviation needed for this transformation were computed from the training set only , and then applied to b oth the training and holdout sets. 2.2 Imputation The measurements in the database w ere sp arse , irr e gularly sample d – time b et w een any t wo consecutiv e time points ranges from a minute to several hours – and asynchr onous . At any time p oint when at least one v ariable had a recorded v alue, the v alues for all other v ariables without a measuremen t at that p oint were imputed. The imputation pro cess dep ended on the v ariable type. Any missing measuremen t of a drug or an in terven tion v ariable w as imputed as zero. When a ph ysiologic observ ation or lab measuremen t w as a v ailable, it was propagated forward un til its next reading. Ho w ev er, if a physiologic or lab oratory v ariable had no recorded v alue throughout the entire encoun ter, then that v ariable w as set to zero at all time p oints for that encounter. Since physiologic observ ations w ere first Z-normalized, a zero imputation is equiv alen t to an imputation with the p opulation mean derived from the training set. Note that no features w ere age-normalized; instead age was an input as a physiologic observ ation. These choices were based on a reasonable assumption ab out clinical practice: measuremen ts are tak en more frequently when something is happening to the patient, and less frequently when the patien t app ears stable . 4 D ynamic Mor t ality Risk Prediction 3. RNN-based F ramew ork 3.1 F rom dynamical system to RNN The tra jectory of a patien t can b e viewed as a contin uous dynamical system comp osed of man y v ariables, P ( t ) = [vitals , labs , drugs , in terv en tions] T , interacting with each other: dP ( t ) dt = F P ( t ) , P ( t 0 ) = P 0 . (1) In equation (1), F denotes the unknown and complex function go v erning the v ariable in- teractions, while P 0 is the state at some initial time, t 0 . F or the PICU setting and data, t 0 corresp onds to the start time of an ICU encounter. Finite difference metho ds are a standard wa y to solv e equation (1) [LeV eque (2007)]. An y such appro ximation can b e cast into the form P ( t n + ∆ t n ) = G P ( t n ) , ∆ t n , P ( t n − 1 ) , . . . , P ( t n − k ) , , (2) where t n + ∆ t n is a sp ecified future time of interest. This can b e further abstracted into the form: P ( t n + ∆ t n ) = G P ( t n ) , ∆ t n , H P ( t n − 1 ) , . . . , P ( t n − k ) , (3) where H is a transformation of data from previous time steps. Equation (3) – which can b e visualized in Figure 3 – is a recurren t relation, and G describ es the mapping from past states into a future state. Figure 3: Visual diagram of finite difference formulation given in Equation 3. Indep enden t work b y F unahashi (1989) and Hornik et al. (1989) established that any function with mathematically reasonable prop erties can b e approximated by a neural net- 5 A czon, Ledbetter, Ho, et. al w ork to an arbitrary degree of accuracy , i.e. G = X i α i σ W i P ( t n ) , ∆ t n , H P ( t n − 1 ) , . . . , P ( t n − k ) + b i | {z } Neural Netw ork: N + , (4) where is an arbitrarily small real num b er. The finite difference formulation therefore b ecomes P ( t n + ∆ t n ) ≈ N P ( t n ) , ∆ t n , H P ( t n − 1 ) , . . . , P ( t n − k ) . (5) The output of H can be regarded as a hidden state or an in ternal representation of the patien t’s history , and the mortality risk can b e inferred from this in tegration of history . The diagram of Figure 3 then leads to the RNN formulation sho wn in Figure 4, where the RNN mo dule encapsulates G from Equation (2) and an additional function that transforms the in ternal state to s ome observ able manifestation, such as mortality risk, represented by the output y . The recurren t asp ect of the net w ork, i.e. the feedback mechanism, allo ws past information to b e propagated forward. Figure 4: The output of the RNN, y , is another transformation It is worth noting that work by F unahashi and Nak am ura (1993) show ed a direct path from dynamical systems to a class of con tin uous time recurren t neural net w orks (CTRNN) pro vided the original function, F , in Equation (1) meets contin uity conditions. Chow and Li (2000) and Li et al. (2005) extended the theory to handle more general dynamical systems, including time-v ariant ones with inputs for con trol . Applying a finite difference scheme to the CTRNN leads to a form that is very similar to Equation (5). 6 D ynamic Mor t ality Risk Prediction Figure 5: Physiologic observ ations, lab oratory measuremen ts, interv en tions and drugs at time t n are inputs to the RNN k ernel. The RNN then pro jects a mortalit y risk for time t n + ∆ t n , where ∆ t n is sp ecified b y a user. 3.2 RNN arc hitecture and implemen tation Figure 5 illustrates the flow of the PICU data and predictions in the RNN-based infras- tructure. The input vector to the net w ork at time t n consists of fiv e main groups of mea- suremen ts from a patien t’s ICU encounter: X V ( t n ) , X L ( t n ) , X I ( t n ) , X D ( t n ) , ∆ t n T . The v ector X V con tains the ph ysiologic observ ations, the vector X L con tains lab oratory results, the v ector X I comprises the interv entions, X D records the administered drugs, and the scalar ∆ t n sp ecifies how far in to the future the user wan ts to forecast. Including ∆ t n in the input v ector follo ws naturally from the finite difference form ulation (2) and serv es a dual purp ose: it giv es the user control and flexibility in time-to-prediction, and it also enables augmen tation of the training data during mo del developmen t. The output at this time step is a probabilit y of surviv al at the future time t n + ∆ t n whic h can b e though t of as a prediction of patient condition at that future time. A num ber of RNN architectures hav e b een dev elop ed and studied (Greff et al., 2015; Jozefo wicz et al., 2015). The sp ecific one utilized here is the Long Short-T erm Memory (LSTM) architecture of Hochreiter and Sc hmidh uber (1997). The Keras python deep learn- ing framework (Chollet, 2015) was used to construct a mo del comprised of three LSTMs – see Figure 6 – and train this mo del to make predictions for in-ICU mortality . 4. Results The RNN model con tin uously updates its mortalit y risk predictions as it in tak es new data. Figure 7 displays these temp orally evolving risk scores from tw o patients. This dynamic 7 A czon, Ledbetter, Ho, et. al Figure 6: RNN arc hitecture for PICU data trac king, which is automatic in the RNN, is not done b y PIM 2 or PRISM 3. The Rothman index up dates its predictions when new measurements b ecome av ailable, but its up date do es not in tegrate past measurements. In this sense, the Rothman index still pro cesses time series data in a static manner, while the RNN dynamically integrates data through its feedbac k mechanism. Figure 7: RNN-generated mortality risk of tw o patients track ed ov er their ICU encounter. The dashed y ello w lines indicate the 12-hour mark. The patient on the left slo wly deteriorated o v er the course of a da y and did not survive. The patient on the righ t started as very high-risk but recov ered ov er the course of a w eek. 8 D ynamic Mor t ality Risk Prediction The RNN’s ICU mortalit y predictions w ere compared to those of PIM 2 and PRISM 3, b oth of which were pulled directly from the EMR. A logistic regression (LR) and a multi- la y er p erceptron (MLP) were also implemented for additional comparisons. The LR, MLP and RNN mo dels access iden tical clinical data. Lik e PIM 2 and PRISM 3, LR and MLP are static metho ds, meaning they pro cess a snapshot of data from a fixed windo w of time to make a single-time prediction. Again, this is a contrast to the RNN which con tin uously in tegrates incoming data with past information. Both PIM 2 and PRISM 3 use information collected prior to ICU admission, data which the RNN, MLP and LR models do not access. In addition, PIM 2 incorp orates some data from the first hour in the ICU, while PRISM 3 uses data from the first 12 hours in the ICU. The ICU mortalit y predictions of the differen t models were assessed via Receiver Op er- ating Characteristic (R OC) curves and corresponding Area Under the Curv e (A UC). Figure 8 sho ws the results on 2849 holdout encoun ters that had b oth PIM 2 and PRISM 3 scores. The RNN mo del yields an A UC of 93 . 4% whic h is significan tly higher than the comparativ e mo dels [MLP: 88 . 8% ( p < 0 . 01), LR: 86 . 1% ( p < 0 . 001), PIM 2: 86 . 3% ( p < 0 . 001), and PRISM 3: 88 . 0% ( p < 0 . 003)]. The LR, MLP and RNN predictions used to generate these results w ere all tak en from the 12th hour. The difference in p erformance b etw een the MLP and RNN provides a rough quan tification of the b o ost that dynamic integration pro vides o v er static computation. The feedbac k lo op gives the RNN a temp oral memory which enables temp oral trends – i.e., function deriv ativ es – to b e incorp orated into the mo del. Figure 8: Comparison of ICU mortality predictions from v arious mo dels: Recurren t Neural Net w ork, Multi-Lay er P e rceptron, Logistic Regression, PIM2, and PRISM3. ROC curv es and AUCs were generated from 2849 holdout encoun ters that had b oth PIM 2 and PRISM 3 scores av ailable. Figure 9 demonstrates the impro ved predictiv e capabilit y of the RNN mo del as a function of increasing observ ation time. After only three hours of observ ation, the RNN’s AUC surpasses that of PRISM 3 which incorp orates 12 hours of observ ation. As the RNN’s observ ation window increases, the accuracy of its prediction contin ues to increase. This is a desirable c haracteristic of a risk score. 9 A czon, Ledbetter, Ho, et. al Figure 9: Comparison of ICU mortality predictions from RNN mo del after v arious lengths of observ ation time. These results were aggregated from the same 2849 holdout encoun ters in the previous figure. All had least 12 hours of data. 5. Conclusions Recurren t Neural Netw orks w ere applied on ICU EMR to generate in-ICU mortalit y risk scores. In addition to providing dynamic tracking of patien t condition, the RNN-generated scores also achiev ed significantly higher accuracy [A UR OC greater than 93%] than the clinically used systems PIM 2 and PRISM 3. The RNN mo del also outp erformed logistic regression and multi-la yer p erceptron mo dels. The increased p erformance of the RNN mo del stemmed from tw o key factors: access to more v ariables that c haracterize a patien t and dynamic in tegration that allows it to incorp orate temp oral trends of those v ariables. Although approximately 300 v ariables hav e been enco ded into the model, other data whic h are av ailable from the PICU, such as fluid balance, ha ve not b een incorp orated. Monitor data, which ha v e higher temp oral resolution, also ha v e yet to b e included. F u- ture work will fo cus on aggregating these additional data and quantifying their impact on predictiv e accuracy . Ac kno wledgments This work w as funded by a grant from the Laura P . and Leland K. Whittier F oundation. References Ahmed M Alaa, Jinsung Y o on, Scott Hu, and Mihaela v an der Sc haar. Personalized risk scoring for critical care patients using mixtures of gaussian pro cess exp erts. arXiv pr eprint arXiv:1605.00959 , 2016. F Chollet. Keras. https://github.com/fchollet/keras , 2015. T ommy WS Chow and Xiao-Dong Li. Mo deling of contin uous time dynamical systems with input by recurrent neural net w orks. IEEE T r ansactions on Cir cuits and Systems I: 10 D ynamic Mor t ality Risk Prediction F undamental The ory and Applic ations , 47(4):575–578, 2000. Ken-Ic hi F unahashi. On the approximate realization of contin uous mappings by neural net w orks. Neur al networks , 2(3):183–192, 1989. Ken-ic hi F unahashi and Y uic hi Nak am ura. Appro ximation of dynamical systems by contin- uous time recurren t neural netw orks. Neur al networks , 6(6):801–806, 1993. Marzy eh Ghassemi, Marco AF Pimentel, T ristan Naumann, Thomas Brennan, Da vid A Clifton, P ete r Szolovits, and Mengling F eng. A m ultiv ariate timeseries mo deling approac h to sev erity of illness assessmen t and forecasting in icu with sparse, heterogeneous clinical data. In AAAI , pages 446–453, 2015. Klaus Greff, Rupesh Kumar Sriv asta v a, Jan Koutn ´ ık, Bas R Steunebrink, and J ¨ urgen Sc hmidh ub er. Lstm: A search space o dyssey . arXiv pr eprint arXiv:1503.04069 , 2015. C William Hanson I I I and Bry an E Marshall. Artificial in telligence applications in the in tensiv e care unit. Critic al c ar e me dicine , 29(2):427–435, 2001. Kaiming He, Xiangyu Zhang, Shao qing Ren, and Jian Sun. Deep residual learning for image recognition. arXiv pr eprint arXiv:1512.03385 , 2015. Geoffrey Hin ton, Li Deng, Dong Y u, George E Dahl, Ab del-rahman Mohamed, Na vdeep Jaitly , Andrew Senior, Vincen t V anhouck e, Patric k Nguyen, T ara N Sainath, et al. Deep neural net w orks for acoustic mo deling in sp eec h recognition: The shared views of four researc h groups. IEEE Signal Pr o c essing Magazine , 29(6):82–97, 2012. Sepp Ho chreiter and J ¨ urgen Schmidh uber. Long short-term memory . Neur al c omputation , 9(8):1735–1780, 1997. Kurt Hornik, Maxw ell Stinc hcom b e, and Halbert White. Multilay er feedforw ard net w orks are universal appro ximators. Neur al networks , 2(5):359–366, 1989. Rafal Jozefo wicz, W o jciec h Zarem ba, and Ily a Sutsk ev er. An empirical exploration of re- curren t netw ork architectures. In Pr o c e e dings of the 32nd International Confer enc e on Machine L e arning (ICML-15) , pages 2342–2350, 2015. William A Knaus, Elizab eth A Drap er, Douglas P W agner, and Jack E Zimmerman. Apache ii: a sev erit y of disease classification system. Critic al c ar e me dicine , 13(10):818–829, 1985. William A Knaus, Douglas P W agner, Elizab eth A Drap er, Jack E Zimmerman, Marilyn Bergner, P aulo G Bastos, Carl A Sirio, Donald J Murphy , T ed Lotring, and Anne Dami- ano. The apac he iii prognostic system. risk prediction of hospital mortality for critically ill hospitalized adults. Chest Journal , 100(6):1619–1636, 1991. Alex Krizhevsky , Ily a Sutskev er, and Geoffrey E Hinton. Imagenet classification with deep con v olutional neural netw orks. In A dvanc es in neur al information pr o c essing systems , pages 1097–1105, 2012. Jean-Roger Le Gall. The use of sev erit y scores in the intensiv e care unit. Intensive c ar e me dicine , 31(12):1618–1623, 2005. 11 A czon, Ledbetter, Ho, et. al Jean-Roger Le Gall, Philipp e Loirat, Annick Alp ero vitc h, P aul Glaser, Claude Gran thil, Daniel Mathieu, Philipp e Mercier, Remi Thomas, and Daniel Villers. A simplified acute ph ysiology score for icu patients. Critic al c ar e me dicine , 12(11):975–977, 1984. Randall J LeV eque. Finite differ enc e metho ds for or dinary and p artial differ ential e quations: ste ady-state and time-dep endent pr oblems , volume 98. Siam, 2007. Xiao-Dong Li, John KL Ho, and T ommy WS Chow. Appro ximation of dynamical time- v ariant systems by contin uous-time recurrent neural net w orks. IEEE T r ansactions on Cir cuits an d Systems II: Expr ess Briefs , 52(10):656–660, 2005. Gr ´ egoire Mesnil, Y ann Dauphin, Kaisheng Y ao, Y osh ua Bengio, Li Deng, Dilek Hakk ani- T ur, Xiao dong He, Larry Hec k, Gokhan T ur, Dong Y u, et al. Using recurren t neural net w orks for slot filling in sp oken language understanding. IEEE/A CM T r ansactions on A udio, Sp e e ch and L anguage Pr o c essing (T ASLP) , 23(3):530–539, 2015. Rui P Moreno, Philipp GH Metnitz, Eduardo Almeida, Barbara Jordan, P eter Bauer, Ri- cardo Abizanda Camp os, Gaetano Iapic hino, David Edbro oke, Maurizia Capuzzo, Jean- Roger Le Gall, et al. Saps 3from ev aluation of the patient to ev aluation of the intensiv e care unit. part 2: Developmen t of a prognostic mo del for hospital mortality at icu admis- sion. Intensive c ar e me dicine , 31(10):1345–1355, 2005. Murra y M P ollac k. Severit y of illness confusion. Pe diatric Critic al Car e Me dicine , 17(6): 583, 2016. Murra y M P ollac k, Urs E Ruttimann, and Pamela R Getson. P ediatric risk of mortality (prism) score. Critic al c ar e me dicine , 16(11):1110–1116, 1988. Murra y M Pollac k, Kan tilal M P atel, and Urs E Ruttimann. Prism iii: an up dated pediatric risk of mortalit y score. Critic al c ar e me dicine , 24(5):743–752, 1996. Murra y M P ollac k, Richard Holubko v, T omohiko F unai, J Michael Dean, John T Berger, Da vid L W essel, Kathleen Meert, Robert A Berg, Christopher JL Newth, Ric k E Harrison, et al. The pediatric risk of mortalit y score: up date 2015. Pe diatric Critic al Car e Me dicine , 17(1):2–9, 2016. Mic hael J Rothman, Stev en I Rothman, and Joseph Beals. Developmen t and v alidation of a con tin uous measure of patien t condition using the electronic medical record. Journal of biome dic al informatics , 46(5):837–848, 2013. F Shann, G Pearson, A Slater, and K Wilkinson. Paediatric index of mortalit y (pim): a mortalit y prediction mo del for children in in tensiv e care. Intensive c ar e me dicine , 23(2): 201–207, 1997. An thon y Slater, F rank Shann, Gale P earson, PIM Study Group, et al. Pim2: a revised v ersion of the paediatric index of mortality . Intensive c ar e me dicine , 29(2):278–285, 2003. K Strand and H Flaatten. Sev erit y scoring in the icu: a review. A cta Anaesthesiolo gic a Sc andinavic a , 52(4):467–478, 2008. 12 D ynamic Mor t ality Risk Prediction Lahn Straney , Arc hie Clemen ts, Roger C P arslo w, Gale Pearson, F rank Shann, Jan Alexan- der, An thon y Slater, ANZICS Paediatric Study Group, the Paediatric In tensiv e Care Audit Netw ork, et al. P aediatric index of mortality 3: an up dated mo del for predicting mortalit y in p ediatric intensiv e care. Pe diatric Critic al Car e Me dicine , 14(7):673–681, 2013. 13 A czon, Ledbetter, Ho, et. al App endix A. Clinical Data Used Vitals Ab dominal girth Bladder pressure Capillary refill rate Cen tral V enous Pressure Cerebral p erfusion pressure Diastolic Blo o d Pressure EtCO2 Ey e Resp onse Glasco wCS Head circumference Heart rate Heigh t In tracranial pressure Left pupillary resp onse Motor Resp onse Near-infrared sp ectroscopy % Pulse Oximetry Pupillary resp onse Respiratory rate Righ t pupillary resp onse Systolic Blo o d Pressure T emp erature V erbal Resp onse W eight Labs ABG Base excess ABG FiO2 ABG HCO3 ABG O2 sat % ABG PCO2 ABG PO2 ABG TCO2 ABG pH AL T (SGPT) AST (SGOT) Albumin level Alk aline phosphatase Am ylase B-t yp e Natriuretic Peptide BUN Bands % Basophils % Bicarb onate serum Bilirubin conjugated Bilirubin total Bilirubin unconjugated Blasts % C-reactiv e protein CBG Base excess CBG FiO2 CBG HCO3 CBG O2 sat % CBG PCO2 CBG PO2 CBG TCO2 CBG pH CSF Bands % CSF Lymphs % CSF RBC CSF Segs % CSF WBC CSF glucose CSF protein Calcium ionized Calcium total Chloride Complemen t C3 serum Complemen t C4 serum Creatinine Culture CSF Culture blo o d Culture fungus blo o d Culture respiratory Culture urine Culture w ound ESR Eosinophils % FDP Titer F erritin lev el Fibrinogen GGT Glucose Haptoglobin 14 D ynamic Mor t ality Risk Prediction Labs (cont.) Hema Hemo INR Lactate Lactate Dehydrogenase blo o d Lactic Acid blo o d Lipase Lympho cyte % MCH MCHC % MCV MVBG Base excess MVBG FiO2 MVBG HCO3 MVBG O2 sat % MVBG PCO2 MVBG PO2 MVBG TCO2 MVBG pH Macro cytes Magnesium level Metam y elo cytes % Mono cytes % My elo cytes % Neutrophils % Oxygen taion index P/F ratio PT PTT P aO2/FiO2 Phosphorus level Platelet count P otassium Protein total RBC blo o d RD W % Reticulo cyte count % Sc histo cytes So dium T4 free TSH T riglycerides VBG Base excess VBG FiO2 VBG HCO3 VBG O2 sat % VBG PCO2 VBG PO2 VBG TCO2 VBG pH Virus White blo o d cell count In terv en tions Ab dominal X ra y Alprostadil Amplitude CT ab domen CT ab domen/p elvis CT brain CT chest CT p elvis Chest X ra y Chest/ab d X ra y Con tin uous EEG ECMO hours ECMO type EP AP FiO2 F oley catheter F requency Hemofiltration/CRR T IP AP Inspiratory time MAP MRI brain Mean airwa y pressure NIV set rate Nitric Oxide O2 Flow PEEP PEEP P eak Inspiratory Pressure Peritoneal dyalisis Pressure supp ort Tidal volume deliv ered 15 A czon, Ledbetter, Ho, et. al In terv en tions (cont.) Tidal volume expiratory Tidal volume inspiratory Tidal volume set T racheostom y V entilator rate V en tricular assist device V olume Tidal Drugs Acetaminophen Acetaminophen/Co deine Acetaminophen/Hydro co done Acetaminophen/Oxyco done Acetazolamide Acetylcysteine Acyclo vir Albumin Albuterol Allopurinol Alteplase Amik acin Amino caproic Acid Aminophylline Amio darone Amlo dipine Amo xicillin Amoxicillin/cla vulanic acid Amphotericin B Amphotericin B Lipid Complex Ampicillin Ampicillin/Sulbactam Aspirin A tenolol A tropine Azathioprine Azithrom ycin Baclofen Basiliximab Budesonide Bumetanide Calcium Chloride Calcium Glubionate Calcium Gluconate Captopril Carbamazepine Carv edilol Casp ofungin Cefazolin Cefepime Cefotaxime Cefo xitin Ceftazidime Ceftriaxone Cefuro xime Cephalexin Chloral Hydrate Chlorothiazide Ciproflo xacin HCL Cisatracurium Clarithrom ycin Clindam ycin Clonazepam Clonidine HCl Clotrimazole Cromolyn So dium Cyclophosphamide Cyclosporine Dan trolene So dium Desmopressin Dexamethasone Dexmedetomidine Diazepam Digo xin Diphenh ydramine HCl Dobutamine Dopamine Dornase Alfa Do xacurium Chloride Do xorubicin Do xycycline Hyclate Enalapril Eno xaparin Epinephrine Ep o etin Erythrom ycin 16 D ynamic Mor t ality Risk Prediction Drugs (cont.) Esmolol Hydro chloride Etomidate F actor VI I F amotidine F entan yl F errous Sulfate Filgrastim Flecainide Acetate Fluconazole Fluticasone F osphenytoin F urosemide Gabap en tin Ganciclo vir So dium Gen tamicin Glycop yrrolate Halop eridol Heparin Hydro cortisone Hydromorphone Ibuprofen Imip enem Imm une Globulin Insulin Ipratropium Bromide Isoniazid Isoproterenol Isradipine Itraconazole Ketamine Ketorolac Lab etalol Lactobacillus Lansoprazole Lev albuterol Levetiracetam Lev o carnitine Lev oflo xacin Lev oth yro xine So dium Lido caine Linezolid Lisinopril Lorazepam Magnesium Sulfate Merop enem Methadone Meth ylprednisolone Meto clopramide Metolazone Metronidazole Micafungin Midazolam HCl Milrinone Mon teluk ast So dium Morphine Mycophenolate Mofetl Nalo xone HCL Napro xen Nesiritide Nifedipine Nitrofuran toin Nitroglycerine Nitroprusside Norepinephrine Nystatin Octreotide Acetate Olanzapine Ondansetron Oseltamivir Oxacillin Oxcarbazepine Oxyco done P ancuronium P an toprazole P enicillin G So dium P en tobarbital Phenobarbital Phen ylephrine HCl Phen ytoin Piperacillin Pip eracillin/T azobactam Potassium Chloride P otassium Phosphate Prednisolone Prednisone Pro cainamide Prop ofol Propranolol HCl 17 A czon, Ledbetter, Ho, et. al Drugs (cont.) Prostacyclin Protamine Racemic Epi Ranitidine Rifampin Risperidone Ro curonium Sildenafil So dium Bicarb onate So dium Chloride So dium Phosphate Spironolactone Sucralfate T acrolimus T erbutaline Theoph ylline Ticarcillin Ticarcillin/cla vulanic acid T obramycin T opiramate T reprostinil T rimethoprim/Sulfamethoxazole T romethamine Ursodiol V alganciclovir V alproic Acid V ancomycin V asopressin V ecuronium Vitamin E Vitamin K V oriconazole W arfarin So dium 18
Original Paper
Loading high-quality paper...
Comments & Academic Discussion
Loading comments...
Leave a Comment