Not Normal: the uncertainties of scientific measurements
Judging the significance and reproducibility of quantitative research requires a good understanding of relevant uncertainties, but it is often unclear how well these have been evaluated and what they imply. Reported scientific uncertainties were stud…
Authors: David C. Bailey
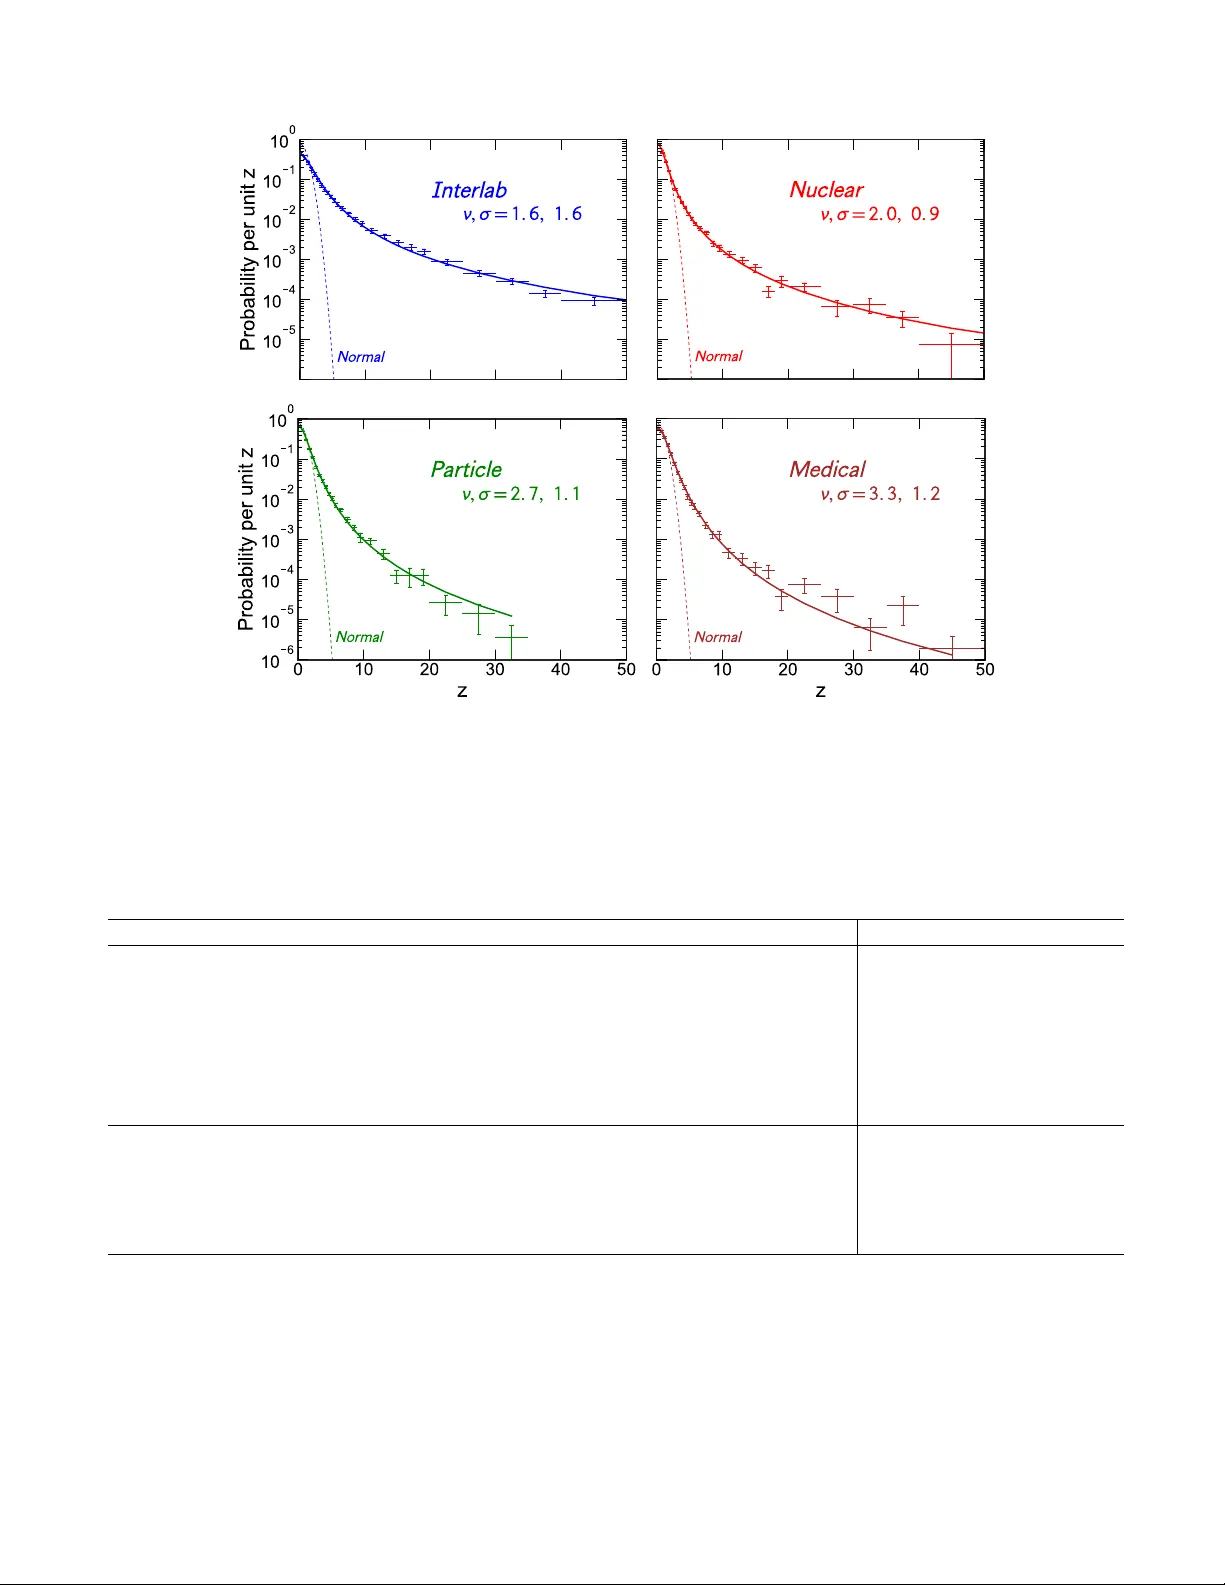
Not Normal: the uncertain ties of scien tific measuremen ts Da vid C. Bailey ∗ Physics Dep artment, University of T or onto, T or onto, ON, Canada M5S 1A7 (Dated: No vem b er 6, 2018) Judging the significance and repro ducibilit y of quantitativ e research requires a goo d un- derstanding of relev ant uncertain ties, but it is often unclear how well these ha v e b een ev al- uated and what they imply . Rep orted scien tific uncertainties were studied by analysing 41000 measurements of 3200 quan tities from medicine, nuclear and particle ph ysics, and in terlab oratory comparisons ranging from chemistry to to xicology . Outliers are common, with 5 σ disagreements up to five orders of magnitude more frequen t than naively exp ected. Uncertain ty-normalized differences betw een multiple measuremen ts of the same quantit y are consisten t with heavy-tailed Studen t-t distributions that are often almost Cauch y , far from a Gaussian Normal b ell curve. Medical researc h uncertainties are generally as well ev aluated as those in physics, but ph ysics uncertaint y improv es more rapidly , making feasible simple significance criteria such as the 5 σ disco v ery conv en tion in particle physics. Con tributions to measuremen t uncertain ty from mistak es and unknown problems are not completely unpre- dictable. Suc h errors app ear to hav e p o w er-law distributions consistent with how designed complex systems fail, and ho w unkno wn systematic errors are constrained b y researc hers. This b etter understanding ma y help improv e analysis and meta-analysis of data, and help scien tists and the public ha ve more realistic exp ectations of what scien tific results imply . I. INTR ODUCTION What do rep orted uncertain ties actually tell us ab out the accuracy of scien tific measuremen ts and the likeli- ho od that different measuremen ts will disagree? No sci- en tist exp ects different research studies to alwa ys agree, but the frequen t failure of published research to b e con- firmed has ge nerated m uc h concern ab out scien tific re- pro ducibilit y [ 1 , 2 ]. When scien tists inv estigate many quantities in very large amounts of data, interesting but ultimately false results may o ccur by chance and are often published. In particle physics, bitter experience with frequent failures to confirm such results even tually led to an ad ho c “5- sigma” disco v ery criterion [ 3 – 6 ], i.e. a “disco very” is only tak en seriously if the estimated probability for observing the result without new physics is less than the c hance of a single sample from a Normal distribution b eing more than five standard deviations (“5 σ ”) from the mean. In other fields, arguments that most nov el discov er- ies are false [ 7 ] ha ve caused increased emphasis on re- p orting the v alue and uncertaint y of measured quan ti- ties, not just whether the v alue is statistically different from zero [ 8 , 9 ]. Researc h confirmation is then judged by ho w well independent studies agree according to their re- p orted uncertain ties, so assessing reproducibility requires accurate ev aluation and realistic understanding of these uncertain ties. This understanding is also required when analysing data, combining studies in meta-analyses, or making scientific, business, or p olicy judgments based on research. The exp erience of researc h fields such as ∗ dbailey@physics.utoron to.ca ph ysics, where v alues and uncertainties ha v e long b een regularly rep orted, ma y provide some guidance on what repro ducibilit y can reasonably b e expected [ 10 ]. Most recent in vestigations in to repro ducibilit y fo cus on how often observ ed effects disapp ear in subsequen t researc h, rev ealing strong selection bias in published re- sults. Remo ving such bias is extremely imp ortan t, but ma y not reduce the absolute n umber of false discov eries since not publishing non-significan t results does not mak e the “disco v eries” go aw a y . Con trolling the rate of false disco veries dep ends on establishing criteria that reflect real measurement uncertainties, especially the lik eliho od of extreme fluctuations and outliers [ 11 ]. Outliers are observ ations that disagree b y an abnor- mal amoun t with other measurements of the same quan- tit y . Despite ev ery scien tist kno wing that the rate of out- liers is alw a ys greater than naiv ely expected, there is no widely accepted heuristic for estimating the size or shape of these long tails. These estimates are often assumed to b e appro ximately Normal (Gaussian), but it is easy to find examples where this is clearly un true [ 12 – 14 ]. T o examine the accuracy of rep orted uncertain ties, this pap er reviews m ultiple published measuremen ts of man y differen t quantities, lo oking at the differences b et ween measuremen ts of eac h quantit y normalized by their re- p orted uncertain ties. Previous similar studies [ 15 – 20 ] re- p orted on only a few hundred to a few thousand measure- men ts, mostly in subatomic ph ysics. This study rep orts on how w ell multiple measurements of the same quantit y agree, and hence what are reasonable exp ectations for the repro ducibilit y of published scientific measuremen ts. Of particular in terest is the frequency of large disagreements whic h usually reflect unexp ected systematic effects. 2 A. Systematic effects Sources of uncertaint y are often categorized as statis- tical or systematic, and their metho ds of ev aluation clas- sified as Type A or B [ 21 ]. T yp e A ev aluations are based on observed frequency distributions; T yp e B ev aluations use other methods. Statistical uncertainties are alwa ys ev aluated from primary data using Type A methods, and can in principle b e made arbitrarily small b y rep eated measuremen t or large enough sample size. Uncertain ties due to systematic effects may b e ev alu- ated by either Type A or B methods, and fall in to sev- eral ov erlapping classes [ 22 ]. Class 1 systematics, which include man y calibration and background uncertainties, are ev aluated by Type A metho ds using ancillary data. Class 2 systematics are almost everything else that migh t bias a measurement, and are caused by a lac k of knowl- edge or uncertaint y in the measurement model, suc h as the reading error of an instrument or the uncertain ties in Monte Carlo estimates of corrections to the measure- men t. Class 3 systematics are theoretical uncertainties in the interpretation of a measurement. F or example, determining the proton radius using the Lamb shift of m uonic hydrogen requires ov er 20 theoretical corrections [ 23 ] that are potential sources of uncertaint y in the pro- ton radius, even if the actual measurement of the Lamb shift is p erfect. The uncertainties asso ciated with Class 2 and 3 systematic effects cannot b e made arbitrarily small b y simply getting more data. When considering the likelihoo d of extreme fluctu- ations in measurements, mistak es and “unknown un- kno wns” are particularly imp ortan t, but they are usually assumed to b e statistically intractable and are not often considered in traditional uncertaint y analysis. Mistak es are “unkno wn kno wns”, i.e. something that is thought to be known but is not, and it is b elieved that go od sci- en tists should not make mistakes. “Unkno wn unkno wns” are factors that affect a mea- suremen t but are unknown and unanticipated based on past exp erience and kno wledge [ 24 ]. F or example, during the first 5 y ears of op eration of LEP (the Large Electron P ositron collider), the effect of local railwa y traffic on measuremen ts of the Z 0 b oson mass was an “unknown unkno wn” that no-one thought ab out. Then improv ed monitoring revealed unexp ected v ariations in the accel- erator magnetic field, and after muc h inv estigation these v ariations w ere found to b e caused by electric rail line ground leak age curren ts flowing through the LEP v ac- uum pip e [ 25 ]. In general, systematic effects are c hallenging to estimate [ 12 , 21 , 22 , 26 – 29 ], but can b e partially con- strained by researchers making multip le internal and ex- ternal consistency chec ks: Is the result compatible with previous data or theoretical exp ectations? Is the same result obtained for different times, places, assumptions, instrumen ts, or subgroups? As describ ed by Dorsey [ 30 ], scien tists “change ev ery condition that seems by an y c hance likely to affect the result, and some that do not, in ev ery case pushing the change well b eyond any that seems at all likely”. If an inconsistency is observ ed and its cause understo od, the problem can often b e fixed and new data tak en, or the effect monitored and corrections made. If the cause cannot be identified, ho w ever, then the observed dispersion of v alues must be included in the uncertain ty . The existence of unknown systematic effects or mis- tak es may b e revealed by consistency chec ks [ 31 ], but small unkno wn systematics and mistak es are unlik ely to b e noticed if they do not affect the measuremen t b y more than the exp ected uncertaint y . Even large problems can b e missed b y chance (see Sec. IV D ) or if the conditions c hanged b et ween consistency chec ks do not alter the size of the systematic effect. The p o w er of consistency chec ks is limited by the imp ossibilit y of completely c hanging all apparatus, metho ds, theory , and researchers b et w een measuremen ts, so one can nev er b e certain that all sig- nifican t systematic effects hav e b een identified. I I. METHODS A. Data Quan tities were only included in this study if they are significan t enough to hav e warran ted at least five inde- p enden t measuremen ts with clearly stated uncertainties. Medical and health research data were extracted from some of the many meta-analyses published b y the Co c hrane collaboration [ 32 ]; a total of 5580 measure- men ts of 310 quantities generating 99433 comparison pairs were included. P article ph ysics data (8469 measure- men ts, 864 quan tities, 53988 pairs) w ere retrieved from the Review of Particle Ph ysics [ 33 , 34 ]. Nuclear physics data (12380 measuremen ts, 1437 quantities, 66677 pairs) w ere obtained from the T able of Radion uclides [ 35 ]. Most nuclear and particle physics measuremen ts hav e prior experimental or theoretical exp ectations whic h ma y influence results from nominally indep enden t exp eri- men ts [ 20 , 36 ], and medical research has similar biases [ 7 ], so this study also includes a large sample of inter- lab oratory studies that do not hav e precise prior exp ec- tations for their results. In these studies, multiple in- dep enden t lab oratories measure the same quan tity and compare results. F or example, the same mass standard migh t b e measured b y national lab oratories in different coun tries, or an unkno wn arc haeological sample might b e divided and distributed to man y labs, with eac h lab rep orting back its Carbon-14 measurement of the sam- ple’s age. None of the laboratories kno ws the exp ected v alue for the quan tity nor the results from other labs, so there should b e no exp ectation, selection, or publi- cation biases. These In terlab studies (14097 measure- men ts, 617 quantities, 965416 pairs) w ere selected from a wide range of sources in fields such as analytical chem- istry , en vironmental sciences, metrology , and toxicology . The measuremen ts ranged from genetic con tamination of 3 fo od to high precision comparison of fundamental physi- cal standards, and were carried out by a mix of national, univ ersity , and commercial lab oratories. All quan tities analysed are listed in the Supplementary Materials [ 37 ]. B. Data selection and collection Data were en tered using a v ariety of semi-automatic scripts, optical-c haracter recognition, and manual meth- o ds. No attempt w as made to recalculate past results based on curren t knowledge, or to remov e results that w ere later retracted or amended, since the original pap er w as the b est result at the time it was published. When the Review of Particle Physics [ 34 ] noted that earlier data had b een dropp ed, the missing results were retriev ed from previous editions [ 38 ]. T o ensure that measuremen ts were as independent as p ossible, measuremen ts were excluded if they were ob- viously not indep enden t of other data already included. Because relationships b et ween measurements are often obscure, how ever, there undoubtedly remain many cor- relations b etw een the published results used. Medical and health data were selected from the 8105 reviews in the Cochrane database [ 32 ] as of 25 September 2013. Data w ere analysed from 221 In terv en tion Reviews whose abstract mentioned ≥ 6 trials with ≥ 5000 total participan ts, and whic h rep orted at least one analysis with ≥ 5 studies with ≥ 3500 total participants. The av- erage heterogeneit y inconsistency index ( I 2 ≡ 1 − dof/ χ 2 ) [ 36 , 39 ] is ab out 40% for the analyses rep orted here. Be- cause analyses within a review may b e correlated, only a maxim um of 3 analyses and 5 comparison groups were in- cluded from any one review. About 80% of the Co c hrane results are the ratio of interv en tion and control bino- mial probabilities, e.g. mortalit y rates for a drug and a placeb o. Such ratios are not Normal [ 40 ], so they were con verted to differences that should b e Normal in the Gaussian limit, i.e. when the group size n and probabil- it y p are suc h that n , np , and (1 − p ) n are all >> 1, so the binomial distribution conv erges tow ards a Gaussian distribution. (The median observed v alues for these data w ere n = 100, p = 0 . 16.) The 68.3% binomial probabilit y confidence in terv al was calculated for both the interv en- tion and control groups to determine the uncertain ties. C. Uncertain ty ev aluation Measuremen ts with uncertainties are typically re- p orted as x ± u , which means that the interv al x − u to x + u con tains with some defined probability “the v alues that could reasonably be attributed to the measurand” [ 21 ]. Most frequently , uncertaint y in terv als are given as ± k u S , where k is the co v erage factor and u S is the “stan- dard uncertaint y”, i.e. the uncertaint y of a measurement expressed as the standard deviation of the exp ected dis- p ersion of v alues. Uncertainties in particle ph ysics and medicine are often instead rep orted as the bounds of ei- ther 68.3% or 95% confidence in terv als, which for a Nor- mal distribution are equiv alent to the k = 1 and 2 stan- dard uncertaint y in terv als. F or this study , all uncertainties were conv erted to nom- inal 68.3% confidence interv al uncertainties. The v ast ma jority of measuremen ts rep orted simple single uncer- tain ties, but if more than a single uncertaint y was re- p orted, e.g. “statistical” and “systematic”, they were added in quadrature. D. Normalized differences All measurements, x i ± u i , of a given quantit y w ere com bined in all possible pairs and the difference b et ween the tw o measuremen ts of each pair calculated in units of their combined uncertaint y u ij : z ij = | x i − x j | q u 2 i + u 2 j . (1) The dispersion of z ij v alues can be used to judge whether indep enden t measurements of a quantit y are “compati- ble” [ 41 ]. A feature of z as a metric for measurement agreemen t is that it do es not require a reference v alue for the quan tity . (The challenges and effects of using reference v alues are discussed in Section I I I C .) The uncertainties in Equation 1 are com bined in quadrature, as exp ected for standard uncertain ties of in- dep enden t measurements. (The effects of any lack of in- dep endence are discussed in Section II I B .) Uncertain ties based on confidence in terv als ma y not be symmetric about the rep orted v alue, which is the case for ab out 13% of Particle, 6% of Medical, 0.3% of Nuclear, and 0.06% of In terlab measurements. F ollowing common (alb eit imperfect) practice [ 42 ], if the rep orted plus and min us uncertain ties were asymmetric, z ij w as calculated from Eq. 1 using the uncertain ty for the side tow ards the other member of the comparison pair. F or example, if x 1 = 80 ± 3 2 , x 2 = 100 ± 5 4 , and x 3 = 126 ± 15 12 , then z 12 = (100 − 80) / √ 3 2 + 4 2 and z 23 = (126 − 100) / √ 5 2 + 12 2 . The distributions of the z ij differences are his- togrammed in Fig. 1 , with eac h pair weigh ted suc h that the total weigh t for a quantit y is the num b er of measure- men ts of that quan tit y . F or example, if a quan tit y has 10 measuremen ts, there are 45 possible pairs, and each en try has a weigh t of 10/45. (Other w eigh ting schemes are discussed in Section I II C .) The final frequency dis- tribution within eac h research area is then normalized so that its total observ ed probability adds up to 1. If the measuremen t uncertain ties are w ell ev aluated and corre- sp ond to Normally distributed probabilities for x , then z is exp ected to be Normally distributed with a standard deviation σ = 1. 4 Probabilit y distribution uncertainties (e.g. the v erti- cal error bars in Fig. 1 ) were ev aluated using a b ootstrap Mon te Carlo metho d where quantities were drawn ran- domly with replacement from the actual data set until the num b er of Monte Carlo quantities equaled the actual n umber of quantities. The resulting artificial data set w as histogrammed, the pro cess rep eated 1000 times, and the standard deviations of the Monte Carlo probabilities calculated for each z bin. Random selection of measuremen ts instead of quanti- ties was not chosen for uncertain ty ev aluation b ecause of the corrections then required to av oid bias and arti- facts. F or example, if measurements are randomly drawn, a quantit y with only 5 measurements will often b e miss- ing from the artificial data set for having to o few ( < 5) measuremen ts drawn, or if it does hav e 5 measurements some of them will b e duplicates generating unrealistic z = 0 v alues, or if duplicates are excluded then they will alw ays be the same 5 nonrandom measurements. With- out correcting for suc h effects, the resulting measurement Mon te Carlo generated uncertainties are too small to b e consisten t with the observ ed bin-to-bin fluctuations in Fig. 1 . Correcting for such effects requires using c harac- teristics of the actual quantities and would b e effectively equiv alent to using random quantities. E. Data fits A ttempts were made to fit the data to a wide v ari- et y of functions, but by far the best fits were to non- standardized Student-t probability density distributions with ν degrees of freedom. S ν,σ ( z ) = Γ (( ν + 1) / 2) Γ ( ν / 2) 1 √ ν π σ 1 (1 + ( z /σ ) 2 /ν ) ( ν +1) / 2 (2) A Studen t-t distribution is essentially a smo othly symmetric normalizable p o w er-law, with S ν,σ ( z ) ∼ ( z /σ ) − ( ν +1) for | z | σ √ ν . The fitted parameter σ defines the core width and o ver- all scale of the distribution and is equal to the standard deviation in the ν → ∞ Gaussian limit and to the half- width at half maximum in the ν → 1 Cauc h y (also known as Lorentzian or Breit-Wigner) limit. The parameter ν determines the size of the tails, with small ν corresp ond- ing to large tails. The v alues and standard uncertain- ties in σ and ν were determined from a non-linear least squares fit to the data that minimizes the nominal χ 2 [ 43 ]: χ 2 = N bins X i =1 ( B i − S ν,σ ( z i )) 2 u 2 B i (3) where z i , B i and u B i are the bin z , con ten ts, and uncer- tain ties of the observed z distributions sho wn in Fig. 1 . P ossible v alues of z are sometimes limited by the al- lo wed range of measurement v alues, which could suppress hea vy tails. F or example, m an y quantities are fractions that m ust lie b et ween 0 and 1, and there is less ro om for tw o measurements with 10% uncertaint y to disagree b y 5 σ than for tw o 0.01% measurements. The size of this effect was estimated using Monte Carlo methods to generate simulated data based on the v alues and uncer- tain ties of the actual data, constrained b y any ob vious b ounds on their allo wed v alues. The sim ulated data was then fit to see if applying the b ounds changed the fit- ted v alues for σ and ν . The largest effect was for Med- ical data where ν w as reduced by ab out 0.1 when mini- mally restrictive b ounds w ere assumed. Stronger b ounds migh t exist for some quan tities, but determining them w ould require careful measuremen t-b y-measurement as- sessmen t b ey ond the scope of this study . F or example, eac h measuremen t of the long-term duration of the ef- fect of a medical drug or treatmen t would ha ve an upp er b ound set by the length of that study . Since correcting for bounds can only make ν smaller (corresp onding to ev en heavier tails), and the observed effects were neg- ligible, no corrections were applied to the v alues of ν rep orted here. I II. RESUL T S A. Observ ed distributions Histograms of the z distributions for different data sets are shown in Fig. 1 . The complementary cumulativ e dis- tributions of the data are giv en in T able I and sho wn in Fig. 2 . None of the data are close to Gaussian, but all can rea- sonably b e describ ed by almost-Cauch y Studen t-t distri- butions with ν ∼ 2 − 3. F or comparison, fits to these data with L´ evy stable distributions ha ve nominal χ 2 4 to 30 times w orse than the fits to Student-t distributions. The n umber of “5 σ ” (i.e. z > 5) disagreements observed is as high as 0 . 12, compared to the 6 × 10 − 7 exp ected for a Normal distribution. The fitted v alues for ν and σ are shown in T able I I . Also sho wn in T able I I are t wo data subsets exp ected to b e of higher quality , BIPM Interlaboratory Key comparisons (372 quantities, 3712 measurements, 20245 pairs) and Stable Particle prop erties (335 quantities, 3041 measure- men ts, 16649 pairs). The Key comparisons [ 44 ] should define state-of-the-art accuracy , since they are measure- men ts of imp ortan t metrological standards carried out b y national laboratories. Stable particles are often eas- ier to study than other particles, so their prop erties are exp ected to b e better determined. Both “b etter” data subsets do hav e narrow er distributions consistent with higher qualit y , but they still ha ve heavy tails. More se- lected data subsets are discussed in Section I I I D . The probabilit y distribution for the nominal χ 2 statis- tic is not expected to b e an exact regular χ 2 distribution. The differences are due to the non-Gaussian uncertain- ties of the lo w-p opulation high- z bins, and because the 5 FIG. 1: Histograms of uncertain ty normalized differences ( z ij from Eq. 1 ) p er unit of z. Horizontal and vertical error bars are the bin width and the standard uncertaint y ev aluated by a b ootstrap Mon te Carlo. The smo oth curves are b est-fit Student-t distributions. The dashed curves are Normal distributions. T ABLE I: Observ ed c hance of exp erimen tal disagreemen t by more than z standard uncertainties for different data sets, com pared to v alues expected for some theoretical distributions. Also listed are the z v alues that b ound 95% of the distribution, i.e. p true = 0 . 05, and p v alues for that z for a Normal distribution. z > 1 2 3 5 10 z 0 . 95 p N or mal ( z 0 . 95 ) In terlab 0 . 58 0 . 35 0 . 23 0 . 12 0 . 042 9 . 0 2 × 10 − 19 (Key) 0 . 46 0 . 23 0 . 13 0 . 062 0 . 016 5 . 7 1 × 10 − 8 Nuclear 0 . 38 0 . 16 0 . 082 0 . 033 0 . 009 4 . 0 6 × 10 − 5 P article 0 . 41 0 . 16 0 . 075 0 . 024 0 . 004 3 . 7 2 × 10 − 4 (Stable) 0 . 31 0 . 091 0 . 033 0 . 007 0 . 0005 2 . 5 1 × 10 − 2 Medical 0 . 47 0 . 18 0 . 074 0 . 020 0 . 003 3 . 5 4 × 10 − 4 Constan ts 0 . 42 0 . 22 0 . 14 0 . 078 0 . 029 7 . 2 6 × 10 − 13 Normal (Gaussian) 0 . 32 0 . 046 0 . 0027 5 . 7 × 10 − 7 1 . 5 × 10 − 23 1 . 96 5 × 10 − 2 Studen t-t ( ν = 10) 0 . 34 0 . 073 0 . 013 5 . 4 × 10 − 4 1 . 6 × 10 − 6 2 . 23 2 . 6 × 10 − 2 Exp onen tial 0 . 37 0 . 14 0 . 050 0 . 007 4 . 5 × 10 − 5 3 . 0 2 . 7 × 10 − 3 Studen t-t ( ν = 2) 0 . 42 0 . 18 0 . 095 0 . 038 0 . 010 4 . 3 2 × 10 − 15 Cauc hy 0 . 50 0 . 30 0 . 20 0 . 13 0 . 063 12 . 8 2 × 10 − 37 bin conten ts are not indep enden t since a single measure- men t can con tribute to multiple bins as part of different p erm utation pairs. Based on fits of simulated data sets with a mix of ν comparable to the observed data, the range of nominal χ 2 rep orted in T able I I seems reason- able, i.e. the chances of χ 2 /dof ≤ 0 . 6 or ≥ 1 . 9 were 15% and 2% resp ectiv ely . T o see if more imp ortan t quan tities are measured with less disagreemen t, a small additional data set of mea- suremen ts of fundamental ph ysical constan ts (7 quan ti- ties, 320 measurements, 9098 pairs) w as also analysed. The constants are Av ogadro’s n umber, the fine structure 6 T ABLE I I: Fitted Studen t-t parameters with nominal χ 2 p er degree-of-freedom. Also shown are parameters for quan tities with ≥ 10 measurements, for new er measurements made since the year 2000, and for the approximate distribution of individual measuremen ts. Uncertain ties not shown for σ 10 , σ new , ν x and σ x are . 0 . 1. ν σ χ 2 /dof ν 10 σ 10 ν new σ new ν x σ x In terlab 1 . 64 ± 0 . 05 1 . 62 ± 0 . 05 1 . 1 1 . 6 ± 0 . 1 1 . 7 1 . 6 ± 0 . 1 1 . 7 1 . 5 1 . 3 Key 1 . 90 ± 0 . 10 1 . 12 ± 0 . 04 1 . 9 1 . 7 ± 0 . 1 1 . 1 1 . 9 ± 0 . 1 1 . 2 1 . 7 0 . 9 Nuclear 1 . 99 ± 0 . 06 0 . 90 ± 0 . 02 1 . 6 2 . 4 ± 0 . 2 1 . 1 2 . 1 ± 0 . 2 0 . 9 1 . 8 0 . 7 P article 2 . 75 ± 0 . 10 1 . 05 ± 0 . 02 1 . 5 2 . 8 ± 0 . 1 1 . 1 2 . 6 ± 0 . 2 1 . 0 2 . 4 0 . 9 Stable 3 . 45 ± 0 . 16 0 . 86 ± 0 . 02 0 . 6 3 . 8 ± 0 . 4 0 . 9 7 . 6 ± 1 . 3 0 . 9 2 . 9 0 . 8 Medical 3 . 30 ± 0 . 11 1 . 18 ± 0 . 02 0 . 7 3 . 3 ± 0 . 1 1 . 2 3 . 2 ± 0 . 2 1 . 2 2 . 8 1 . 0 Constan ts 1 . 81 ± 0 . 15 0 . 89 ± 0 . 06 0 . 8 1 . 8 ± 0 . 2 0 . 9 1 . 3 ± 0 . 3 1 . 1 1 . 7 0 . 7 Normal ∞ 1 . 0 ∞ 1 . 0 Cauc hy 1 . 0 √ 2 ∗ 1 . 0 1 . 0 ∗ F or uncertainties added in quadrature FIG. 2: The observed probability of tw o measuremen ts disagreeing by more than z standard uncertainties for differen t data sets: R ∞ z P ( x ) dx . (See also T able I ) constan t, the Planck constan t, Newton’s gravitational constan t, the deuteron binding energy , the Rydb erg con- stan t, and the sp eed of ligh t (b efore it became a defined constan t). These measuremen ts hav e very heavy tails, despite their imp ortance in physical science. Quantities with more interest do not seem to b e b etter measured, as is also sho wn b y considering only quan tities with at least 10 published measurements, which do not hav e sig- nifican tly smaller tails (see σ 10 , ν 10 in T able I I ). Fig. 1 shows that the comparison pairs z ij are Studen t- t distributed, but what do es this imply ab out the disp er- sion of individual x i measuremen ts? Except for the ν = 1 and ∞ Cauch y and Normal limits, the distribution of dif- ferences of v alues selected from a Studen t-t distribution is not itself a t distribution, but it can b e closely approx- imated as one [ 45 ]. The distributions of the paren t indi- vidual x measuremen ts were estimated b y Mon te Carlo decon volution. Artificial measurements were generated from t distributions with parameters ν x and σ x , and these measuremen ts com bined into p erm utation pairs to gen- erate an artificial z distribution. This distribution was compared to the observ ed z distributions, and then ν x and σ x w ere iterativ ely adjusted until the b est match was ac hieved betw een the artificial and observed z distribu- tions. As shown in T able I I , the appro ximate Studen t-t parameters ( ν x , σ x ) of the individual measuremen t pop- ulations ha ve ν x < ν and hence are sligh tly more Cauch y- lik e than the p erm utation pairs distributions. B. Com bined uncertaint y The definition of z by Equation 1 assumes that the measuremen ts x i and x j are indep enden t and that the uncertain ties u i and u j can b e com bined following the rules for standard uncertain ties. If x i and x j are correlated, ho wev er, Equation 1 should b e replaced b y z ij = | x i − x j | q u 2 i − 2cov( x i , x j ) + u 2 j . (4) where cov( x i , x j ) is the co v ariance of x i and x j [ 21 ]. It is not in general possible to quantitativ ely ev alu- ate the co v ariance for individual pairs of measuremen ts in the data sets, but the effects of an y correlations are not exp ected to b e large, and they cannot explain the observ ed heavy tails. An y p ositiv e cov ariance w ould de- crease the denominator in Eq. 4 and increase the width of the z distributions. Correlations b et ween measure- men ts are exp ected to b e muc h more likely p ositive than negativ e, but even perfect anti-correlation could only de- crease z v alues by at most a factor of 1 / √ 2 compared to the uncorrelated case. (i.e. Changing cov( x i , x j ) from 0 to − u i u j in Eq. 4 reduces z ij b y √ 2 if u i = u j , and less if u i 6 = u j .) Correlations are further discussed in Section I I I F . 7 Another p ossible issue with Equation 1 is that its usual deriv ation assumes that u i and u j are standard devia- tions of the expected disp ersion of p ossible v alues (e.g. see Sec. E.3.1 of Ref. [ 21 ]). This assumption is a concern since the standard deviation is an undefined quantit y for Studen t-t distributions if ν < 2, and the observ ed z and inferred x distributions hav e ν near or b elo w this v alue. Ev en if the v ariance of a distribution is undefined, ho w- ev er, the disp ersion of the difference of tw o indep enden t v ariables dra wn from suc h distributions ma y still b e cal- culated numerically and in some cases analytically . Cauc hy uncertainties add linearly instead of in quadra- ture, since the distribution of differences of t wo v ariables dra wn from tw o Cauch y distributions with widths σ 1 and σ 2 is simply another Cauch y distribution with width σ dif f = σ 1 + σ 2 . The corresp onding definition of z w ould b e z C auchy ij = | x i − x j | u i + u j . (5) Almost-Cauc hy distributions should almost follow the rules for combination of Cauch y ( ν = 1) distributions. Applying Equation 5 to the data pro duces z distribu- tions that app ear almost identical to those in Fig. 1 , except that the fitted v alues of σ for Interlab, Nu- clear, Particle, Medical data are smaller by factors of 0 . 78 , 0 . 80 , 0 . 75 , 0 . 74, while the the fitted v alues of ν are almost unc hanged ( ν linear /ν q uad = 0 . 99 , 1 . 00 , 0 . 98 , 0 . 94). The scale factor for σ w ould b e 1 / √ 2 = 0 . 71 if all mea- suremen ts of a quan tity had equal uncertainties ( u i = u j ), since switching from quadrature (Eq. 1 ) to linear (Eq. 5 ) w ould simply scale all the calculated z v alues b y 1 / √ 2 and not affect ν . Similarly , if data with equal ν = 1 , σ = 1 Cauch y uncertainties w ere analysed using Equation 1 , the resulting p erm utation pairs would hav e ν = 1 , σ = √ 2, as shown in the last line of T able II . C. Alternate weigh ting sc hemes and compatibility measures There are several wa ys to w eigh t data in the distribu- tion plots, but the fitted parameter v alues are not usually greatly affected b y the c hoice (see T able I I I ). The default metho d was to giv e eac h measuremen t equal weigh t (“M” in T able I II ). Jeng [ 20 ] gav e equal w eight to all measure- men t pairs (“P”), but this giv es extreme weigh t to quan- tities with a large n umber ( N ) of measurements since the n um b er of p erm utations gro ws as ( N − 1) N / 2. Giv- ing each quan tity equal weigh t (“Q”) also seems less fair, since a quantit y measured many times will b e weigh ted the same as a quantit y measured only a few times. Instead of using measuremen t pairs to study com- patibilit y , Ro os et al. [ 16 ] instead calculated the w eigh ted mean for eac h quan tity , and then plotted the distribution of the uncertaint y-normalized difference (“h”) from that T ABLE I II: Fitted Studen t-t parameters for w eighting b y Quan tities (Q), Measurements (M, the default), P ermutations (P), or using difference from weigh ted mean (h). ν σ χ 2 /dof In terlab Q 1 . 65 ± 0 . 12 1 . 35 ± 0 . 08 4 . 0 M 1 . 64 ± 0 . 05 1 . 62 ± 0 . 05 1 . 1 P 1 . 70 ± 0 . 04 1 . 76 ± 0 . 05 0 . 3 h 1 . 09 ± 0 . 08 2 . 06 ± 0 . 13 1 . 3 Nuclear Q 1 . 93 ± 0 . 07 0 . 85 ± 0 . 02 1 . 8 M 1 . 99 ± 0 . 06 0 . 90 ± 0 . 02 1 . 6 P 2 . 19 ± 0 . 07 0 . 98 ± 0 . 03 1 . 4 h 1 . 82 ± 0 . 06 0 . 95 ± 0 . 02 1 . 4 P article Q 2 . 76 ± 0 . 11 1 . 01 ± 0 . 02 1 . 6 M 2 . 75 ± 0 . 10 1 . 05 ± 0 . 02 1 . 5 P 2 . 91 ± 0 . 09 1 . 14 ± 0 . 02 1 . 0 h 2 . 26 ± 0 . 12 1 . 10 ± 0 . 03 1 . 5 Medical Q 3 . 44 ± 0 . 16 1 . 24 ± 0 . 02 1 . 2 M 3 . 30 ± 0 . 11 1 . 18 ± 0 . 02 0 . 7 P 3 . 59 ± 0 . 12 1 . 17 ± 0 . 03 0 . 4 h 3 . 00 ± 0 . 18 1 . 21 ± 0 . 04 0 . 8 mean for each measurement, i.e. h i = | x i − ¯ x | p u 2 i + u 2 ¯ x (6) where ¯ x = P i ( x i /u i ) 2 P i 1 /u 2 i and 1 u 2 ¯ x = X i 1 u 2 i (7) h is v ery similar to interlaboratory comparison ζ -scores [ 46 ], which are the standard uncertain ty normalized dif- ferences b et ween measuremen ts and an externally as- signed v alue for the quan tity . The problem with using actual ζ -scores is that they dep end on ha ving assigned v alues for the quan tit y independent of the measurements. Suc h v alues are not usually av ailable for the quantities studied here, so any assigned v alue must b e determined from the measuremen ts themselves, and such “consen- sus v alues” can be problematic [ 46 ]. The particular is- sue with h is whether the w eigh ted mean ¯ x is the best assigned v alue for a quantit y given all the av ailable mea- suremen ts. This is a reasonable assumption if the uncer- tain ties are Normal, since then ¯ x from Equation 7 is the maxim um lik eliho od v alue for x [ 16 ]. If the uncertainties are not Normal, how ever, ¯ x may b e far from maximum lik eliho od, so it is not clear if ¯ x is the b est choice for 8 the assigned v alue. Because of these issues, z was pre- ferred ov er h in this study , but the h and z distributions are very similar. As can b e seen from T able II I , the fit qualit y and parameter v alues are comparable for h and z distributions, except the tails app ear ev en hea vier in h . D. Selected data subsets T o further inv estigate the v ariance in the distributions for differen t t yp es of measurements, several additional data subsets were examined and their parameters listed in T able IV . The Key Metrology data subset is for electrical, ra- dioactivit y , length, mass, and other similar physical metrology standards. T o see if the most exp erienced national lab oratories were more consistent, T able IV also lists Selected Metrology data from only the six na- tional labs that rep orted the most Key Me trology mea- suremen ts. These lab oratories w ere PTB (Physik alisch- T echnisc he Bundesanstalt, German y), NMIJ (National Metrology Institute of Japan), NIST (National Insti- tutes of Standards and T echnology , USA), NPL (Na- tional Ph ysical Lab oratory , UK), NRC (National Re- searc h Council, Canada), and LNE (Laboratoire national de m ´ etrologie et d’essais, F rance). Similarly , Key Ana- lytical chemistry data selected from the same national labs are also sho wn. These are for measurements such as the amount of mercury in salmon, PCBs in sediment, or c hromium in steel. The metrology measuremen ts b y the selected national lab oratories do hav e muc h lighter tails with ν ∼ 10, but this is not the case for their analytical measuremen ts where ν ∼ 2. New Stable particle data hav e the lightest tail in T a- ble I I , but it is not clear if this is b ecause the new er results hav e better determined uncertainties or are just more correlated. The trend in particle ph ysics is for few er but larger exp erimen ts, and more than a third of the new er Stable measurements were made b y just t wo very similar experiments (BELLE and BaBar), so the New Stable data is split into tw o groups in T able IV . There is no significant difference b et ween the BELLE/Babar and Other exp eriments data. Nuclear lifetimes with small and large relative uncer- tain ties w ere compared. They ha ve similar tails, but the smaller uncertaint y measuremen ts app ear to underesti- mate their uncertaint y scales. Measuremen ts of Newton’s gra vitation constant are notoriously v ariable [ 14 , 47 ], so a data-set without G N results was examined. The heavy tail is reduced, albeit with large uncertaint y . E. Relativ e uncertaint y The accuracy of uncertaint y ev aluations app ears to b e similar in all fields, but unsurprisingly there are notice- able differences in the relativ e sizes of the uncertain ties. In particular, although individual physics measurements are not typically more repro ducible than in medicine, they often hav e smaller relativ e uncertaint y (i.e. uncer- tain ty/v alue) as shown in Fig. 3 . FIG. 3: Distribution of the relative uncertaint y for data from Fig. 1 . FIG. 4: Median ratio of the relative uncertain ties (new er/older) for measurements in each z pair as a function of the y ears betw een the tw o measurements: Medical (brown circles), Particle (green triangles), Nuclear (red squares), Stable (green dashed p oin t-down triangles), Constants (orange diamonds). P erhaps more importantly for discov ery repro ducibil- it y , uncertaint y improv es more rapidly in ph ysics than in medicine, as is shown in Fig. 4 . This difference in rates of improv ement reflects the difference b et w een measure- men ts that dep end on steadily ev olving technology versus those using stable metho ds that are limited by sample sizes and heterogeneit y [ 48 ]. The expectation of reduced uncertain ty in ph ysics means that it is feasible to tak e a w ait-and-see attitude to wards new disco veries, since b et- ter measuremen ts will quic kly confirm or refute the new result. Measurement uncertain t y in Nuclear and Particle 9 T ABLE IV: Fitted Student-t parameters for selected data, with n um b er of quan tities, measuremen ts, and comparison pairs. ν σ Quan t. Meas. Pairs Key 1 . 9 ± 0 . 1 1 . 12 ± 0 . 04 372 3714 20308 Key Metrology 3 . 2 ± 0 . 2 0 . 94 ± 0 . 02 197 2030 12070 Selected Metrology 9 . 9 ± 2 . 6 0 . 90 ± 0 . 03 156 575 948 Key Analytical 1 . 9 ± 0 . 2 1 . 62 ± 0 . 13 133 1238 5938 Selected Analytical 2 . 1 ± 0 . 3 1 . 39 ± 0 . 08 127 503 848 New Stable (since 2000) 7 . 6 ± 1 . 3 0 . 90 ± 0 . 03 357 1278 2478 BABAR/BELLE Stable 6 . 7 ± 2 . 1 0 . 91 ± 0 . 04 172 435 468 Other New Stable 5 . 3 ± 0 . 8 0 . 79 ± 0 . 03 209 752 1395 Nuclear 2 . 0 ± 0 . 1 0 . 90 ± 0 . 02 1437 12380 66677 Lifetimes 2 . 1 ± 0 . 2 1 . 30 ± 0 . 09 152 1560 9779 u x /x > 0 . 005 2 . 2 ± 0 . 2 1 . 04 ± 0 . 06 125 759 3123 u x /x < 0 . 005 2 . 8 ± 0 . 5 1 . 89 ± 0 . 22 110 772 3503 Constan ts 1 . 8 ± 0 . 2 0 . 89 ± 0 . 06 7 320 9098 Constan ts without G 3 . 2 ± 0 . 5 0 . 99 ± 0 . 11 6 231 5182 ph ysics t ypically impro v es b y about a factor of 2 every 15 years. Constants data impro ve t wice as fast, whic h is unsurprising since more effort is exp ected for more im- p ortan t quantities. Ph ysicists also tend not to make new measurements unless they are exp ected to be more accurate than pre- vious measuremen ts. In the data sets reported here, the median improv ement in uncertaint y of Nuclear measure- men ts compared to the b est previous measuremen t of the same quan tity is u best /u new = 2 . 0 ± 0 . 3, and the impro ve- men t factors for Constan ts, P article, and Stable measure- men ts are 1 . 8 ± 0 . 3, 1 . 7 ± 0 . 2, and 1 . 3 ± 0 . 1. In contrast, Medical measurements t ypically hav e greater uncertain- ties than the best previous measuremen ts, with median u best /u new = 0 . 62 ± 0 . 03. This is an understandable con- sequence of different uncertaint y to cost relationships in ph ysics and medicine. Study p opulation size is a ma jor cost driv er in medical research, so reducing the uncer- tain ty by a factor of tw o can cost almost four times as m uch, which is rarely the case in physics. F. Exp ectations and correlations Prior expectations exist for most measuremen ts re- p orted here except for the In terlab data. Such exp ec- tations ma y suppress heavy tails by discouraging publi- cation of the anomalous results that p opulate the tails, since b efore publishing a result dramatically different from prior results or theoretical exp ectations, researc hers are lik ely to make great efforts to ensure that they ha ve not made a mistake. Journal editors, referees and other readers also ask tough questions of such results, either prev enting publication or inducing further in v estigation. F or example, initial claims [ 49 , 50 ] of 6 σ evidence for faster-than-ligh t neutrinos and cosmic inflation did not surviv e to actual publication [ 51 , 52 ]. FIG. 5: Median z v alue as a function of time difference b et ween the tw o measurements in eac h z pair: Medical (bro wn circles), Particle (green p oin t-up triangles), Nuclear (red squares), Constan ts (orange diamonds), and Stable (green dashed p oint-do wn triangles). Fig. 5 shows that Ph ysics (Particle, Nuclear, Con- stan ts) measuremen ts are more likely to agree if the dif- ference in their publication dates is small. Such “band- w agon effects” [ 20 , 36 ] are not observ ed in the Medical data, and they are irrelev an t for In terlab quantities whic h are usually measured alm ost simultaneously . These cor- relations imply that measurements are biased either b y exp ectations or common metho dologies. Such correla- tions migh t explain the small ( < 1) v alues of σ x for Nu- clear, P article, and Constan ts data, or it could b e that researc hers in these fields simply tend to ov erestimate the scale of their uncertainties [ 53 ]. Removing exp ecta- tion biases from the Ph ysics data w ould lik ely make their tails heavier. 10 Although Interlab data are not supp osed to hav e any exp ectation biases, they are sub ject to metho dological correlations due to common measurement mo dels, pro- cedures, and types of instrumentation, so even their tails w ould likely increase if all measurements could be made truly indep endent. IV. DISCUSSION A. Comparison with earlier studies In a famous dispute with Cauch y in 1853, eminent statistician Ir ´ en´ ee-Jules Biena ym ´ e ridiculed the idea that an y sensible instrument had Cauch y uncertainties [ 54 ]. A century later, how ever, Harold Jeffreys noted that sys- tematic errors may hav e a significant Cauch y comp onen t, and that the scale of the uncertaint y con tributed by sys- tematic effects dep ends on the size of the random errors [ 55 ]. The results of this study agree with earlier researc h that also observed Student-t tails, but only lo ok ed at a handful of subatomic or astroph ysics quan tities up to z ∼ 5 − 10 [ 16 , 19 , 56 – 58 ]. Unsurprisingly , the tails rep orted here are mostly hea vier than those rep orted for rep eated measuremen ts made with the same instrumen t ( ν ∼ 3 − 9) [ 59 – 61 ], which should b e closer to Normal since they are not indep endent and share most systematic effects. Instead of Student-t tails, exp onen tial tails hav e been rep orted for sev eral n uclear and particle ph ysics data sets [ 15 , 17 , 18 , 20 ], but in all cases some measurements were excluded. F or example, the largest of these studies [ 20 ] lo ok ed at particle data (315 quan tities, 53322 pairs) using essen tially the same metho d as this paper, but rejected the 20% of the data that gav e the largest con tributions to the χ 2 for each quan tity , suppressing the heaviest tails. Despite this data selection, all these studies ha ve supra- exp onen tial heavy tails for z & 5, and so are qualitatively consisten t with the results of this pap er. It is possible that av eraging differen t quantities with exp onen tial tails migh t pro duce apparent pow er-laws [ 62 ], but this would require wild v ariations in the accuracy of the uncertain ty estimates. Instead of lo oking directly at the shapes of the mea- suremen t consistency distributions, Hedges [ 10 ] com- pared particle physics and psyc hology results and found them to hav e similar compatibility , with typically almost half of the quantities in b oth fields having statistically significan t disagreemen ts. Thompson and Ellison rep orted substantial amounts of “dark uncertaint y” in c hemical analysis interlabora- tory comparisons [ 63 ]. Uncertaint y is “dark” if it do es not app ear as part of the known contributions to the un- certain ty of individual measuremen ts, but is inferred to exist because the dispersion of measured v alues is greater than exp ected based on the rep orted uncertain ties. F or example, six (21%) of 28 BIPM Key Comparisons stud- ied had ratios ( ¯ s exp /s obs ) of exp ected to observed stan- dard deviations less than 0.2. This agrees with the Key Analytical results in T able IV (whic h include some of the same Key Comparisons). F or sample sizes matc h- ing the 28 Comparisons, 20% of samples dra wn from a ν = 2 , σ = 1 . 4 Student-t distribution w ould b e expected to ha ve ¯ s exp /s obs < 0 . 2. Pa vese also noted the high rate of inconsistent Key Comparison measuremen ts [ 64 ]. The Op en Science Collab oration (OSC) recently repli- cated 100 studies in psychology [ 65 ], providing some of the most direct evidence yet for p oor scientific repro- ducibilit y . Using the OSC study’s supplementary infor- mation, z can b e calculated for 87 of the rep orted orig- inal/replication measuremen t pairs, and 27 (31%) dis- agree b y more than 2 σ , and 2 (2.3%) by more than 5 σ . This rate of disagreements is inconsistent with selection bias acting on a Normal distribution unless the > 5 σ data are excluded, but can b e explained by selection biased Studen t-t data with ν ∼ 3, consistent with the Medical data rep orted in T able II . B. Ho w measurements fail When a measuremen t turns out to b e wrong, the rea- sons for this failure are often unkno wn, or at least un- published, so it is in teresting to lo ok at examples where the causes were later understoo d or can b e inferred. F or medical research, heterogeneit y in metho ds or p op- ulations is a ma jor source of v ariance. The largest in- consistency in the Medical dataset is in a comparison of fev er rates after acellular versus whole-cell p ertussis v ac- cines [ 66 ]. The large v ariance can likely b e explained by significan t differences among the study p opulations and esp ecially in ho w minor adverse even ts were defined and rep orted. The biggest z v alues in the Particle data come from complicated multi-c hannel partial wa ve analyses of strong scattering pro cesses, where man y dozens of quan- tities (particle masses, widths, helicities, . . . ) are sim ul- taneously determined. Significan t correlations often exist b et ween the fitted v alues of the parameters but are not alw ays clearly rep orted, and ev aluations may not alwa ys include the often large uncertainties from choices in data and parameterization. The largest disagreemen t in the In terlab data app ears to b e an obvious mistak e. In a comparison of radioac- tivit y in water [ 67 ], one lab rep orted an activity of 139352 ± 0 . 82 Bq/kg when the true v alue was ab out 31. Even without knowing the exp ected activity , the un- reasonably small fractional uncertaint y should probably ha ve flagged this result. Such gross errors can pro duce almost-Cauc hy deviations. F or example, if the n umeri- cal result of a measurement is simply considered as an infinite bit string, then any “typographical” glitc h that randomly flips any bit with equal probability will pro duce deviations with a 1 /x distribution. One can hope that the b est researc h will not be slopp y , but not even the most careful scientists can av oid all 11 unpleasan t surprises. In 1996 a team from PTB (the National Metrological Institute of Germany) rep orted a measuremen t of G N that differed b y 50 σ from the ac- cepted v alue; it to ok 8 years to track down the cause – a plausible but erroneous assumption ab out their elec- trostatic torque transmitter unit [ 68 ]. A 6 . 5 σ difference b et ween the CODA T A2006 and COD A T A2010 fine struc- ture constan t v alues was due to a mistak e in the calcula- tion of some eighth-order terms in the theoretical v alue of the electron anomalous magnetic momen t [ 69 ]. A 1999 determination [ 70 ] of Av ogadro’s n umber b y a team from Japan’s National Research Lab oratory of Metrology us- ing the newer x-ray crystal density metho d w as off b y ∼ 9 σ due to subtle silicon inhomogeneities [ 71 ]. In an in- terlab oratory comparison measuring PCB con tamination in sediments, the initial measurement by BAM (the Ger- man F ederal Institute for Materials Research and T est- ing) disagreed b y man y standard uncertainties, but this w as later traced to cross-contamination in sample prepa- ration [ 72 ]. Several nuclear half-lives measured by the US National Institute for Standards and T echnology were kno wn for some years to b e inconsistent with other mea- suremen ts; it was finally disco vered that a NIST sample p ositioning ring had been slowly slipping o v er 35 years of use [ 73 ]. Often discrepancies are nev er understo od and are sim- ply replaced b y newer results. F or example, despite bringing in a whole new research team to go o ver every comp onen t and system, the reason for a discordan t NIST measuremen t of Planck’s constan t was never found, but new er measuremen ts b y the same group w ere not anoma- lous [ 74 ]. C. Causes of heavy tails Hea vy tails hav e many potential causes, including bias [ 7 ], ov erconfiden t uncertaint y underestimates [ 75 ], and uncertain ty in the uncertainties [ 17 ], but it is not imme- diately ob vious how these would pro duce the observ ed t distributions with so few degrees of freedom. Ev en when the uncertaint y u is ev aluated from the standard deviation of multiple measuremen ts from a Nor- mal distribution so that a Studen t-t distribution would b e exp ected, there are t ypically so man y measurements that ν should b e m uch larger than what is observed. Ex- ceptions to this are when calibration uncertainties dom- inate, since often only a few indep enden t calibration p oin ts are av ailable, or when uncertainties from syste m- atic effects are ev aluated by making a few v ariations to the measurements, but these cannot explain most of the data. An y reasonable publication bias applied to measure- men ts with Gaussian uncertainties cannot create very hea vy tails, just a distorted distribution with Gaussian tails – to pro duce one false published 5 σ result would require bias strong enough to reject millions of studies. Underestimating σ do es not pro duce a heavy tail, only a broader Normal z distribution. Mixing multiple Normal distributions do es not naturally pro duce almost-Cauc h y distributions, except in sp ecial cases suc h as the ratio of t wo zero-mean Gaussians. The heavy tails are not caused by p oor older results. The hea viest-tailed data in Fig. 1 are actually the new est – 93% of the in terlab oratory data are less than 16 y ears old – and eliminating older results tak en prior to the y ear 2000 do es not reduce the tails for most data as shown in T able I I . In tentionally making up results, i.e. fraud, could cer- tainly produce outliers, but this is unlik ely to b e a signifi- can t problem here. Since most of the data w ere extracted from secondary meta-analyses (e.g. Review of Parti- cle Prop erties, T able of Radion uclides, and Co c hrane Systematic Reviews), results withdra wn for misconduct prior to the time of the review would lik ely b e excluded. One meta-analysis in the Medical dataset do es include studies that were later sho wn to be fraudulent [ 76 ], but the fraudulen t results actually contribute slightly less than av erage to the ov erall v ariance among the results for that meta-analysis. D. Mo delling Mo delling the heavy tails may help us understand the observ ed distributions. One w ay is to assume that the measuremen t v alues are normally distributed with stan- dard deviation t that is unkno wn but whic h has a prob- abilit y distribution f ( t ) [ 15 , 17 – 19 , 77 ]. The measured v alue x is then exp ected to ha v e a probability distribu- tion P ( x ) = Z ∞ 0 dtf ( t ) 1 √ 2 π t e − x 2 / (2 t 2 ) . (8) This is essen tially a Bay esian estimate with prior f ( t ) and a Normal lik eliho od with unknown v ariance. If the uncertain ties are accurately ev aluated and Normal with v ariance σ 2 , f ( t ) will b e a narrow p eak at t = σ . As- suming that f ( t ) is a broad Normal distribution leads to exp onen tial tails [ 17 ] for large z . In order to generate Student-t distributions, f ( t ) must b e a scaled in verse chi-squared (or Gamma) distribution in t 2 [ 19 , 77 ]. This w orks mathematically , but wh y w ould v ariations in σ for indep enden t measurements hav e such a distribution? Hea vy tails can only b e generated by effects that can pro duce a wide range of v ariance, so we must mo del how consistency testing is used b y researchers to constrain suc h effects. Consistency is t ypically tested using a met- ric such as the calculated c hi-squared statistic for the agreemen t of N measurements x i [ 43 ] χ 2 c ( x, u ) = N X i =1 ( x i − ¯ x ) 2 u 2 i (9) where ¯ x is the x i w eighted mean and u i are the standard uncertain ties reported by the researc hers. F or accurate 12 standard uncertainties, χ 2 c will hav e a chi-squared proba- bilit y distribution with ν = N − 1. If, ho wev er, the reported uncertain ties are incorrect and the true standard uncer- tain ties are tu i , then it will b e χ 2 true ( x, tu ) = χ 2 c ( x, u ) /t 2 that is chi-squared distributed. Researc hers will likely search for problems if different consistency measurements ha ve a po or χ 2 c ( x, u ), which t ypically means χ 2 c ( x, u ) > ν . The larger an unknown systematic error is, the more likely it is to b e detected and either corrected or included in the rep orted uncertain ty , so published results t ypically hav e χ 2 c ( x, u ) ∼ ν . Since χ 2 c ( x, u ) /t 2 is exp ected to hav e a chi -squared distribu- tion, a natural prior for t 2 is indeed the scaled inv erse c hi- squared distribution needed to generate Student-t distri- butions from Equation 8 . More mec hanistically , it could be assumed that a Nor- mally distributed systematic error will be missed by N m indep enden t measurements if their χ 2 ( u ) = ( t 2 /u 2 ) χ 2 ( t ) is less than some threshold χ 2 max ∼ ν = N m − 1. If the distribution of all p ossible systematic effects is P 0 ( t ), then the probability distribution for the unfound errors will b e f ( t ; ν ) = P 0 ( t ) F ( χ 2 max /t 2 ; ν ) (10) where F is the cumulativ e χ 2 distribution. P 0 ( t ) is un- kno wn, but a common Ba yesian scale-inv arian t choice is P 0 ( t ) ∝ 1 /t α , with α > 0. Using this mo del with the rep orted uncertaint y σ as the lo wer integration b ound, the curve generated from Equations 8 and 10 is very close to a ν = N m − 1 + α Studen t-t distribution. The observed small v alues for ν mean that b oth N m and α m ust b e small. Making truly indep enden t consistency tests is difficult, so it is not surprising that the effective n umber of chec ks ( N m ) is usually small. This mo del is plausible, but why are systematic effects consisten t with a P 0 ( t ) ∝ 1 /t α p o wer-la w size distribu- tion? E. Complex systems Scien tific measurements are made by complex systems of p eople and pro cedures, hardw are and softw are, so one w ould exp ect the distribution of scientific errors to b e similar to those pro duced by other comparable systems. P ow er-law b eha viour is ubiquitous in complex sys- tems [ 78 ], with the cum ulative distributions of observed sizes ( s ) for many effects falling as 1 /s α , and these hea vy tails exist even when the system has b een designed and refined for optimal results. A Student-t distribution has cumulativ e tail exp onen t α = ν , and the v alues for ν rep orted here are consis- ten t with p o wer-la w tails observ ed in other designed com- plex systems. The frequency of soft ware errors typically has a cumulativ e p o wer-la w tail corresp onding to small ν ∼ 2 − 3 [ 79 ], and in scien tific computing these errors can lead to quantitativ e discrepancies orders of magni- tude greater than exp ected [ 80 ]. The size distribution of electrical p o w er grid failures has ν ∼ 1 . 5 − 2 [ 81 ], and the frequency of spacecraft failures has ν ∼ 0 . 6 − 1 . 3 [ 82 ]. Ev en when designers and op erators really , really wan t to a void mistakes, they still occur: the sev erity of n uclear acciden ts falls off only as ν ∼ 0 . 7 [ 83 ], similar to the p o wer-la ws observed for the sizes of industrial accidents [ 84 ] and oil spills [ 85 ]. Some complex medical interv en- tions ha ve p o wer-la w distributed outcomes with ν ∼ 3 − 4 [ 86 ]. Com bining the observed p o wer-la w resp onses of com- plex systems with the p o w er-law constraints of consis- tency chec king for systematic effects discussed in Section IV D , leads naturally to the observ ed consistency distri- butions with heavy p o w er-law tails. There are also sev- eral theoretical arguments that such distributions should b e exp ected. A systematic error or mistake is an example of a risk analysis incident, and p o wer-la w distributions are the maximal entrop y solutions for such incidents when there are multiple nonlinear interdependent causes [ 85 ], which is often the case when things go wrong in researc h. Scien tists wan t to make the b est measuremen ts possi- ble with the limited resources they hav e a v ailable, so sci- en tific research endea vours are go o d examples of highly structured complex systems designed to optimize out- comes in the presence of constrain ts. Such systems are exp ected to exhibit “highly optimized tolerance” [ 87 , 88 ], b eing very robust against designed-for uncertain ties, but also hypersensitive to unanticipated effects, resulting in p o wer-la w distributed resp onses. Simple contin uous mo dels for highly optimized tolerant systems are consis- ten t with the heavy tails observ ed in this study . These mo dels predict that α ∼ 1 + 1 /d [ 88 , 89 ], where d ( > 0) is the effective dimensionalit y of the system, but larger v alues of α arise when some of the resources are used to av oid large deviations [ 89 ], e.g. sp ending time doing consistency chec ks. F. Ho w can hea vy tails b e reduced? If one b elieves that mistak es can b e eliminated and all systematic errors found if we just w ork hard enough and apply the most rigorous methodological and statistical tec hniques, then results from the b est scien tists should not hav e heavy tails. Such a b elief, how ever, is not consis- ten t with the exp erienced challenges of exp erimen tal sci- ence, whic h are usually hidden in most pap ers rep orting scien tific measurements [ 4 , 90 ]. As Beveridge famously noted [ 91 ], often every one else b eliev es an exp erimen t more than the exp erimen ters themselves. Researc hers alw ays fear that there are unknown problems with their w ork, and traditional error analysis cannot “include what w as not thought of ” [ 47 ]. It is not easy to mak e accurate a priori iden tifications of those measurements that are so w ell done that they 13 a void ha ving almost-Cauch y tails. Exp ert judgemen t is sub ject to well-kno wn biases [ 92 ], and obvious criteria to iden tify b etter measurements may not work. F or ex- ample, the Op en Science Collab oration found that re- searc hers’ exp erience or exp ertise did not significantly correlate with the repro ducibilit y of their results [ 65 ] – the b est predictive factor was simply the statistical signif- icance of the original result. The best researc hers ma y b e b etter at iden tifying problems and not making mistak es, but they also tend to choose the most difficult challenges that provide the most opportunities to go wrong. Reducing hea vy tails is c hallenging b ecause complex systems exhibit scale inv arian t b ehaviour suc h that re- ducing the size of failures do es not significantly change the shap e of their distribution. Impro ving sensitivit y mak es previously unkno wn small systematic issues vis- ible so they can b e corrected or included in the total un- certain ty . This improv ement reduces σ , but even smaller systematic effects now b ecome significant and tails may ev en become hea vier and ν smaller. Comparing Figures 1 and 3 , it app ears that data with higher av erage relative uncertain ty tend to hav e heavier tails. This relationship b et ween relative uncertaint y and measurement disp er- sion is reminiscen t of the empirical Horwitz p o wer-la w in analytical chemistry [ 93 ], where the relative spread of in terlab oratory measuremen ts increases as the required sensitivit y gets smaller, and of T aylor’ s La w in ecology where the v ariance grows with sample size so that the uncertain ty on the mean do es not shrink as 1 / √ N [ 94 ]. In principle, statistical errors can b e made arbitrar- ily small by taking enough data, and ν can b e made arbitrarily large by making enough indep enden t consis- tency c hecks, but researc hers ha v e only finite time and resources so c hoices m ust b e made. T aking more consis- tency chec k data limits the statistical uncertaint y , since it is risky to treat data taken under different conditions as a single data set. Consistency chec ks are never com- pletely indep endent since it is imp ossible for different measuremen ts of the same quan tit y not to share any p eo- ple, metho ds, apparatus, theory or biases, so researchers m ust decide what tests are reasonable. The observed similar small v alues for ν may reflect similar spontaneous and often unconscious cost-b enefit analyses made by re- searc hers. The data showing the lightest tail rep orted here (in T able IV ) ma y pro vide some guidance and caution. The high qualit y of the Selected Metrology standards mea- suremen ts by leading national lab oratories sho ws that hea vy tails can be reduced b y collaboratively taking great care to ensure consistency b y sharing methodology and making regular comparisons. There are, how ever, limits to what can be achiev ed, as illustrated by the m uch heav- ier tail of the analytical standards measured by the same leading labs. Secondly , consistency is easier than accu- racy . In terlaboratory comparisons typically take place o ver relativ ely short p eriods of time, with participating institutions using the b est standard methods av ailable at that time. Biases in the standard metho ds ma y only b e later discov ered when new metho ds are introduced. F or example, work to wards a redefinition of the kilogram and the asso ciated developmen t of new silicon atom count- ing technology rev ealed inconsistencies with earlier w att- balance measurements, and this has driv en impro vemen ts in b oth metho ds [ 74 ]. Finally , selection bias that hides anomalous results is hard to eliminate. F or one metrol- ogy key comparison, results from one quantit y were not published because some lab oratories rep orted “incorrect results” [ 95 ]. Reducing tails is particularly challenging for measure- men ts where the primary goal is impro ved sensitivity that ma y lead to new scientific understanding. By definition, a b etter measuremen t is not an iden tical measuremen t, and ev ery difference provides ro om for new systematic errors, and every impro vemen t that reduces the uncer- tain ty makes smaller systematic effects more significant. F rontier measuremen ts are alwa ys likely to ha ve heavier tails. V. CONCLUSIONS Published scien tific measurements typically ha v e non- Gaussian almost-Cauc hy ν ∼ 2 − 4 Student-t error dis- tributions, with up to 10% of results in disagreement by > 5 σ . These hea vy tails occur in ev en the most careful mo dern research, and do not app ear to b e caused b y se- lection bias, old inaccurate data, or slopp y measurements of uninteresting quantities. F or even the b est scientists w orking on well understo od measurements using similar metho dology , it appears difficult to ac hiev e consistency b etter than ν ∼ 10, with ab out 0 . 1% of results exp ected to be > 5 σ outliers, a rate a thousand times higher than for a Normal distribution. These ma y , ho wev er, be un- derestimates. Because of selection/confirmation biases and metho dological correlations, historical consistency can only set lo wer bounds on hea vy tails – multiple mea- suremen ts ma y all agree but all b e (somewhat) wrong. The effects of unknown systematic problems are not completely unpredictable. Scientific measurement is a complex process and the observed distributions are con- sisten t with unkno wn systematics follo wing the low- exp onen t p o wer-la ws that are theoretically exp ected and exp erimen tally observed for fluctuations and failures in almost all complex systems. Researc hers do determine the scale of their uncertain- ties with fair accuracy , with the scale of Medical uncer- tain ties ( σ x ∼ 1) slightly more consisten t with the ex- p ected v alue ( σ x = 1) than in Physics ( σ x ∼ 0 . 7 − 0 . 8). Medical and Physics researc h ha ve comparable repro- ducibilit y in terms of how well different studies agree within their uncertainties, consisten t with a previous comparison of particle ph ysics with social sciences [ 10 ]. Medical research may ha ve slightly ligh ter tails, while Ph ysics results t ypically ha v e b etter relative uncertaint y and greater statistical significance. Understanding that error distributions are often 14 almost-Cauc hy should encourage use of t-based [ 96 ], me- dian [ 97 ], and other robust statistical metho ds [ 98 ], and supp orts choosing Studen t-t [ 99 ] or Cauc hy [ 100 ] priors in Ba yesian analysis. Outlier-tolerant metho ds are already common in mo dern meta-analysis, so there should b e lit- tle effect on accepted v alues of quan tities with multiple published measurements, but this better understanding of the uncertaint y ma y help improv e metho ds and en- courage consistency . F alse disco veries are more likely if researchers apply Normal conv entions to almost-Cauc h y data. Although m uch abused, the historically common use of p < 0 . 05 as a discov ery criterion suggests that many scien tists would lik e to b e wrong less than 5% of the time. If so, the results rep orted here supp ort the nominal 5-sigma dis- co very rule in particle physics, and may help discussion of more rigorous significance criteria in other fields [ 101 – 103 ]. This study should help researchers b etter understand the uncertainties in their measurements, and may help decision mak ers and the public b etter interpret the implications of scientific research [ 104 ]. If nothing else, it should also remind every one to nev er use Nor- mal/Gaussian statistics when discussing the likelihoo d of extreme results. A CKNOWLEDGEMENTS I thank the studen ts of the Universit y of T oronto Ad- v anced Undergraduate Ph ysics Lab for inspiring consid- eration of realistic exp erimen tal exp ectations, and the Univ ersity of Auckland Physics Department for their hos- pitalit y during very early stages of this w ork. I am grate- ful to D. Pitman for patient and extensive feedbac k, to R. Bailey for his constructive criticism, to R. Cousins, D. Harrison, J. Rosenthal, and P . Sinerv o for useful sug- gestions and discussion, and to M. Co x for man y helpful commen ts on the manuscript. D A T A ACCESSIBILITY The sources for all data analysed are listed in the as- so ciated ancillary file: Uncertaint yDataDescription.xls. [1] McNutt M. 2014 Journals unite fo r rep ro ducibilit y . Science 346 , 679. (doi:10.1126/science.aaa1724) [2] Conrad J. 2015 Reproducibility: Don’t cry w olf. Nature 523 , 27–28. (doi:10.1038/523027a) [3] Rosenfeld AH. 1968 Are There Any Fa r-out Mesons Or Bary ons? In Meson Sp ectroscopy (eds Balta y C, Rosenfeld AH). New Y o rk, USA: W. A. Benjamin. pp. 455–483. (https://a rchive.org/details/MesonSpectroscopy) [4] Franklin A. 2013 Shifting Standards: Exp eriments in Pa rticle Physics in the Twentieth Century . Pittsburgh, USA: Universit y of Pittsburgh Press. (http://bo oks.go ogle.ca/bo oks?id=jg4gAgAA QBAJ) [5] Cousins RD. 2014 The Jeffreys-Lindley P arado x and Discovery Criteria in High Energy Physics. Synthese doi:10.1007/s11229–014–0525–z. (doi:10.1007/s11229-014-0525-z ) [6] Dorigo T. 2015 Extrao rdinary claims: the 0.000029% solution. EPJ Web Conf. 95 , 02003. (doi:10.1051/epjconf/20149502003) [7] Ioannidis JP A. 2005 Why most published research findings a re false. PLOS Med. 2 , 696–701. (doi:10.1371/journal.pmed.0020124) [8] Nakaga wa S, Cuthill IC. 2007 Effect size, confidence interval and statistical significance: a practical guide fo r biologists. Biol. Rev. 82 , 591–605. (doi:10.1111/j.1469-185X.2007.00027.x) [9] Cumming G. 2014 The New Statistics: Why and Ho w. Psychol. Sci. 25 , 7–29. (doi:10.1177/0956797613504966) [10] Hedges L V. 1987 How Hard is Ha rd Science, How Soft is Soft Science? The Empirical Cumulativeness of Resea rch. Am. Psychol. 42 , 443–455. (doi:10.1037/0003-066X.42.5.443) [11] Po rter F C. 2006 The Significance of HEP Observations. Int. J. Mo d. Phys. A 21 , 5574–5582. (doi:10.1142/S0217751X06034768) [12] Y ouden WJ. 1972 Enduring V alues. T echnometrics 14 , 1–11. (doi:10.2307/1266913) [13] Stigler SM. 1977 Do Robust Estimato rs W ork With Real Data. Ann. Stat. 5 , 1055–1098. (doi:10.1214/aos/1176343997) [14] Sp eake C, Quinn T. 2014 The search for Newton’s constant. Phys. T o day 67 , 27–33. (doi:10.1063/PT.3.2447) [15] Bukhvostov AP . 1973 On the statistical meaning of exp erimental data. Leningrad Nucl. Phys. Inst. Rep. 45. (http://inspirehep.net/reco rd/898468/files/CM-P00100609.p df ) [16] Ro os M, Hietanen M, Luoma J. 1975 A new procedure fo r averaging pa rticle properties. Physica Fennica 10 , 21–33. [17] Shlyakhter AI. 1994 An Improved Framew o rk fo r Uncertaint y Analysis: Accounting fo r Unsusp ected Errors. Risk Anal. 14 , 441–447. (doi:10.1111/j.1539-6924.1994.tb00262.x) [18] Bukhvostov AP . 1997 On the probabilit y distribution of the experimental results. a rXiv:hep-ph/9705387. (http://a rxiv.org/abs/hep-ph/9705387) 15 [19] Hanson KM. 2007 Lessons ab out likelihoo d functions from nuclea r physics. AIP Conf. Proc. 954 , 458–467. (doi:10.1063/1.2821298) [20] Jeng M. 2007 Bandwagon effects and erro r ba rs in particle physics. Nucl. Instrum. Meth. A 571 , 704–708. (doi:10.1016/j.nima.2006.11.024) [21] Joint Committee fo r Guides in Metrology. 2008 Guide to the expression of uncertainty in measurement. JCGM 100. (http://www.iso.o rg/sites/JCGM/GUM-JCGM100.htm) [22] Sinervo PK. 2003 Definition and T reatment of Systematic Uncertainties in High Energy Physics and Astrophysics. In PHYST A T 2003, Stanford, USA (eds Lyons L, Mount RP , Reitmey er R). pp. 122–129. (http://stanfo rd.io/2fdpKta) [23] Carlson CE. 2015 The proton radius puzzle. Prog. Pa rt. Nucl. Phys. 82 , 59–77. (doi:10.1016/j.ppnp.2015.01.002) [24] Shields D. 2015 Giving credit where credit is due. Geotechnical Instrumentation News 33–34. (http://bit.ly/2b c0vnU) [25] Bravin E, Brun G, Dehning B, Drees A, Galb raith P , Geitz M, Henrichsen K, Koratzinos M, Mugnai G, T onutti M. 1998 The influence of train leakage currents on the LEP dipole field. Nucl. Instrum. Meth. A 417 , 9–15. (doi:10.1016/S0168-9002(98)00020-5) [26] Colclough AR. 1987 Two Theories of Exp erimental Error. J. Res. Nat. Bur. Stand. 92 , 167–185. (doi:10.6028/jres.092.016) [27] Barlo w R. 2002 Systematic Erro rs: facts and fictions. arXiv:hep-ex/0207026. (http://arxiv.o rg/abs/hep-ex/0207026) [28] Pavese F. 2009 About the treatment of systematic effects in metrology. Measurement 42 , 1459–1462. (doi:10.1016/j.measurement.2009.07.017) [29] Attivissimo F, Cataldo A, Fabbiano L, Giaquinto N. 2011 Systematic erro rs and measurement uncertaint y: An exp erimental approach. Measurement 44 , 1781–1789. (doi:10.1016/j.measurement.2011.07.011) [30] Dorsey NE. 1944 The Velocity of Light. T rans. Amer. Philos. So c. 34 , 1–110. (doi:10.2307/1005532) [31] Pomm ´ e S. 2016 When the model do esn’t cover realit y: examples from radionuclide metrology . Metrologia 53 , S55–S64. (doi:10.1088/0026-1394/53/2/S55) [32] Co chrane Collaboration. 2013 Co chrane Database of Systematic Reviews. (http://www.thecochranelibra ry .com) [33] Beringer J, et al. 2012 Review of Pa rticle Physics. Phys. Rev. D 86 , 010001. (doi:10.1103/PhysRevD.86.010001) [34] Beringer J, et al. 2013 Review of Pa rticle Physics 2013 pa rtial up date fo r the 2014 edition. (http://p dg.lbl.gov/2013/tables/contents˙tables.html) [35] B´ e MM, et al. 2013 T able of Radionuclides (Comments on evaluation). Bureau international des p oids et mesures BIPM-5. (http://bit.ly/2fuoaU3) [36] Baker RD, Jackson D. 2013 Meta-analysis inside and outside pa rticle physics: tw o traditions that should converge? Res. Synth. Meth. 4 , 109–124. (doi:10.1002/jrsm.1065) [37] Data description sp readsheet: BaileyDC Uncertainty Data Description.xls, available as arXiv ancillary file. [38] Beringer J, et al. 2013 Archives and Errata fo r the Review of P ar ticle Physics. (http://p dg.lbl.gov/2013/html/rpp˙a rchives.html) [39] Higgins JPT, Thompson SG, Deeks JJ, Altman DG. 2003 Measuring inconsistency in meta-analyses. Brit. Med. J. 327 , 557–560. (doi:10.1136/bmj.327.7414.557) [40] Mart ´ ın Andr´ es A, ´ Alva rez Hern´ andez M. 2014 Two-tailed appro ximate confidence intervals fo r the ratio of p rop o rtions. Stat. Comput. 24 , 65–75. (doi:10.1007/s11222-012-9353-5) [41] Joint Committee fo r Guides in Metrology. 2012 International vo cabula ry of metrology – Basic and general concepts and asso ciated terms (VIM). JCGM 200. (http://www.bipm.org/en/publications/guides/vim.html) [42] Barlo w R. 2003 Asymmetric Erro rs. In PHYST A T 2003, Stanfo rd, USA (eds Lyons L, Mount RP , Reitmeyer R). pp. 250–255. (http://stanfo rd.io/2gmFUQU) [43] Bohm G, Zech G. 2010 Intro duction to Statistics and Data Analysis for Physicists. V erlag Deutsches Elektronen-Synchrotron. (doi:10.3204/DESY-BOOK/statistics) [44] Bureau International des Poids et Mesures. 2014 The BIPM k ey compa rison database. (http://kcdb.bipm.o rg) [45] Willink R. 2004 Appro ximating the difference of t w o t-va riables fo r all degrees of freedom using truncated va riables. Aust. N. Z. J. Stat. 46 , 495–504. (doi:10.1111/j.1467-842X.2004.00346.x) [46] International Standards Organization. 2005 Statistical metho ds for use in proficiency testing by interlab o ratory compa risons. ISO 13528:2005(E) [47] Faller JE. 2014 Precision measurement, scientific personalities and erro r budgets: the sine quibus non for big G determinations. Phil. T rans. R. So c. A 372 , 20140023. (doi:10.1098/rsta.2014.0023) [48] Peterson D. 2015 All That Is Solid: Bench-Building at the Frontiers of Two Exp erimental Sciences. Am. So ciol. Rev. 80 , 1201–1225. (doi:10.1177/0003122415607230) [49] Adam T, et al. 2011 Measurement of the neutrino velo cit y with the OPERA detecto r in the CNGS beam. a rXiv:1109.4897v1 [hep-ex]. (http://arxiv.o rg/abs/1109.4897v1) 16 [50] Ade P AR, et al. 2014 Detection of B-Mo de P olarization at Degree Angular Scales by BICEP2. a rXiv:1403.3985v1 [astro-ph.CO]. (http://arxiv.o rg/abs/1403.3985v1) [51] Adam T, et al. 2012 Measurement of the neutrino velo cit y with the OPERA detecto r in the CNGS beam. JHEP 1210 , 093. (doi:10.1007/JHEP10(2012)093) [52] Ade P AR, et al. 2014 Detection of B-Mo de Pola rization at Degree Angula r Scales b y BICEP2. Phys. Rev. Lett. 112 , 241101. (doi:10.1103/PhysRevLett.112.241101) [53] Nachman B, Rudelius T. 2012 Evidence for conservatism in LHC SUSY searches. Eur. Phys. J. Plus 127 , 157. (doi:10.1140/epjp/i2012-12157-0) [54] Bienaym ´ e M. 1853 Consid´ erations a l’appui de la d´ ecourverte de Laplace sur la loi de probabilit ´ e dans la m´ etho de des moindres carr ´ es. C. R. Acad. Sci. XXXVI I , 309–324. (https://b ooks.go ogle.com/bo oks?id=QHJF AAAAcAAJ&pg=P A322) [55] Jeffreys H. 1961 The Theory of Probabilit y , 3rd ed. Oxford, UK: Oxford University Press. [56] Chen G, Gott JR, Ratra B. 2003 Non-Gaussian erro r distribution of Hubble constant measurements. Publ. Astron. So c. Pac. 115 , 1269–1279. (doi:10.1086/379219) [57] Crandall S, Houston S, Ratra B. 2015 Non-Gaussian Erro r Distribution of 7 Li Abundance Measurements. Mo d. Phys. Lett. A 30 , 1550123. (doi:10.1142/S0217732315501230) [58] Crandall S, Ratra B. 2015 Non-Gaussian Error Distributions Of LMC Distance Mo duli Measurements. Astrophys. J. 815 , 87. (doi:10.1088/0004-637X/815/2/87) [59] Jeffreys H. 1938 The law of erro r and the combination of observations. Philos. T rans. R. So c. Ser. A-Math. Phys. Sci. 237 , 231–271. (doi:10.1098/rsta.1938.0008) [60] Jeffreys H. 1939 The law of erro r in the Greenwich va riation of latitude observations. Mon. Not. Ro y . Astron. So c. 99 , 703–709. (doi:10.1093/mnras/99.9.703) [61] Dzhun’ IV. 2012 Distribution of erro rs in multiple large-volume observations. Meas. T ech. 55 , 393–396. (doi:10.1007/s11018-012-9970-6) [62] Anderson R. 2001 The pow er law as an emergent p rop ert y. Mem. Cogn. 29 , 1061–1068. (doi:10.3758/BF03195767) [63] Thompson M, Ellison SLR. 2011 Da rk uncertaint y . Accredit. Qual. Assur. 16 , 483–487. (doi:10.1007/s00769-011-0803-0) [64] Pavese F. 2015 Key comparisons: the chance fo r discrepant results and some consequences. Acta IMEKO 4 , 38–47. (doi:10.21014/acta imeko.v4i4.267) [65] Op en Science Collab o ration. 2015 Estimating the rep ro ducibilit y of psychological science. Science 349 , 6251. (doi:10.1126/science.aac4716) [66] Zhang L, Prietsch SO, Axelsson I, Halp erin SA. 2012 Acellula r vaccines for preventing who oping cough in children. Co chrane Database of Systematic Reviews CD001478.pub5. (doi:10.1002/14651858.CD001478.pub5) [67] T errestrial Environment Lab orato ry , IAEA Seib ersdo rf. 2010 ALMERA Proficiency T est Determination of Naturally Occurring Radionuclides in Phosphogypsum and Water (IAEA-CU-2008-04). Austria: International Atomic Energy Agency IAEA/AQ/15. (http://www-pub.iaea.org/MTCD/publications/PDF/IAEA-A Q-15˙w eb.p df ) [68] Michaelis W, Melcher J, Haars H. 2004 Supplementary investigations to PTB’s evaluation of G. Metrologia 41 , L29–L32. (doi:10.1088/0026-1394/41/6/L01) [69] Mohr PJ, T aylo r BN, Newell DB. 2012 CODA T A Recommended Values of the Fundamental Physical Constants: 2010. J. Phys. Chem. Ref. Data 41 , 043109. (doi:10.1063/1.4724320) [70] Fujii K, T anak a M, Nezu Y, Nak a yama K, F ujimoto H, De Bievre P , V alkiers S. 1999 Determination of the Avogadro constant by accurate measurement of the mola r volume of a silicon crystal. Metrologia 36 , 455–464. (doi:10.1088/0026-1394/36/5/7) [71] De Bievre P , et al. 2001 A reassessment of the mola r volume of silicon and of the Avogadro constant. IEEE T rans. Instrum. Meas. 50 , 593–597. (doi:10.1109/19.918199) [72] Schantz M, Wise S. 2004 CCQM-K25: Determination of PCB congeners in sediment. Metrologia 41 , 08001. (doi:10.1088/0026-1394/41/1A/08001) [73] Pomm ´ e S. 2015 The uncertainty of the half-life. Metrologia 52 , S51–S65. (doi:10.1088/0026-1394/52/3/S51) [74] Gibney E. 2015 Exp eriments to redefine kilogram converge at last. Nature 526 , 305–306. (doi:10.1038/526305a) [75] Henrion M, Fischhoff B. 1986 Assessing uncertainty in physical constants. Am. J. Phys. 54 , 791–798. (doi:10.1119/1.14447) [76] Carlisle J, Pace N, Cracknell J, Møller A, Pedersen T, Zacha rias M. 2013 (5) What should the Cochrane Collab o ration do ab out research that is, or might be, fraudulent? Co chrane Database of Systematic Reviews . (doi:10.1002/14651858.ED000060) [77] Dose V, V on Der Linden W. 1999 Outlier T olerant Pa rameter Estimation. In Maximum Entropy and Ba yesian Metho ds: Garching, Germany 1998 vol. 105 of Fundamental Theories of Physics . Netherlands: Springer. pp. 47–56. (doi:10.1007/978-94-011-4710-1“˙4) 17 [78] Clauset A, Shalizi CR, Newman MEJ. 2009 Po w er-La w Distributions in Empirical Data. SIAM Rev. 51 , 661–703. (doi:10.1137/070710111) [79] Hatton L. 2012 Defects, Scientific Computation and the Scientific Metho d. IFIP Advances in Info rmation and Communication T echnology 377 , 123–138. (doi:10.1007/978-3-642-32677-6˙8) [80] Hatton L, Rob erts A. 1994 How Accurate Is Scientific Softw a re. IEEE T rans. Soft w. Eng. 20 , 785–797. (doi:10.1109/32.328993) [81] Dobson I, Ca rreras BA, Lynch VE, Newman DE. 2007 Complex systems analysis of series of black outs: Cascading failure, critical p oints, and self-organization. Chaos 17 , 026103. (doi:10.1063/1.2737822) [82] Karimova LM, Kruglun OA, Mak arenk o NG, Romanova NV. 2011 P ow er Law Distribution in Statistics of F ailures in Op eration of Spacecraft Onb oa rd Equipment. Cosm. Res. 49 , 458–463. (doi:10.1134/S0010952511040058) [83] Sornette D, Maillart T, Kroeger W. 2013 Exploring the limits of safety analysis in complex technological systems. Int. J. Disaster Risk Reduct. 6 , 59–66. (doi:10.1016/j.ijdrr.2013.04.002) [84] Lop es AM, T enreiro Machado JA. 2015 Po wer Law Behavior and Self-Similarit y in Mo dern Industrial Accidents. Int. J. Bifurc. Chaos 25 , 1550004. (doi:10.1142/S0218127415500042) [85] Englehardt J. 2002 Scale invariance of incident size distributions in response to sizes of their causes. Risk Anal. 22 , 369–381. (doi:10.1111/0272-4332.00016) [86] Burton C. 2012 Heavy T ailed Distributions of Effect Sizes in Systematic Reviews of Complex Interventions. PLOS ONE 7 , e34222. (doi:10.1371/journal.p one.0034222) [87] Carlson J, Doyle J. 1999 Highly optimized tolerance: A mechanism fo r pow er laws in designed systems. Phys. Rev. E 60 , 1412–1427. (doi:10.1103/PhysRevE.60.1412) [88] Carlson J, Doyle J. 2002 Complexity and robustness. Proc. Natl. Acad. Sci. USA 99 , 2538–2545. (doi:10.1073/pnas.012582499) [89] Newman M, Girvan M, Fa rmer J. 2002 Optimal design, robustness, and risk aversion. Phys. Rev. Lett. 89 , 28301. (doi:10.1103/PhysRevLett.89.028301) [90] Collins HM. 2001 T acit kno wledge, trust and the Q of sapphire. Soc. Stud. Sci. 31 , 71–85. (doi:10.1177/030631201031001004) [91] Beveridge WIB. 1957 The Art of Scientific Investigation. W. W. Norton, New Y ork. (https://a rchive.org/details/a rtofscientifici00b eve) [92] Sutherland WJ, Burgman MA. 2015 Use exp erts wisely. Nature 526 , 317–318. (doi:10.1038/526317a) [93] Horwitz W, Alb ert R. 2006 The Horwitz ratio (Ho rRat): A useful index of metho d performance with resp ect to p recision. J. AO AC Int. 89 , 1095–1109. [94] Eisler Z, Ba rtos I, Kertesz J. 2008 Fluctuation scaling in complex systems: T aylo r’s la w and b ey ond. Adv. Phys. 57 , 89–142. (doi:10.1080/00018730801893043) [95] Thalmann R. 2002 CCL key comparison: calibration of gauge blo cks by interferometry . Metrologia 39 , 165–177. (doi:10.1088/0026-1394/39/2/6) [96] Lange KL, Little RJA, T a ylor JMG. 1989 Robust Statistical Modeling Using the t Distribution. J. Am. Stat. Assoc. 84 , 881–896. (doi:10.2307/2290063) [97] Gott I II JR, V ogeley MS, Podariu S, Ratra B. 2001 Median statistics, H 0 , and the accelerating universe. Astrophys. J. 549 , 1–17. (doi:10.1086/319055) [98] Avella Medina M, Ronchetti E. 2015 Robust statistics: a selective overview and new directions. Wiley Interdiscip. Rev. Comput. Stat. 7 , 372–393. (doi:10.1002/wics.1363) [99] Gelman A. 2006 Prior distributions for variance pa rameters in hierarchical mo dels (Comment on an Article by Bro wne and Drap er). Ba y esian Anal. 1 , 515–533. (doi:10.1214/06-BA117A) [100] Polson NG, Scott JG. 2012 On the Half-Cauchy Prior for a Global Scale P arameter. Bay esian Anal. 7 , 887–901. (doi:10.1214/12-BA730) [101] Johnson VE. 2013 Revised standards for statistical evidence. Pro c. Natl. Acad. Sci. USA 110 , 19313–19317. (doi:10.1073/pnas.1313476110) [102] Gelman A, Rob ert CP . 2014 Revised evidence for statistical standa rds. Proc. Natl. Acad. Sci. USA 111 , E1933. (doi:10.1073/pnas.1322995111) [103] Colquhoun D. 2014 An investigation of the false discovery rate and the misinterpretation of p-values. R. So c. Op en Sci. 1 , 140216. (doi:10.1098/rsos.140216) [104] Fischhoff B, Davis AL. 2014 Communicating scientific uncertainty . Proc. Natl. Acad. Sci. USA 111 , 13664–13671. (doi:10.1073/pnas.1317504111)
Original Paper
Loading high-quality paper...
Comments & Academic Discussion
Loading comments...
Leave a Comment