Gene set bagging for estimating replicability of gene set analyses
Background: Significance analysis plays a major role in identifying and ranking genes, transcription factor binding sites, DNA methylation regions, and other high-throughput features for association with disease. We propose a new approach, called gen…
Authors: Andrew E. Jaffe, John D. Storey, Hongkai Ji
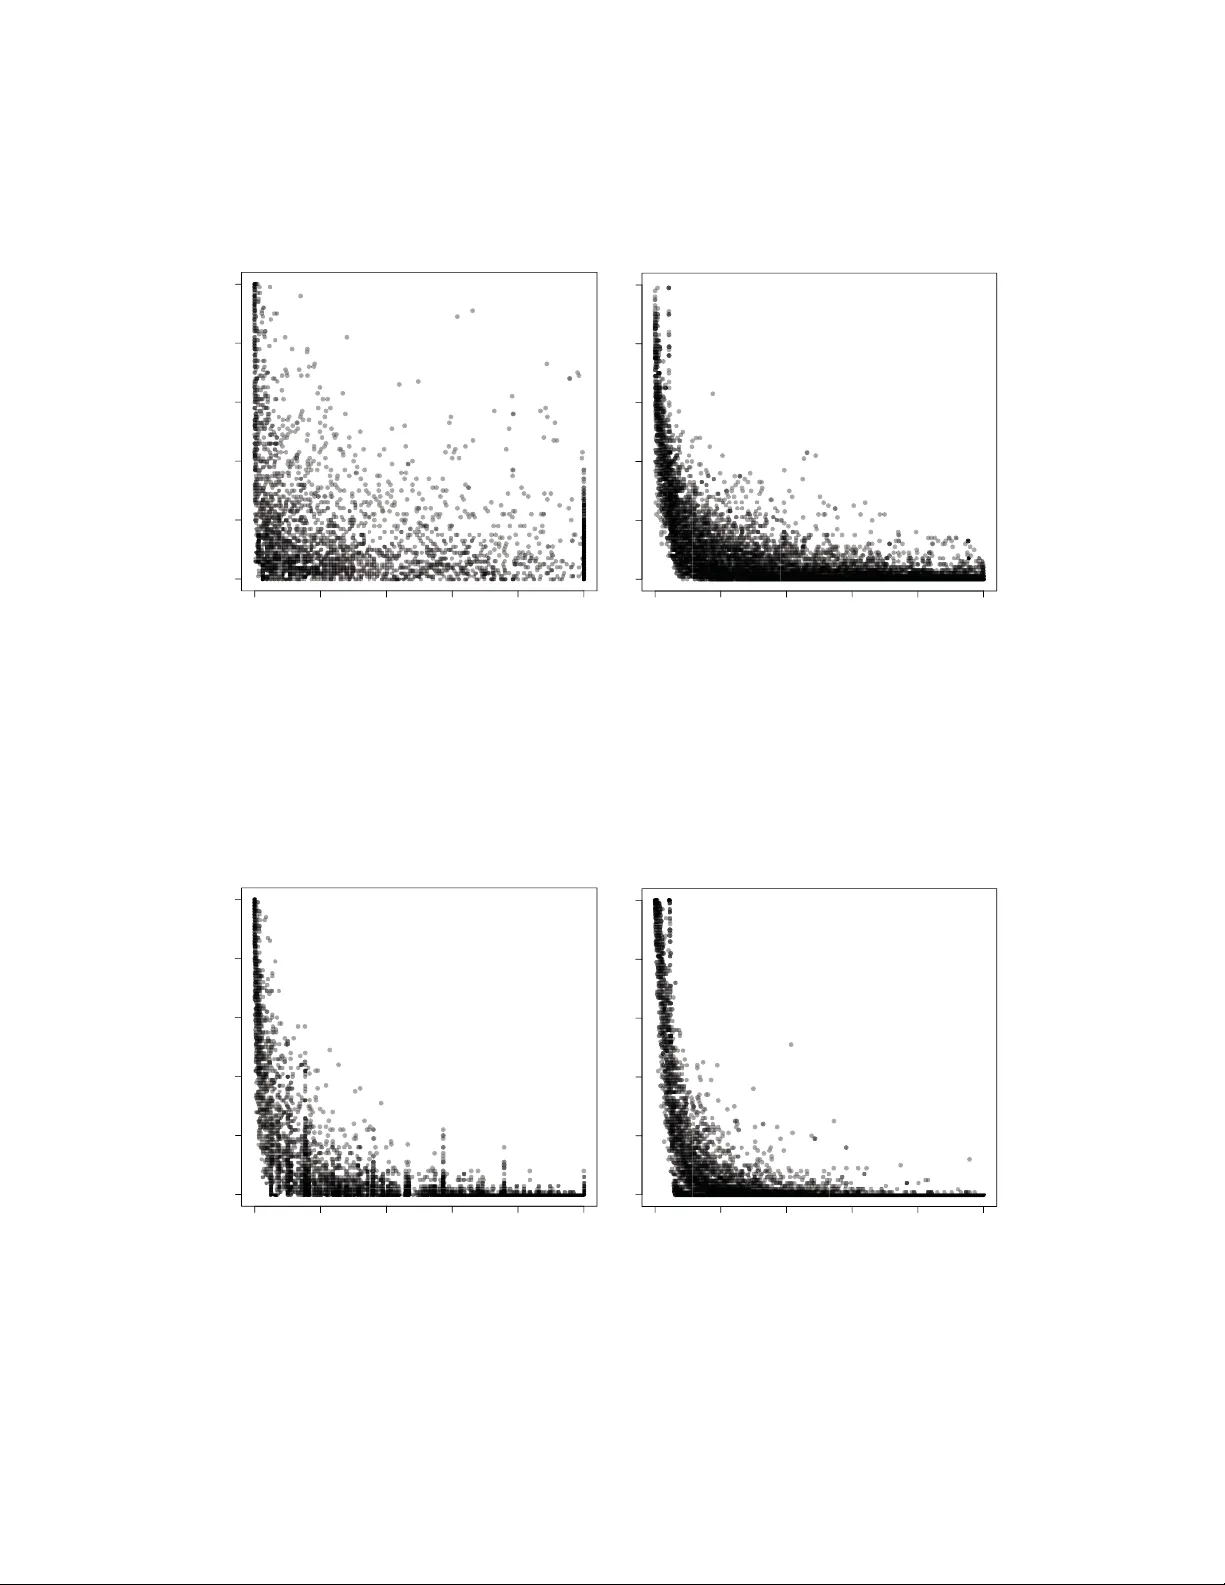
Gene set bagging fo r estimating replicabilit y of gene set anal- yses Andrew E. Jaffe 1 , 2 , John D. Storey 3 , Hongkai Ji 1 and Jeffrey T. Leek ∗ 1 1 Department of Biostatistics, Johns Hopkins Bloomb erg Scho ol of Public Health, Baltimo re MD 21205 2 Lieber Institute for Brain Development, Johns Hopkins Medical Campus, Baltimore MD 21205 3 Lewis-Sigler Institute and Department of Molecular Biology , Princeton Universit y , Princeton, NJ 08544 Email: Jeffrey T Leek ∗ : jleek@jhsph.edu; ∗ Corresponding author Abstract Background Significance analysis pla ys a majo r role in identifying and ranking genes, transcription factor binding sites, DNA methylation regions, and other high-throughput features for asso ciation with disease. We propose a new approach, called gene set bagging , fo r measuring the stability of ranking procedures using predefined gene sets. Gene set bagging involves resampling the o riginal high-throughput data, p erfo rming gene-set analysis on the resampled data, and confirming that biological categories replicate. This procedure can be thought of as bo otstrapping gene-set analysis and can b e used to determine which are the most reproducible gene sets. Results Here w e apply this approach to t w o common genomics applications: gene expression and DNA methylation. Even with state-of-the-a rt statistical ranking procedures, significant categories in a gene set enrichment analysis ma y b e unstable when subjected to resampling. Conclusions W e demonstrate that gene lists a re not necessarily stable, and therefo re additional steps like gene set bagging can imp rove biological inference of gene set analysis. 1 Key W ords Gene Set Analysis, Gene Expression, DNA Methylation, Gene Ontology Background The biology of man y organisms is organized naturally as a series of div erse path w a ys, and the genetic landscap e of cells is no differen t - genes also group together in pathw a ys to p erform sp ecific functions [1]. Human health dep ends on the functionalit y of these pathw ays; de-regulation at the path w a y lev el may b e more imp ortan t for diseases like cancer than de-regulation of sp ecific genes [2]. The most common statistical approac h for iden tifying path w a ys of in terest in a high-throughput exp erimen t is to perform a significance analysis gene-b y-gene and then summarize the significan t hits using gene set or gene path w a y analyses. Each path w a y or gene-set analysis is performed once on the entire data set. Ho w ev er, there is v ariability in the iden tified gene sets due to b oth the instability in gene rankings from the original gene ranking analysis and from the pathw ay/set analysis. Here w e prop ose a new approac h to ev aluate the stabilit y of biological inference dra wn from an experiment. Our approach, called gene set bagging, p erforms a resampling of the entire disco v ery algorithm - significance analysis and gene set enrichmen t - to identify the most stable and reproducible enriched gene sets. W e p erform resampling by drawing an equal n um ber of samples with replacement from the full (observed) dataset, p erforming a significance analysis follow ed by gene set analysis, and then iden tifying which sets are enric hed. W e can identify whic h observ ed gene sets are consisten tly enriched in resampled data, and compute the gene set replication probabilit y ( R ), a measure of gene set stabilit y based directly on the biological quantit y of interest, represen ting the probabilit y that an observed gene set will b e enriched in future exp erimen ts. The replication prop ortion ( R ) has some imp ortan t adv an tages o v er the traditionally-rep orted p-v alue for summarizing gene set enrichmen t. The structure of the gene set testing problem is fundamen tally different than other multiple hypothesis testing problems - correlations betw een genes, differen t gene set sizes, and differen t lev e l s and fraction of differential expression within gene sets mak es the hypotheses fundamen tally not comparable with standard significance testing [3, 4]. W e therefore instead prop ose to estimate directly the probabilit y that a gene set will replicate, as in this more complicated multiple testing scenario, an estimate of the probability of replication ma y be of more in terest than a measure of statistical significance. Lastly , giv en the emphasis for replication in genetics/genomics studies, this replication proportion may b e another 2 metric for directing molecular v alidation of imp ortan t biological pro cesses inv olved in human disease. W e perform our gene set bagging metho d on t w o genomics measuremen ts: gene expression and DNA meth ylation. Even after adjusting the genomic data for p oten tial batc h effects, we demonstrate that some significan t gene sets fail to replicate well, yet other non-significant sets hav e high replication rates. The results for these different genomic tec hnologies suggest that the signal and noise structure of the sp ecific genomic data t yp e contribute greatly to stabilit y of gene sets. W e use a sim ulation study to assess replication across t w o sim ulated datasets, and ev aluate the concordance b et w een replication probability ( R ) and the traditionally- rep orted significance metric (p-v alue). W e sho w that the replication probability b etter quantifies the chance that a significant gene set will b e consistent across studies, and the result of our analyses suggests that: (1) gene set enrichmen t analyses from a t ypical high-throughput study may b e highly unstable, and (2) gene set bagging is a resampling approach for measuring the stability of gene sets and ensuring repro ducibilit y of biological conclusions. Metho ds Bagging, also known as b o otstrap aggregating, is traditionally used for assessing the predictive accuracy and stabilit y of prediction models [5]. While bagging procedures hav e b een used for differen tial expression analyses [6], here we introduce a new bagging pro cedure for significance analysis of gene sets called gene set bagging. This pro cedure can b e useful for b oth ev aluating significance rankings and also for describing the most repro ducible genes and biological gene sets within genomics experiments in a platform-indep enden t fashion. F or gene set l , the goal is to estimate: R l = Pr(Gene set l will b e significan t in a new study) . The quan tit y R l is useful as a measure of the stability of the significance of an identified gene set. Gene sets are frequently used to in terpret the biological results of studies, so it is imp ortan t to know if the biological ”story” would change if the study w as rep eated. This is particularly true since gene set analysis is sub ject to errors in annotation, v ariation due to technological noise, and v ariation due to biological noise. As an example of our general approach, we focus on a cigarette smoking dataset (further explained in the follo wing Datasets and Implementation section), whic h examined gene expression differences asso ciated with smoking exposure in 40 smok ers and 39 never-smok ers. W e define gene expression measuremen ts m ij for eac h of j = 1 , . . . , 79 samples o v er i = 1 , . . . , M genes/prob es (corresp onding to gene g i ) and a cov ariate of 3 in terest p er sample ( z j ∈ [ curr entsmoker, nev ersmok er ]). W e first wan t to iden tify differentially expressed genes b et w een the tw o outcome groups, so w e calculate an empirical Bay es t-statistic and resulting p-v alue for each gene [7]. W e can call any gene significant if α < 0 . 05 (or, alternatively , we can assume α to b e the family-wise error rate as to control for multiple testing), and lo ok for enrichmen t in L predefined gene sets. Eac h gene set gets a p-v alue ( p l ), reflecting the degree of enric hmen t. The prev alent wilco xon mean rank gene set enrichmen t test [8] a v ailable in the limma Bio conductor pack age [9] and traditional h yp ergeometric test w ere used as enrichmen t tests for eac h dataset. W e can then p erform gene set bagging using B = 100 iterations. In each iteration ( b ), we resample the 40 smokers and 39 smokers separately with replacement. Each ge n e or probe gets a p-v alue via calculating a t-statistic in the resampled data, and these statistics are passed to gene set analysis algorithms to pro duce a p-v alue of enrichmen t for each gene set ( p b l ), whic h are stored in the first column of a [#gene sets by B ] matrix. In the next iteration, we resample again and create a different resampled dataset, and get another set of p-v alues that are put in the second column of the storage matrix. W e fill in the columns of the matrix if w e do this 100 times. F or each ro w, whic h represen ts a single gene or prob e, we coun t the num ber of times eac h subsampled p-v alue ( p b l ) is less than α (here, 0.05), and divide it b y the num ber of iterations (B), resulting in an estimate of the replication probability for that gene set ( ˆ R l ). Regardless of the application, estimated replication probabilities ( ˆ R ) are b et ween 0 and 1, where 0 means that the gene set alwa ys had a p-v alue greater than α in ev ery iteration, and 1 means that the category alw a ys had a p-v alue less than α in each iteration. F or analyses where the gene ranking is stable and the gene set calculation is stable, the replication probability will be higher. This estimate of replication assesses the stabilit y of the gene sets, and migh t b e a b etter estimate of biological reproducibility than the traditionally rep orted p-v alues. Our goal is to iden tify the more stable set of gene sets, akin to Meinshausen, and B ¨ uhlmann 2010 [10] in selecting a more stable set of cov ariates in a regression mo del. Datasets and Implementation Simulate d Data W e designed tw o simulation studies to assess different prop erties of the replication probability based on the Affymetrix Human Genome 133 Plus 2.0 gene expression microarra y . Basing the simulation on an existing arra y design, with probes annotated to genes that were already mapp ed to gene ontology categories, allow ed us to realistically add differen tial expression signal to specific gene sets. W e first selected a random sample of 4 Algorithm 1 Gene set bagging pro cedure 1. Estimate a test statistic for each gene ˆ T i 2. Use the test statistics to calculate a P-v alue for each gene set, p l , l = 1 . . . , L , using an y standard gene set analysis algorithm. 3. F or ( b ∈ 1 , . . . , B ): i. Resample individuals within outcome groups ii. Estimate a bo otstrap test statistic for each gene ˆ T ∗ b i iii. Use the test statistics to calculate a b ootstrap p-v alue for eac h gene set, p ∗ b l , l = 1 . . . , L , using any standard gene set analysis algorithm. 4. Estimate the replication probability ˆ R l = P B b =1 I [ p ∗ b l <α ] B for eac h gene set. 100 gene sets to use in our simulation, which corresp onded to 2288 unique genes. Then, for each sim ulation, w e selected first 100 and then 500 genes (generally denoted G ) to insert signal into, via the follo wing mo del: m ij = β 0 + β i z j + ij where ij ∼ N (6 , 1) and β i ∼ N (1 , 0 . 5) if g i ∈ G , and m ij and z j (defined ab o v e) corresp ond to the expression v alue and binary outcome resp ectiv ely . In the first simulation, we generated 1000 datasets, where each consisted of 100 individuals (50 cases and 50 controls). F or eac h dataset, we inserted signal into 100 genes and computed the observed p-v alue ( p l ) and then the replication probabilities ( R l ) for eac h gene set l . In the second simulation we generated 100 pairs of datasets, where eac h dataset contained 50 individuals (25 cases and 25 controls), and inserted signal into 500 genes, and computed observed p-v alues and replications probabilities for eac h gene set. Gene expr ession: cigar ette smoking data W e tested the gene set bagging metho d in a differential expression analysis with data obtained from Gene Expression Omnibus (GSE17913). This study examined the effect of cigarette smoking on the oral epithelial transcriptome b y comparing buccal biopsies in 39 nev er-smokers with 40 active-smok ers using the Affymetrix Human Genome U133 Plus 2.0 microarra y [11]. W e pro cessed the ra w CEL files using the RMA algorithm to p erform in tra-arra y normalization and then p erformed quantile normalization to adjust for b et ween-arra y biases [12]. W e p erformed surrogate v ariable analysis (SV A) to adjust for p oten tial batch effects [13, 14]. Briefly , this approach iden tifies the n um ber of right singular vectors that are associated with more v ariation than exp ected by chance, and then in the subsets of genes driving this v ariation, constructs a ’surrogate’ v ariable 5 for each subset. These surrogate v ariables are then included as co v ariates in our differential expression analysis (so that the mo del b ecomes: m ij = β i z + β S V S V + ij ). W e identified differentially expressed genes comparing cases and controls while controlling for the surro- gate v ariables using an empirical Bay es approach [15]. T o determine statistical significance, resulting p-v alues w ere con v erted to q-v alues to control for the false disco v ery rate [16] and all transcripts with q-v alues less than 0.05 were considered significant. W e p erformed a full gene on tology analysis, and then ran the gene set bagging algorithm. DNA methylation: br ain tissue W e b elieve this approach to be generalizable to most genomics platforms, and first tested this hypothesis using DNA m eth ylation data pro cessed on the Illumina HumanMeth ylation27 platform using freely av ailable data from GEO [17] [GSE15745]. Our analysis utilized DNA methylation data from a recent pap er that assessed quan titativ e trait lo ci using methylation and expression d ata in four differen t brain tissues. Previous w ork has iden tified that DNA methylation signatures can distinguish brain tissues, and might pla y a role in determining and stabilizing normal brain differentiation [18]. W e conducted our gene set bagging algorithm on the differen tial DNA methylation analysis b et w een the frontal and temp oral cortices. Detailed prepro cessing information can b e found in the supplementary material. W e p erformed the full differential meth ylation analysis comparing 131 fron t cortex and 126 temp oral cortex samples, adjusting for plate n um b er, tissue bank site, sex, and age, using the exact same approach as the gene expression example (with and without SV A, then empirical Ba y es and multiple testing correction on each). All prob es with q-v alues less than 0.05 were considered significant. W e p erformed a full gene on tology analysis on the gene asso ciated with each prob e (from the annotation table), and ran the gene set bagging algorithm. Interp retation The replication p robability ( R ) reflects stability The in terpretation of the replication probabilit y reflects the underlying stability of each outcome group. Supp ose w e observ e a p-v alue for a gene set that we call significan t at significance level α . The replication probabilit y estimate is defined as the fraction of times that feature is significan t at the same α level in resamplings of the original data. If we called all p-v alues significant at α = 0 . 05, R = 0 . 8 means that feature had a p-v alue less than 0.05 in 80% of resampling datasets . If the statistical signal is stable, significan t 6 features will hav e high replication probability estimates, and non-significan t features will ha ve lo w replication probabilit y estimates ( R ≈ 0), b ecause the resampled data should b e representativ e of the o verall p opulation. T o b etter understand how the replication probability therefore addresses stability , supp ose we p erform a gene expression exp erimen t, and further study tw o gene sets: Set A with p = 0 . 001 and Set B with p = 0 . 2. W e then calculate the replication probability for these tw o gene sets, and wan t to interpret the results. Consistency b et ween the replication probability and p-v alue means that the direction of statistical inference is iden tical: high replication probabilities with low p-v alues are consistent. T able 1: Interpretations of sequential replication probabilities ( ˆ R ) for tw o differen t experiment features. R ”F eature A (p = 0.001) is significan t, 0 but v ery inconsistent” 0.25 but v ery inconsistent” 0.5 inconsisten t” 0.75 somewhat consisten t” 1 v ery consistent” R ”F eature B (p = 0.2) is non-significan t, 0 v ery consistent” 0.25 somewhat consisten t” 0.5 inconsisten t” 0.75 v ery inconsistent” 1 v ery inconsistent” T o understand the apparently counterin tuitiv e interpretations, we will fo cus on the row in T able 1 where R = 1 . 0. F eature A is extremely stable because the significance of this feature seems constan t throughout resampling. F eature B is also extremely stable b ecause the resa mpl ing inferences are relatively non-v ariable, but the replication probability is very inconsistent with the p-v alue. Interpreting stabilit y and consistency through the replication probability therefore requires observed p-v alues for gene sets. How ever, it is imp ortan t to remember that the replication probability is a function of the statistical significance level ( α ); algebra can demonstrate that R increases as α increases. R estimates the p robabilit y a gene set will be significant in a repeated study W e simulated 1,000 identical data sets (as describ ed in the Datasets section; Simulation 1), these data sets represent rep eated exp erimen ts p erformed under the same conditions. W e spik ed in sp ecific genes as differen tially expressed in these simulated data sets. W e then performed gene set analysis using b oth the h yp ergeometric and Wilcoxon tests and calculated the replication probability estimates for each gene set in eac h of the 1,000 simulated studies. The av erage replication probability estimate across all 1,000 rep eated 7 studies v ery closely appro ximates the frequency that a gene se t is observ ed to be significant in those 1,000 studies (Figures 1A and 1B). In other words, the estimate of the replication probability is close to the probabilit y a gene set will b e significant in a future study . Replication adds biological interpretabilit y In the gene expression dataset (Figure 2), there w ere 8 GO categories with p > 0.05 and R > 0.8 under the h yp ergeometric test, including sets associated with phosphorylation (GO:0006468, GO:0016310), a pro cess affected b y cigarette smoking [19] and regulation of metab olic pro cesses (GO:0019222, GO:0044267). Sim- ilarly , examining the categories asso ciated with DNA methylation differences across brain tissue that had at least moderate replication and non-significan t p-v alues demonstrates supp ort for the gene set bagging approac h as well as the shortcomings of relying on strict p-v alues cutoffs for gene ontology analysis (Figure 3). Several biologically plausible GO categories for a comparison of meth ylation differences in brain tis- sues fell in to the ”marginally s ign ificant” bin of observed p-v alues b et w een 0.05 and 0.1 but had consistent replication. Similarly , there were man y smaller gene sets that had statistically significant p-v alues (p < 0.05) but nev er appeared in any of the resampled datasets ( R =0) in b oth the gene expression ( N = 32) and DNA meth ylation datasets ( N = 12). These represent very unstable gene sets, and should b e interpreted with caution. Categories lik e the first set ( p > 0 . 05 , R > 0 . 8) would hav e b een ignored in a traditional gene set analysis given their statistical significance measure, but might b e biologically imp ortan t to the question of interest. Likewise, gene sets in the second category ( p < 0 . 05 , R = 0) are probably less biologically meaningful ev en though they are ”statistically significant”. Results R co rrelates better with replication in indep endent datasets Besides identifying which gene sets are the most stable, w e can also assess ho w well the replication probability ( R ) reflects biological replication by spiking-in gene set enric hmen t across tw o independent simulated datasets (describ ed fully in the Datasets section). W e p erformed traditional gene ontology analysis on b oth datasets, obtaining p-v alues for eac h gene set and study calculated from the hypergeometric distribution, and then p erformed our gene set bagging algorithm on these same t w o datasets. There w as very strong Sp earman correlation b et ween datasets across 100 sim ulation runs when all gene sets w ere considered regardless of whether the replication proportion (median=0.854, IQR: 0.826-0.876) or p-v alue (median = 0.836, IQR: 8 0.809-0.869) w as used (Figure 1C). Ho w ev er, when only gene sets where at least 1 of 2 datasets was significant at p < 0 . 05 p er sim ulation run, the replication prop ortion had muc h stronger correlation (median = 0.755, IQR =0.678-0.817) than the p-v alue (median = 0.535, IQR: 0.387 - 0.648) (Figure 1D). These results suggest that globally , there might not b e a large difference betw een the replication prop ortion and the p-v alue, but when there is an y signal in a particular gene set, the replication prop ortion b etter captures indep enden t replication of that set in future studies. W e also p erformed the more robust Wilco xon rank rest on these sim ulated paired datasets, which also had less correlation b et w een the resulting p-v alues than the replication probabilit y (Figure 1E). There were many fewer significan t gene sets by this enrichmen t approach than the h yp ergeometric test, and it was rare that b oth indep enden t datasets within a sim ulation w ere significan t at p < 0 . 05. The p-v alues derived from the Wilco xon metho d therefore appear more conserv ative than collapsing eac h gene set into a 2x2 table and p erforming the hypergeometric test. Relationship to the problem of regions The set of test statistics corresponding to genes within an individual set can be viewed as a m ultiv ariate random v ariable. When viewed in this wa y , a gene set is significant if the vector of test statistics falls into a m ulti-dimensional region defined by the significance threshold. The replication probability is then a first appro ximation estimate of the p osterior probabilit y a gene set will b e significant, assuming a non-informative prior distribution on the v ector of test statistics. This problem has been considered in the case of multiv ariate normal data [20] and for estimating confidence in inferred phylogenies [21]. As has b een previously p oin ted out, this p osterior probability is a reasonable first approximation to the p osterior probabilit y in question, but should not b e interpreted as a frequentist measure of statistical significance [20, 22]. As an example of the relationship b et ween the b ootstrap and a p osterior probability , supp ose z 1 , . . . , z n ∼ N ( µ, σ 2 ). A non-informative prior distribution for the parameters ( µ, σ 2 ) is the Jeffrey’s prior [23]. The Jeffrey’s prior for µ is an improp er uniform prior across the real line and the Jeffrey’s prior for σ 2 ∝ 1 σ 2 . Using these prior distributions, the p osterior distribution for µ is N ( ¯ z , τ 2 ) where τ ∼ I nv er seW ishar t n − 1 (( ns 2 ) − 1 ) and s 2 = 1 n P n i =1 ( z i − ¯ z ) 2 . In this case, since µ is one dimensional, the I nv er seW ishar t distribution is equiv alent to an I nv eseGamma distribution. Dra wing b ootstrap samples from the z i and recalculating the mean approximates sampling from the p osterior distribution of µ (see supplemen tal R co de). It is imp ortan t to note that the v ariance of the p osterior for µ is inflated compared to σ 2 assuming a frequentist mo del [20, 22]. Note that the p-v alues these b ootstrap samples should not b e in terpreted as measures of statistical significance, b ecause they are no longer distributed uniformly . 9 Discussion W e hav e developed a resampling-based strategy for estimating the probabilit y a gene set will replicate as statistically significant. This direct approach to estimating replicability may b e more useful than statistical significance for inv estigators who aim to identify stable and reproducible biological stories for their results. By utilizing outcome-based resamplings of the observ ed data, the repro ducibilit y of gene sets can b e quan tified, represen ted by the replication probability R of eac h gene set category across all subsamples. This approach can offer an additional metric beyond the p-v alue for identifying which biological pathw ays to follow-up. W e hav e successfully applied this method to gene expression and DNA methylation under tw o commonly- used enrichmen t metrics: the hypergeometric test and the wilco xon rank test, and demonstrate that many seemingly statistically significant GO categories fail to replicate consistently . A strength of our approach is the generalizabilit y of this algorithm to most other genomics applications, including follo wing bias-correcting approac hes like SV A during the analysis, to assess the stability of results lists. Ov erall, b et w een the tw o most commonly used gene set enrichmen t measures, the Wilco xon rank test app ears more stable than the hypergeometric p-v alue, using simulated and real data. There w ere few er inconsisten t gene sets (significan t either by R or the p-v alue, but not the other), and the relationship b et ween the replication probability and p-v alue was more precisely defined (Figure 1B and 2B). Gene sets with high replication probabilities and low p-v alues represent statistically significan t, stable, and consistent sets that migh t b est represent the underlying biology within the exp erimen t. Given that most genomics studies require some form of external replication and that R app ears more correlated with replication in second follow-up study than p-v alues alone, we might also suggest follo wing-up gene sets that hav e high replication probabilities ( R ) ev en if the p-v alues are marginally , or ev en non-, significan t. F rom a practical persp ectiv e, the gene set bagging algorithm has b een turn in to the R pac k age ”GeneSet- Bagging”, av ailable through GitHub (h ttps://gith ub.com/andrew ejaffe/GeneSetBagging). While defining a recommended cutoff seems counterproductive, as in different applications, users may choose differen t cutoffs dep ending on their resources for replication and how willing they are to b e correct, a cutoff v alue of R ab o ve 0.5 means that gene set is more lik ely to replicate than not, and could b e used as a lo w er b ound for replicabilit y . T ypical genomics practice often inv olves drawing the ma jorit y of biological conclusions of an exp erimen t from the results of a gene set analysis without assessing the stabilit y of the results. W e envision replication probabilities used in conjunction with standard measures of statistical significance, as the emphasis on replication in genetics/genomics mak es the replication probability a useful quantit y to estimate and use in 10 conjunction with p-v alues. W e hav e demonstrated that gene lists are not nece ssarily stable, and therefore additional steps lik e gene set bagging should b e undertaken to maximize the biological inference of a given study . Autho r’s contributions JTL and JDS designed the study , AEJ p erformed the analyses, AEJ HJ JDS and JTL wrote the man uscript. Ackno wledgements F unding: National Institutes of Health [grant n um b ers P50HG003233, R01HG005220], and a Johns Hopkins Sc ho ol of Public Health F acult y Innov ation Award to J. Leek 11 References 1. Ho od L, Heath J, Phelps M, Lin B: Systems biology and new tec hnologies enable predictive and prev en tativ e medicine . Science 2004, 306 (5696):640. 2. V ogelstein B, Kinzler K: Cancer genes and the path w a ys they con trol . Natur e me dicine 2004, 10 (8):789– 799. 3. Efron B, Tibshirani R: On testing the significance of sets of genes . The Annals of Applie d Statistics 2007, :107–129. 4. Gatti DM, Barry WT, Nob el AB, Rusyn I, W right F A: Heading do wn the wrong path w a y: on the influence of correlation within gene sets . BMC Genomics 2010, 11 :574. 5. Hastie T, Tibshirani R, F riedman JH: The elements of statistic al le arning : data mining, infer enc e, and pr e diction . New Y ork: Springer 2009. 6. Dudoit S, F ridlyand J, Speed T: Comparison of discrimination metho ds for the classification of tumors using gene expression data . Journal of the Americ an Statistic al Asso ciation 2002, 97 (457):77–87. 7. Smyth G, et al.: Linear mo dels and empirical ba y es metho ds for assessing differential expression in microarra y exp erimen ts. Statistic al applic ations in genetics and mole cular biolo gy 2004, 3 :3. 8. Michaud J, Simpson K, Esc her R, Buchet-P o y au K, Beissbarth T, Carmic hael C, Ritc hie M, Sc h ¨ utz F, Cannon P , Liu M, et al.: In tegrativ e analysis of RUNX1 downstream pathw a ys and target genes . BMC genomics 2008, 9 :363. 9. Smyth GK: Limma: linear mo dels for microarray data . In Bioinformatics and Computational Biolo gy Solutions Using R and Bio c onductor . Edited b y Gen tleman R, Carey V, Dudoit S, Irizarry R, Hub er W, New Y ork: Springer 2005:397–420. 10. Meinshausen N, B¨ uhlmann P: Stabilit y selection . Journal of the R oyal Statistic al So ciety: Series B (Statistic al Metho dolo gy) 2010, 72 (4):417–473. 11. Boyle J, Gumus Z, Kac k er A, Choksi V, Bock er J, Zhou X, Y antiss R, Hughes D, Du B, Judson B, et al.: Effects of cigarette smok e on the h uman oral m ucosal transcriptome . Canc er Pr evention Rese ar ch 2010, 3 (3):266. 12. Irizarry R, Hobbs B, Collin F, Beazer-Barclay Y, Antonellis K, Sc herf U, Sp eed T: Exploration, normalization, and summaries of high density oligon ucleotide arra y prob e level data . Biostatistics 2003, 4 (2):249. 13. Leek J, Storey J: Capturing heterogeneity in gene expression studies by surrogate v ariable analysis . PL oS Genetics 2007, 3 (9):e161. 14. Leek J, Storey J: A general framew ork for multiple testing dep endence . Pr o c e e dings of the National A c ademy of Scienc es 2008, 105 (48):18718. 15. Smyth G: Linear mo dels and empirical Bay es metho ds for assessing differential expression in mi- croarra y exp erimen ts . Statistic al applications in genetics and molecular biolo gy 2004, 3 :3. 16. Storey J, Tibshirani R: Statistical significance for genomewide studies . Pr o c e e dings of the National A c ademy of Scienc es of the Unite d States of Americ a 2003, 100 (16):9440. 17. Gibbs J, V an Der Brug M, Hernandez D, T ra ynor B, Nalls M, Lai S, Arepalli S, Dillman A, Raffert y I, T roncoso J, et al.: Abundan t quan titativ e trait loci exist for DNA meth ylation and gene expression in human brain . PL oS genetics 2010, 6 (5):e1000952. 18. Ladd-Acosta C, P evsner J, Sabunciy an S, Y olk en R, W ebster M, Dinkins T, Callinan P , F an J, Potash J, F ein berg A: DNA meth ylation signatures within the h uman brain . The Americ an Journal of Human Genetics 2007, 81 (6):1304–1315. 19. Anto RJ, Mukhopadhy a y A, Shishodia S, Gairola CG, Aggarwal BB: Cigarette smoke condensate activ ates n uclear transcription factor-k appaB through phosphorylation and degradation of Ik appaB(alpha): correlation with induction of cyclo o xygenase-2 . Car cino genesis 2002, 23 (9):1511–1518. 20. Efron B, Tibshirani R: The problem of regions . The Annals of Statistics 1998, 26 (5):1687–1718. 21. F elsenstein J: Confidence limits on phylogenies: an approac h using the b ootstrap . Evolution 1985, 39 (4):783–791. 12 22. Efron B, Halloran E, Holmes S: Bo otstrap confidence levels for ph ylogenetic trees . Pr o c e e dings of the National Ac ademy of Scienc es 1996, 93 (23):13429–13429. 23. Jeffreys H, Jeffreys H: An in v arian t form for the prior probabilit y in estimation problems . Pr o c e e dings of the Royal So ciety of L ondon. Series A. Mathematical and Physical Scienc es 1946, 186 (1007):453–461. 13 Hypergeometric T est Wilc ox on Rank T est Correlation A cross Tw o Independent Simulated Datasets (100 replications) C D AB Mean Replication Probability Pr opor tion of Gene Sets with Observed p < 0.05 Density ● ● ● ● ● ● ● ● ● ● ● ● ● ● ● ● ● ● ● ● ● ● ● ● ● ● ● ● ● ● ● ● ● ● ● ● ● ● ● ● ● ● ● ● ● ● ● ● ● ● ● ● ● ● ● ● ● ● ● ● ● ● ● ● ● ● ● ● ● ● ● ● ● ● ● ● ● ● ● ● ● ● ● ● ● ● ● ● ● ● ● ● ● ● ● ● ● ● ● ● 0.0 0.2 0.4 0.6 0.8 1.0 0.0 0.2 0.4 0.6 0.8 1.0 [] Correlation = 0.65 0.5 0.6 0.7 0.8 0.9 1.0 02468 1 0 p−value R ● ● ● ● ● ● ● ● ● ● ● ● ● ● ● ● ● ● ● ● ● ● ● ● ● ● ● ● ● ● ● ● ● ● ● ● ● ● ● ● ● ● ● ● ● ● ● ● ● ● ● ● ● ● ● ● ● ● ● ● ● ● ● ● ● ● ● ● ● ● ● ● ● ● ● ● ● ● ● ● ● ● ● ● ● ● ● ● ● ● ● ● ● ● ● ● ● ● ● ● 0.00 0.05 0.10 0.15 0.20 0.25 0.00 0.05 0.10 0.15 0.20 0.25 Correlation = 0.98 −0.2 0.0 0.2 0.4 0.6 0.8 012345 p−value R Figure 1: Replicabilit y assessed b y simulation. Differential expression of specific genes was inserted into 1000 datasets, and b oth the observed p-v alues for the (A) hypergeometric and (B) Wilcoxon Rank tests and subsequent replication probabilities w ere calculated. The x-axis is the prop ortion of observ ed p-v alues that are less than 0.05 for eac h gene set and the y-axis is the a v erage replication probability for that gene set. Correlations were calculated using the Spearman metho d to av oid issues with non-linearit y . Then, one h undred sets (2288 genes) w ere generated each with t w o indep enden t simulated expression datasets, with differen tial expression signal inserted with some v ariability at 500 genes. Gene set tests were p erformed by the h yp ergeometric test, follow ed by gene set bagging, and distributions of Sp earman correlations betw een indep enden t datasets across 100 simulation runs for (C) all gene sets and (D) those significant in either indep enden t dataset at p < 0 . 05. The replication proportion offers better correlation b etw een indep enden t datasets for significan t gene sets, but similar correlation across all significan t and non-significan t gene sets, than the p-v alue for the h ypergeometric test. Lastly , (E) o v erall correlation is improv ed for the replication prop ortion versus the p-v alue for the Wilcoxon rank test when all gene sets are considered. 14 0.0 0.2 0.4 0.6 0.8 1.0 0.0 0.2 0.4 0.6 0.8 1.0 Hypergeometric T est 0.0 0.2 0.4 0.6 0.8 1.0 0.0 0.2 0.4 0.6 0.8 1.0 Wilco x on Rank T est A B P-value f or enrichment of gene set Replication Pr opor tion (R) of gene set Figure 2: Expression dataset gene set analysis. Gene set analyses were performed b y the (A) h ypergeometric and (B) Wilcoxon rank tests using gene sets defined by the Gene Ontology , and the replication of each gene set was assessed via our gene set bagging pro cedure (each p oin t is one gene set). The relationship betw een the estimated replication probability ( ˆ R ) and traditionally rep orted p-v alue app ears m uc h more stable using the Wilxo con rank test. 0.0 0.2 0.4 0.6 0.8 1.0 0.0 0.2 0.4 0.6 0.8 1.0 Hypergeometric T est 0.0 0.2 0.4 0.6 0.8 1.0 0.0 0.2 0.4 0.6 0.8 1.0 Wilco x on Rank T est A B P-value f or enrichment of gene set Replication Pr opor tion (R) of gene set Figure 3: DNA methylation dataset gene set analysis. Gene set analyses and gene set bagging w ere p erformed b y the (A) hypergeometric and (B) Wilcoxon rank tests using gene sets defined by the Gene Ontology . The relationship b et ween the estimated replication probability ( ˆ R ) and traditionally rep orted p-v alue appears are now only slightly more stable by the Wilxo con rank test, which can b e attributed to this dataset having appro ximately three times more samples under study . 15
Original Paper
Loading high-quality paper...
Comments & Academic Discussion
Loading comments...
Leave a Comment