Modeling and detecting change in temporal networks via a dynamic degree corrected stochastic block model
In many applications it is of interest to identify anomalous behavior within a dynamic interacting system. Such anomalous interactions are reflected by structural changes in the network representation of the system. We propose and investigate the use…
Authors: James D. Wilson, Nathaniel T. Stevens, William H. Woodall
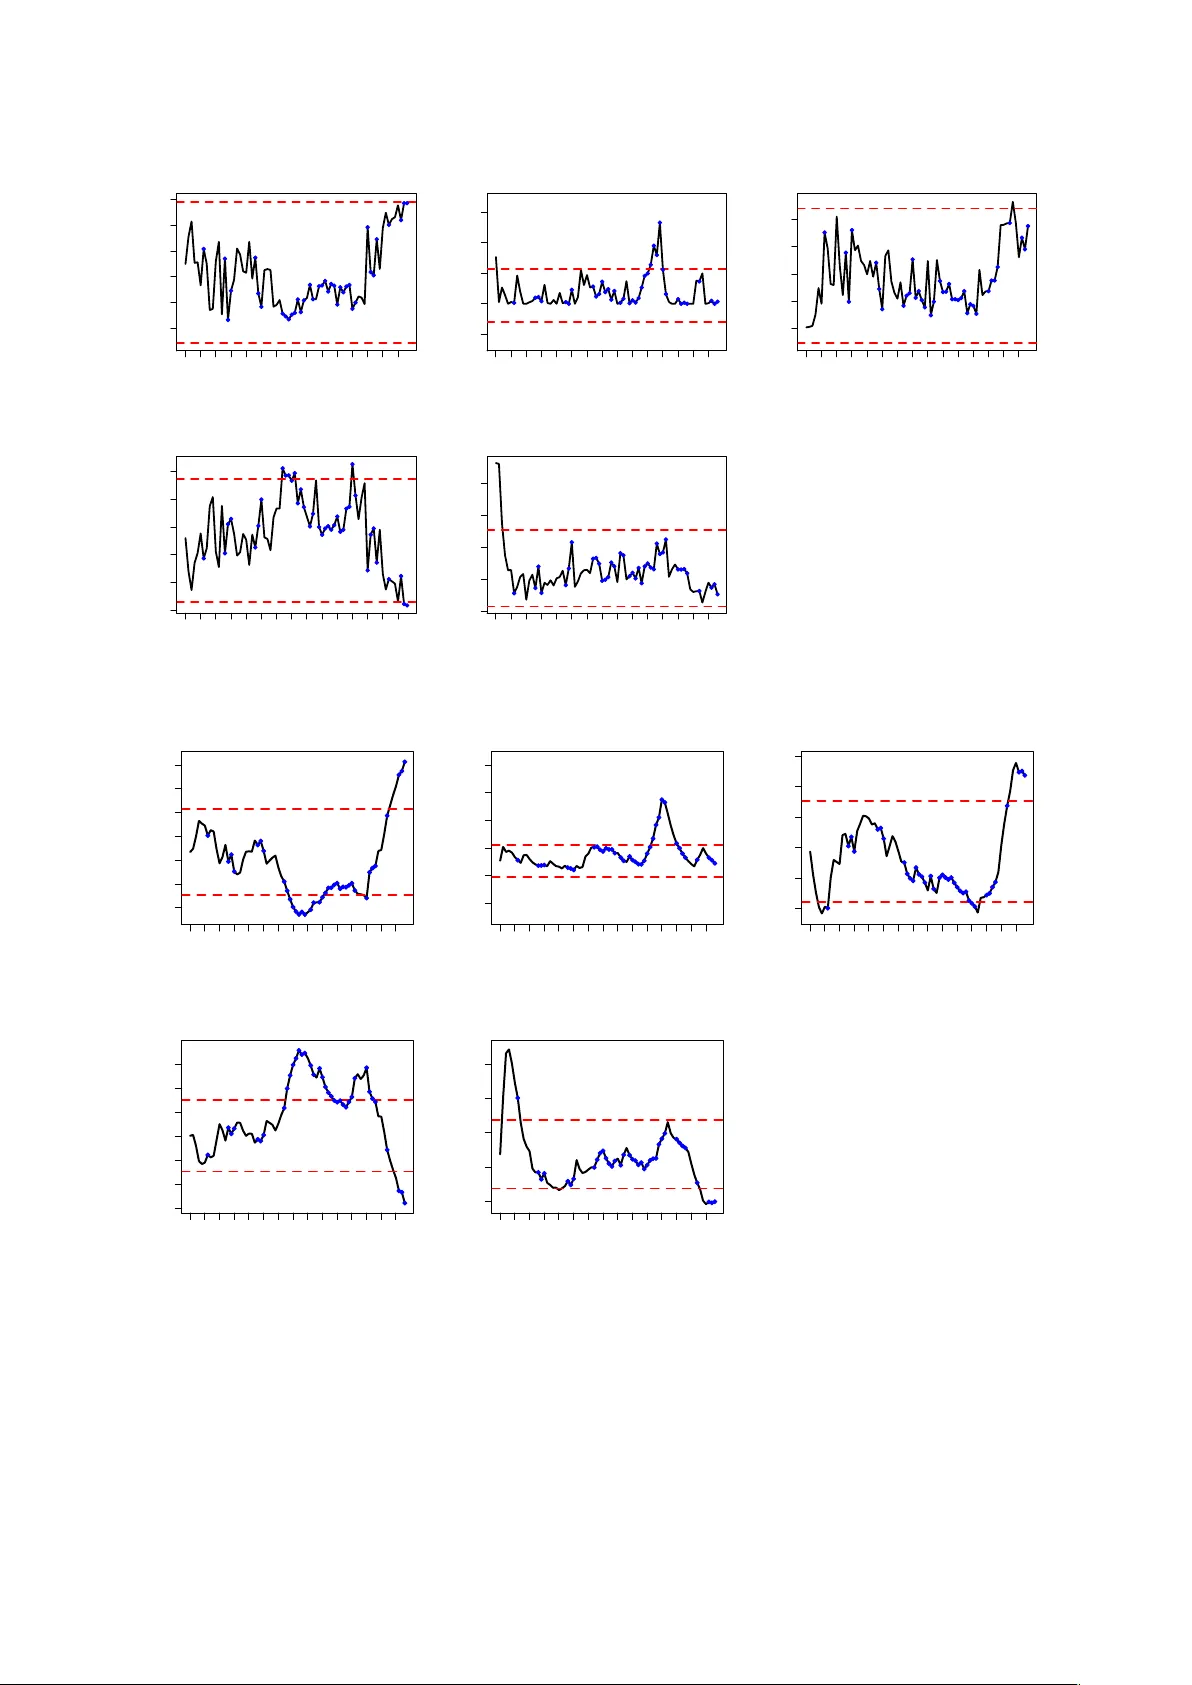
Modeling and Detecting Change in T emporal Netw orks via a Dy- namic Degree Corrected Stochastic Bloc k Model James D . Wilson Depar tment of Mathematics and Statistics, Univ ersity of San F rancisco . San F r ancisco , CA 94117 E-mail: jdwilson4@usfca.edu Nathaniel T . Ste v ens Depar tment of Mathematics and Statistics, Univ ersity of San F rancisco . San F r ancisco , CA 94117 E-mail: ntste vens@usfca.edu William H. W oodall Depar tment of Statistics, Virginia T ech. Blacksb urg, V A 24061 E-mail: bw oodall@vt.edu Summary . In many applications it is of interest to identify anomalous behavior within a dynamic interacting system. Such anomalous interactions are reflected by str uctural changes in the network representation of the system. We propose and inv estigate the use of a dynamic v ersion of the degree corrected stochastic bloc k model (DCSBM) to model and monitor dynamic networks that undergo a significant structural change. W e apply statistical process monitoring techniques to the estimated parameters of the DCSBM to identify significant str uctural changes in the network. Application of our sur veillance strategy to the dynamic U .S. Senate co-voting networ k re v eals that we are able to detect significant changes in the network that reflect both times of cohesion and times of polar ization among Republican and Democratic par ty members. These findings provide valuable insight about the ev olution of the bipar tisan political system in the United States. Our analysis demonstrates that the dynamic DCSBM monitor ing procedure eff ectively detects local and global structural changes in dynamic netw orks. The DCSBM approach is an e xample of a more general framework that combines parametric random graph models and statistical process monitoring techniques f or network sur veil- lance. K e ywords : anomaly detection, community detection, dynamic graphs, statistical process moni- toring, online sur veillance 1. Introduction Time-v arying, or dynamic, net w orks are often used to model the in teractions of a group of actors through time. In many applications, it is of in terest to identify anomalous b eha vior among the actors within a dynamic net w ork. F or example, organizers of the Arab Spring uprisings in 2012 tended to in teract with one another more frequen tly on F aceb o ok at the onset of the uprisings ( V argas , 2012 ). Similarly , cen tral pla y ers in the ENR ON scandal exc hanged an increased n um ber of emails prior to fraud in vestigations ( Shett y and Adibi , 2005 ). In b oth of these examples, anomalous activit y o ccurred among the inter actions of the actors of the system; as a result, these changes can b e observed in the net w ork describing the actors. The monitoring of dynamic netw orks for anomalous c hanges through time is known as network surveil lanc e . Netw ork surveillance tec hniques hav e b een successfully applied in a n um ber of set- tings, including the detection of fraud in large online netw orks ( Chau et al. , 2006 ; P andit et al. , 2007 ; Akoglu and F aloutsos , 2013 ), the identification of central play ers in terrorist groups ( Krebs , 2002 ; Reid et al. , 2005 ; Porter and White , 2012 ), and the detection of spammers in online social net w orks ( Fire et al. , 2012 ). As recent applications of net w ork surv eillance ha v e gro wn in complex- it y , there has been an increased in terest in dev eloping new scalable net work surv eillance tec hniques, esp ecially in the area of so cial netw ork monitoring (see Sa v age et al. ( 2014 ), Bindu and Thilagam ( 2016 ), and W o odall et al. ( 2016 ) for recent reviews). A useful area to help guide netw ork surv eil- 2 James D . Wilson et al. lance is statistical pro cess monitoring (SPM) † . In general, statistical pro cess monitoring provid es a metho dology for the real-time surveillance of any characteristic of interest. The philosoph y b e- hind SPM is that anomalous b eha vior in suc h a c haracteristic can b e identified b y distinguishing un usual v ariation from typical v ariation in an ordered sequence of observ ations. Stemming from applications in industrial manufacturing and public health surv eillance, SPM has a ric h history and many metho ds ha v e b een developed (see W o o dall and Mon tgomery ( 1999 ), F ris´ en ( 2009 ) and W o o dall and Montgomery ( 2014 ) for reviews of metho ds and applications). In this article we prop ose a netw ork surv eillance framew ork that applies statistical process monitoring to the estimated parameters of a dynamic random graph mo del. W e prop ose the use of a dynamic v ersion of the degree corrected sto c hastic block mo del (DCSBM) from Karrer and Newman ( 2011 ). The DCSBM is a probabilit y distribution on the family of undirected graphs with discrete-v alued edge weigh ts. Imp ortan tly , the DCSBM dictates the prop ensit y of connection b et w een actors and captures t w o important aspects of so cial net w orks: heterogeneous connectivity , and communit y structure. As many monitoring applications in v olv e so cial comm unications, e.g., the terrorist netw orks in Pandit et al. ( 2007 ) and Akoglu and F aloutsos ( 2013 ), the DCSBM can b e used to simulate realistic net w orks. The DCSBM is c haracterized by parameters for which closed-form maxim um likelihoo d estima- tors (MLEs) can b e readily derived. W e use statistical pro cess monitoring to iden tify time p oin ts at which the parameter estimates of the DCSBM change. Here, w e inv estigate t w o widely-studied SPM metho ds for surveillance, the Shewhart con trol chart for individual observ ations and the exp onen tially weigh ted mo ving av erage (EWMA) con trol chart ( Montgomery , 2013 ). W e apply our surveillance strategy to the dynamic co-voting net w ork of the U.S. Senate, whic h mo dels the v oting b eha vior of U.S. Senators from 1867 to 2015. W e find that our surveillance strategy is able to iden tify eras of cohesion and division among the Republican and Demo crat parties, and that these changes coincide with significant p olitical ev en ts in U.S. history . This analysis, as well as our sim ulation study , rev eals that our netw ork surv eillance method with the DCSBM is an effective monitoring strategy for dynamic netw orks that undergo change. Our proposed monitoring strategy establishes one practically useful technique among a gen- eral family of metho ds for surveillance. Our framework relies on t w o comp onents: a parametric dynamic random graph mo del for mo deling the features of the graph, and control c harts from statistical pro cess monitoring for the detection of changes in the parameters. Here, we consider a dynamic DCSBM random graph mo del and the Shewhart and EWMA con trol c harts for surveil- lance. Ho w ev er, this same framew ork can b e used for an y parametric dynamic random graph mo del and an y con trol c hart of the user’s c hoice. F or example, one could inv estigate dynamic exp onen tial random graph mo dels like those describ ed b y Hanneke et al. ( 2010 ) and Krivitsky and Handco c k ( 2014 ), or dynamic laten t space models suc h as that in tro duced in Sew ell and Chen ( 2015 ). F urthermore, one could further in v estigate the use of other univ ariate SPM metho ds suc h as cumulativ e sum (CUSUM) control c harts or control c harts for attributes and p erhaps multiv ari- ate SPM approac hes such as Hotelling T 2 or multiv ariate EWMA con trol charts ( Montgomery , 2013 ). Our curren t prop osal serves only as a first step in understanding the utilit y of our prop osed framew ork. The remainder of this manuscript is organized as follows. In Section 2 w e describ e the net w ork surv eillance problem in detail and discuss general approaches in the area. Section 3 describ es re- lated model-based surveillance approac hes. Section 4 provides a description of the degree corrected sto c hastic block mo del for net works with discrete-v alued edges, and ho w to sim ulate dynamic DCS- BMs with structural c hange. Next w e discuss ho w to estimate and monitor the DCSBM using SPM tec hniques in Section 5 . In Sections 6 and 7 we inv estigate the utility of our prop osed mo del and surv eillance strategy on sim ulated netw orks and through application to the U.S. Senate co-voting net w ork. W e end with a discussion of op en areas for future research in Section 8 . † Historically the field of SPM has b een referred to as statistical pro cess control, but recen tly many replace the w ord “control” with “monitoring” ( W o odall , 2016 ). Detecting Change in T emporal Networks with the DCSBM 3 2. The Network Surveillance Problem Consider a collection of actors or individuals [ n ] = { 1 , . . . , n } , whose in teractions hav e b een recorded at times t = 1 , . . . , m . In many applications, it is conv enien t to represent the interactions of [ n ] at time t b y an undirected net w ork G t = ([ n ] , W t ). Here, the actors [ n ] are treated as no des or vertic es in the graph, and W t = { w u,v ( t ) : u, v ∈ [ n ] } is the set of e dge weights , where w u,v ( t ) quan tifies the strength of the relationship b etw een nodes u and v at time t . A dynamic net w ork mo del of the individuals [ n ] ov er time t = 1 , . . . , m is the ordered sequence of undirected graphs G ( n, m ) = { G 1 , . . . , G m } . The edge weigh t w { u,v } ( t ) may , for example, represent the num b er of communications betw een individuals u and v at time t in a dynamic so cial netw ork, or the n um b er of in teractions b etw een tw o genes u and v at time t in a biological netw ork. Note that an un w eigh ted graph, where eac h edge weigh t is binary , is a sp ecial case where edges indicate the presence or absence of a sp ecified lev el of connection b et w een no des u and v at time t . The goal of net w ork surv eillance is to prospectively monitor the in teractions of [ n ] so as to detect abnormal b ehavior among the actors. T o p erform surv eillance, one generally first sp ecifies a statistic S t , or more generally a vector of statistics S t , that provides some lo cal or global summary of the netw ork G t based on the t ypes of anomalies to b e detected. The c hoice of S t is flexible. In the simplest case, one can choose a statistic that summarizes some top ological asp ect of G t , suc h as the connectivit y of each no de, the clustering of nodes, or the av erage shortest distance b et w een each pair of no des ( Prieb e et al. , 2005 ; Marchette , 2012 ; Neil et al. , 2013 ; P ark et al. , 2013 ). In man y cases, the choice of statistic is driven by the application, suc h as the Enron email net w ork analysis in Prieb e et al. ( 2005 ). Alternativ ely , one can mo del G t b y a family of probability distributions gov erned by parameters Ψ . In this case, one may sp ecify S t as an estimator, or some lik eliho od ratio statistic, asso ciated with Ψ . W e discuss these mo del-based approaches in more detail in Section 3 . Once a statistic S t has b een c hosen, SPM is used to distinguish un usual b eha vior from typical b eha vior. In net w ork surv eillance, this corresp onds to the real-time identification of unu sually large or small v alues of S t . The most p opular technique used to determine the extremity of S t is a c ontr ol chart – a time series plot of S t constructed with c ontr ol limits that indicate b oundaries of typical b ehavior. An observ ed v alue of S t is considered anomalous if it deviates significantly from what previous observ ations suggest is t ypical. Monitoring consists of tw o phases, Phase I and Phase II , which are describ ed b elow. Phase I : The statistic S t is calculated for all graphs G t ∈ G ( n, m ). The mean µ and v ariance σ 2 of S t are estimated using the m sampled statistics. A tolerance region R ( b µ, b σ 2 ) is constructed based on the estimated v alues for µ and σ 2 . The upp er and low er b ounds of this region are referred to as upp er and low er control limits, resp ectiv ely . V ariation within these limits defines t ypical b ehavior. Phase I I : F or each new graph G t , with t > m , S t is calculated, and G t is deemed “typical” if S t ∈ R ( b µ, b σ 2 ) and deemed “anomalous” otherwise. When an observed v alue of S t exceeds these limits, we sa y that the control c hart has signal le d ; this serves as an indication that a structural c hange has o ccurred. Data collected within Phase I serv es as a baseline to establish what defines “typical” v ariation in S t . Prospective monitoring b egins in Phase I I. F or t > m , we formally decide whether the graph G t demonstrates anomalous b eha vior b y comparing S t to the control limits defined in Phase I. Figure 1 illustrates a toy example of this proce dure. As G ( n, m ) is used to determine the tolerance region R ( b µ, b σ 2 ), successful monitoring in Phase I I requires that the data in Phase I pro vide an accurate representation of typical v ariation; if µ and σ 2 are not accurately e stimated, then the con trol limits defined by R ( b µ, b σ 2 ) are unlik ely to b e applicable b ey ond the Phase I time frame. Ideally the control limits will balance the need for a control chart that is sensitiv e enough to detect imp ortan t changes, while not signalling to o frequen tly and creating an excessive n um ber of false alarms. Jones-F armer et al. ( 2014 ) discuss the imp ortance of effectively collecting and analyzing baseline data during Phase I. If the net w ork b eing monitored is exp ected to evolv e o v er time, then w e recommend mo ving windo w approac hes 4 James D . Wilson et al. Tim e 1 m Phase I Phase II m + 1 … … 1 m m + 1 S t A. B. … Tim e Phase I Phase II … Fig. 1. T oy example illustrating networ k sur veillance using the statistic S t , and the distinction between Phase I and Phase II. as opp osed to a fixed Phase I sample as in Zhao et al. ( 2016 ). The p erformance of a surveillance technique dep ends also on the definition of R ( b µ, b σ 2 ), which largely dep ends on the goal of the con trol c hart and the type of data b eing plotted. Abnormal activit y in Phase I I net w orks may b e brief - where as few as one or t wo anomalous graphs are observ ed, or it ma y persist o v er an extended perio d of time. T o detect sudden large c hanges a standard Shewhart control chart is t ypically used ( Mon tgomery , 2013 ). How ever, if sensitivity to sustained small and medium-sized c hanges is of in terest, one might consider using an exponentially w eigh t moving a v erage (EWMA) con trol chart. See Saleh et al. ( 2015 ) and Sparks and Wilson ( 2016 ) for recent adv ances in EWMA control c hart tec hniques. In practice, the choice of statistic S t and t yp e of con trol c hart will dep end on the t ypes of net w ork changes one wishes to detect. F or instance if one seeks to detect a global c hange in the net w ork (where there is an o v erall c hange in the structure, e.g. comm unications on a v erage increase or decrease o v er the entire netw ork) the choice of statistic and chart will b e different than if one needs to detect a lo cal change in the net w ork (where there is a change in structure among some sub-graph of the net w ork, e.g. comm unications on a v erage increase or decrease within a particular comm unit y). In Section 7 we use the DCSBM to simulate a v ariety of local and global net w ork changes and w e use a Shewhart control c hart for individuals to detect these changes. The con trol limits for this con trol chart are defined as R ( b µ, b σ 2 ) = b µ ± 3 b σ . The performance of this surveillance tec hnique will b e quan tified using the a v erage run length (ARL); the av erage num b er of graphs until a signal indicates a c hange in the net w ork. One w ould lik e the ARL to be small if a c hange has b een sim ulated and large otherwise. McCulloh and Carley ( 2011 ) defined an av erage detection length metric, and Zhao et al. ( 2016 ) define an av erage time-to-signal metric, which are b oth equiv alen t to the ARL. W e prop ose that our results be used as a performance b enc hmark, against whic h other surv eillance tec hniques can b e ev aluated and compared. W e also make recommendations regarding whic h statistics to use given the t yp e of change one wishes to detect. Detecting Change in T emporal Networks with the DCSBM 5 3. Related W ork The DCSBM generalizes sev eral families of w ell-studied and widely-applied random graph mod- els, such as the (non-degree corrected) sto c hastic blo ck mo del from Holland et al. ( 1983 ); Snijders and No wic ki ( 1997 ); Nowic ki and Snijders ( 2001 ). The dynamic sto c hastic blo c k mo del from Xu and Hero ( 2013 ), like the DCSBM, can be used to mo del time-v arying comm unit y structure in a net w ork. How ev er, the dynamic sto chastic blo ck mo del can only b e applied to netw orks with binary edges, and do es not address degree hetergeneit y in the netw ork. F u et al. ( 2009 ) devel- op ed a mixed mem b ership sto c hastic blo c k mo del, a dynamic extension to the mixed membership sto c hastic block mo del from Airoldi et al. ( 2009 ), whic h models netw orks with p otentially ov er- lapping communit y structure. W e describ e the relationship of the DCSBM with sev eral other imp ortan t families of random graph mo dels in the App endix. There are other mo del-based approac hes for net w ork surv eillance that ha ve been recently dev el- op ed; w e briefly describ e some of them here. Azarnoush et al. ( 2016 ) prop osed a longitudinal logistic mo del that describ es the (binary) o ccurence of an edge at time t as a function of time-v arying edge attributes in the sequence of net w orks G ([ n ] , T ). This model dictates edge probabilities b y the v alues β = ( β 1 , . . . , β p ), where β j parameterizes the effect of the edge attribute j on the probabilit y of an edge. T o identify anomalous b eha vior at time t , one first calculates the maxim um likelihoo d estimates b β 1 and b β 2 for graphs G 1 = { G 1 , . . . , G t − 1 } and G 2 = { G t , . . . , G T } , resp ectively under the longitudinal mo del. A likelihoo d ratio test is used to test the null h ypothesis that b β 1 and b β 2 are equal; a rejection of the n ull h ypothesis suggests a significant change b et w een G 1 and G 2 . P eel and Clauset ( 2014 ) dev elop ed a generalized hierarc hical random graph mo del (GHR G) to mo del G ([ n ] , T ). T o detect anomalies, the authors used the GHR G as a null mo del to compare observ ed graphs in G ([ n ] , T ) via a Bay es factor. A t each time t , Bay esian p osterior inference via Mark o v Chain Mon te Carlo is used to fit the GHR G to the graph G t . Anomalies are detected using a sliding window approac h on the Bay es factor that compares observed graphs to the GHR G fit for previous observ ations. In Heard et al. ( 2010 ) the authors considered monitoring c hanges in communication volume b et w een subgroups of targeted people o v er time. Their approac h ev aluates pairwise c omm unication coun ts and determines whether these hav e significantly increased using a p-v alue. The p-v alue assesses the deviation of the communication rate at time t and what is considered normal b eha vior under conjugate Bay esian mo dels describing the discrete-v alued time series of communications up to time t . While their fo cus is detecting changes on the entire netw ork, our approach considers detecting anomalies for members of a comm unit y within a dynamic netw ork. Sparks and Wilson ( 2016 ) consider the monitoring of abrupt changes among an unknown set of actors in a dynamic net w ork. They establish an EWMA strategy for detecting such changes, whic h incorp orates the uncertain tly of the type and size of the subset of actors undergoing a c hange. In particular, they dev elop strategies for collaborative teams, where actors in the team each comm unicate more regularly; dominant leader teams, where one actor’s comm unication greatly increases to the remainder of the team; and global outbreaks. The c hange p oint approach developed in Barnett and Onnela ( 2016 ) seeks significant changes in correlation netw orks, where the correlation netw ork at time t represen ts the correlation of some underlying m ultiv ariate sto c hastic pro cess at that time. F or eac h t , the F rob enius distance F ( t, t − ) betw een the correlation netw ork at time t and the av erage of the correlation net works from times 1 , . . . , t − 1 is calculated. The authors then generate a sample of “n ull” netw orks by b ootstrapping a sample of t netw orks where no c hange is in troduced. The graph G t is said to demonstrate anomalous b eha vior if F ( t, t − ) is significan tly different than the F rob enius distance under the b o otstrapped sample of netw orks. Ro y et al. ( 2014 ) considered the detection of a change p oin t in a sequence of evolving Marko v random fields. They prop osed and analyzed the statistical prop erties of a maximum p enalized pseudo-likelihoo d estimate, under appropriate sparsity (in the total n um ber of edges) assumptions on the netw orks in G ([ n ] , T ). 6 James D . Wilson et al. 4. The Degree Corrected Stochastic Block Model In this section we describ e the degree corrected sto c hastic blo ck mo del (DCSBM) for w eigh ted net w orks. Let G = ([ n ] , W ) b e an undirected net w ork that represents the in teractions of actors [ n ]. The DCSBM models tw o imp ortan t features of real netw orks: (i) comm unit y structure and (ii) degree heterogeneity , whic h we now briefly discuss. Empirically the no des of a netw ork G can often b e divided into k ≥ 1 disjoint vertex sets as [ n ] = V 1 ∪ V 2 . . . ∪ V k in such a wa y that the num ber (or densit y) of edges within eac h vertex set V j ⊆ [ n ] is substantially greater than the num b er of edges b et w een differing sets. The vertex sets are commonly referred to as c ommunities . In man y applications, the communities of a netw ork pro vide structural or functional insigh ts ab out the modeled complex system. F or example, recen tly comm unit y structure has b een used to help develop h yp otheses ab out gene interactions and an tibi- otic resistance ( Park er et al. , 2015 ), and ab out the dynamics of so cial interactions using cell phone data ( Greene et al. , 2010 ). The substan tial relev ance of communities in netw ork systems has lead to a large and gro wing literature ab out communit y structure and the iden tification of statistically meaningful comm unities (see Porter et al. ( 2009 ) or F ortunato ( 2010 ) for reviews). In addition to naturally dividing into densely connected communities, actors in a netw ork tend to hav e a highly v ariable propensity to mak e connections. In these situations, the de gr e e distribution of the no des are v ariable, where the degree d u of a no de u ∈ [ n ] is the total n um ber of interactions in whic h u takes part, namely d u = X x ∈ [ n ] w u,x . The scale-free family of netw orks is one common family of net works with heterogenous degrees. In scale-free net w orks, the degree distribution appro ximately follo ws a p ow er law ( Barab´ asi and Alb ert , 1999 ; Clauset et al. , 2009 ). Scale-free net w orks commonly arise in economic, so cial, and ecological netw orks (e.g., Kasth urirathna and Pirav eenan ( 2015 ) studied a recent example). The tendency of degree heterogeneit y in real net works has lead to significan t w ork in the dev elopmen t of fixed-degree random graph mo dels ( Chatterjee et al. , 2011 ), and in the dev elopmen t of comm unit y detection metho ds ( Newman , 2006 ). Next in Section 4.1 , we first fully describ e the DCSBM mo del for a single netw ork, and then in Section 4.2 , w e describ e how to simulate a dynamic DCSBM that undergo es a structural change. W e discuss the relationship of the DCSBM with several other imp ortan t random graph mo dels in the App endix. 4.1. The Model Let G represen t the family of all undirected netw orks with n no des and k disjoin t comm unities. The DCSBM is a probabilit y distribution P ( · ) = P ( · | θ , π , P ) on G that is c haracterized b y (i) non- negativ e degree par ameters θ = ( θ 1 , . . . , θ n ), whic h reflect the tendency of the no des to connect, (ii) con tainmen t probabilities π = ( π 1 , . . . , π k ) that satisfy π r > 0 and P r ∈ [ k ] π r = 1, where π r sp ecifies the probability of a no de b elonging to comm unit y r and (iii) the k × k symmetric connectivit y matrix P = ( P r,s ), where entries P r,s > 0 express the prop ensity of connection betw een no des in comm unities r and s . Let b G ∈ G b e a random graph with n no des and k communities generated under P . Then b G can b e obtained by a simple generativ e pro cedure, which can b e describ ed as follo ws: (a) Parameters θ , π , and P are pre-sp ecified and fixed. These are chosen to con trol the de- gree v ariability , relative size of communities, and connection prop ensity b et w een and within comm unities, respectively . (b) V ertices are randomly assigned communit y lab els c = ( c 1 , . . . , c n ) according to the multino- mial dra ws: c u i.i.d ∼ Multinomial(1 , π ) . (1) Detecting Change in T emporal Networks with the DCSBM 7 (c) Given θ , c , and P , edge w eights { w u,v : u, v ∈ [ n ] } are assigned according to independent P oisson dra ws, where E [ w u,v | c , θ , P ] = θ u θ v P c u ,c v (2) The graph b G is then defined as the netw ork with no des [ n ], comm unit y lab els c , and edge w eigh ts w = { w u,v : u, v ∈ [ n ] } resulting from ( 1 ) and ( 2 ). F or an observed net w ork with communit y lab els c and edge weigh ts w , w e define n r = X u ∈ [ n ] I ( c u = r ) as the num ber of vertices in comm unit y r . F urther we define m r,s = X u : c u = r X v : c v = s w u,v as the total weigh t of edges b et w een communit y r and s (twice the w eigh t of edges when r = s ). It follo ws b y com bining ( 1 ) and ( 2 ) that the join t distribution of the random graph b G and communit y lab els C is describ ed by the join t probability mass function P ( · , · ), where when ignoring constants, P ( b G = G, C = c | θ , π , P ) ∝ Y r ∈ [ k ] π n r r Y u ∈ [ n ] θ d u u Y r,s ∈ [ k ] P m r,s 2 r,s e − n r n s P r,s 2 (3) × Y u m so that the change o ccurs after Phase 8 James D . Wilson et al. I. W e note that in principle one can simulate net w orks with multiple changes, as w ell as netw orks with c hanges that affect a small n um b er of netw orks. The c hanges θ → θ ∗ , c → c ∗ , and P → P ∗ eac h reflect a differen t t yp e of structural change in the simulated dynamic netw ork. W e first describ e ho w to simulate b G ( n, T ), and then discuss the effects of eac h of these three t yp es of changes. T o simulate a dynamic netw ork b G ( n, T ) according to ( 5 ), one can readily use the Algorithm outlined b elo w. Algorithm Sim ulating a dynamic DCSBM with structural change Giv en : c , c ∗ , P , P ∗ , { δ r , δ ∗ r ∈ [0 , 1] } r =1 ,...,k Step I : F or t = 1 , . . . , t ∗ − 1 – Generate prop ensit y parameters θ (0) u i.i.d ∼ U (1 − δ c u , 1 + δ c u ) – Scale θ (0) u v alues to ensure identifiabilit y: θ u = n c u θ (0) u X v : c v = c u θ (0) v – Generate edges of b G t as independent Poisson draws w u,v ∼ P oisson ( θ u θ v P c u ,c v ) Step I I : F or t = t ∗ , . . . , T – Rep eat Step I with up dated parameters: P → P ∗ , δ r → δ ∗ r , and c → c ∗ W e choose the uniform random v ariable to simulate θ to (i) induce sto chastic v ariability of the degree sequence of the graphs through time and (ii) parameterize the mean and v ariability of the prop ensit y of connection of the no des within communit y r with a single parameter δ r . In practice, an y non-negativ e con tin uous or discrete random v ariable with finite mean and v ariance can b e used here and dep ends on the application. F or example, if one observes that the degree sequence is constan t through time when the pro cess is stable, then one can sim ulate θ once and use the same v alues for eac h graph in the dynamic sequence. By altering the parameters that dictate the DCSBM from time t ∗ − 1 to t ∗ , we are able to model sev eral t ypes of structural change among the actors [ n ] in b G ( n, T ), including the following: (i) Change in r ates of inter action : In general, one can introduce a mean shift in interaction rate in comm unit y r by sp ecifying P ∗ r,r 6 = P r,r . Doing so will also affect the v ariance of the in teraction rate in the comm unit y . In particular, the mean and v ariance of the n um ber of in teractions in communit y r will decrease at time t ∗ when P ∗ r,r < P r,r , and increase when P ∗ r,r > P r,r . One can introduce a c hange in v ariance of the interaction rate in communit y r b y sp ecifying δ ∗ r 6 = δ r ; in particular, this v ariance will increase if δ ∗ r > δ r and decrease if δ ∗ r < δ r . (ii) Communic ation outbr e aks : In net w ork surveillance, one is often interested in iden tifying “com- m unication outbreaks” among the mem b ers of some sub-graph Ω ⊆ [ n ] in the net w ork. A comm unication outbreak corresp onds to an increase in the a verage num ber of in teractions among the members of Ω. Using the DCSBM, w e can mo del communication outbreaks among any num ber of comm unities in the net w ork. F or example, a communication outbreak among the members of comm unit y j is mo deled by sp ecifying P ∗ r,r > P r,r as the mean and v ariance of the interactions in communit y r will increase at time t ∗ . W e can mo del a glob al comm unication outbreak by sp ecifying P ∗ r,s > P r,s for all r, s ∈ [ k ]. Detecting Change in T emporal Networks with the DCSBM 9 (iii) Change in c ommunity structur e : A change in comm unit y structure of a so cial net w ork can signify an imp ortan t transition in the mo deled system. F or example, in the p olitical v oting net w ork w e consider in Section 6 , the communit y structure asso ciated with the members of the U.S. Senate significantly changes at times of extreme p olarization of the Republicans and Demo crats ( Moo dy and Mucha , 2013 ). Chen et al. ( 2012 ) describe six general types of communit y structure changes in a netw ork, including growth, shrink age, birth, death, the merging of t wo comm unities, or the splitting of a single communit y in to tw o or more comm unities. In general, each of these t yp es of changes can b e implemented at time t ∗ b y sp ecifying new communit y lab els c ∗ 6 = c . Using the DCSBM, we are able to generate a dynamic random graph b G ([ n ] , T ) that reflects a structural change at time t ∗ . In this w a y , we can use b G ([ n ] , T ) as a ground truth on which one can assess the strengths and weaknesses of any net w ork surv eillance metho d. 5. Monitoring the Dynamic DCSBM Supp ose that we observe a dynamic graph sequence G ( n, T ) = { G 1 , . . . , G T } that is generated under the dynamic DCSBM according to ( 5 ). Our goal is to iden tify time p oints at whic h there is a change in the distribution that generated G ( n, T ). T o detect such changes, we propose a surveil- lance strategy that pro ceeds in tw o steps. First, the dynamic DCSBM is fitted to G ( n, T ) using maxim um likelihoo d estimation. Next, con trol charts are applied to functions of these maximum lik eliho od estimators to detect c hanges. In general, an y con trol chart can be used to detect c hanges and indeed this should b e further explored in future w ork; ho w ev er, in this man uscript we consider the use of the Shewhart and EWMA con trol charts for individuals. W e first describ e estimation of the DCSBM and then our monitoring strategy . 5.1. Fitting the dynamic DCSBM 5.1.1. Estimation of Communities The estimation of the communit y lab els c , otherwise kno wn as c ommunity dete ction , is kno wn to b e an NP hard problem; as a result one must estimate the lab els using an approximate algorithm. Man y detection metho ds hav e b een dev elop ed for weigh ted and unw eighted netw orks (see Porter et al. ( 2009 ); F ortunato ( 2010 ) for reviews). The sp ectral clustering algorithm ( V on Luxburg , 2007 ) is particularly w ell-suited for this setting due to its theoretical guarantees ( Han et al. , 2015 ; Qin and Rohe , 2013 ; Sussman et al. , 2012 ), whic h we now briefly mention. Let m denote the num b er of Phase I graphs in G ( n, T ), and assume that m < t ∗ . Define the a v erage Phase I graph by G = 1 m m X j =1 G j , where the sum of tw o graphs G 1 = ([ n ] , W 1 ) and G 2 = ([ n ] , W 2 ) is the graph with no de set [ n ] and edge weigh ts W 1 + W 2 . If the probability matrix P has no iden tical rows, then spectral clustering of the graph G will pro vide asymptotically consisten t comm unit y lab el estimates b c , as m → ∞ . This is stated formally in the next theorem. Theorem 1. L et G ( n, T ) = { G 1 , . . . , G T } b e a se quenc e of gr aphs gener ate d under the dynamic DCSBM with binary e dges given by ( 5 ), wher e 1 < t ∗ ≤ T is the time of structur al change. That is for t < t ∗ , G t is gener ate d under the DCSBM with c ommunity lab els c , pr op ensity p ar ameters θ , and pr ob ability matrix P . L et m < t ∗ and define G = 1 m P m j =1 G j . L et b c = ( b c 1 , . . . , b c n ) denote the c ommunity lab el estimates obtaine d fr om applying sp e ctr al clustering to the gr aph G . If P has no identic al r ows and θ satisfies the c onstr aint in ( 4 ), then up to p ermutation, b c = c , a.s. as m → ∞ . Theorem 1 is an immediate consequence of the main result presented in Han et al. ( 2015 ). The result of the theorem suggests that if the num ber of Phase I graphs is large enough, w e can obtain consistent estimators for the communit y structure for the sequence of graphs b efore t ∗ . 10 James D . Wilson et al. This theorem suggests that one should use as many Phase I graphs as p ossible, but in practice the c hoice of m dep ends on the judgement of the practitioner. F or monitoring purp oses, w e suggest using the regularized sp ectral metho d from Qin and Rohe ( 2013 ) on the Phase I graphs in the sequence and monitoring the parameter estimates conditional on the estimated communit y lab els for the entir e sequence of graphs. As we will see, in man y cases c hanges in the communit y structure will b e reflected b y c hanges in the parameter estimates de- scribing the DCSBM. Though we do not pursue it here, future work should in v estigate surv eillance of comm unit y lab els themselv es. 5.1.2. Maxim um Likelihoo d Estimation of P arameters W e now briefly summarize the maxim um likelihoo d estimation of the DCSBM, whic h w as deriv ed in Y an et al. ( 2014 ). W e assume that c is fixed for all t and is equal to the estimators b c obtained from spectral clustering described ab o v e. F rom ( 3 ), w e can sho w that the log lik eliho o d of ( θ , π , P ) given an observ ed graph G = ([ n ] , W ) and comm unit y lab els is, when ignoring constants, ` ( θ , π , P | G, c ) ∝ X r ∈ [ k ] n r log( π r ) + X u ∈ [ n ] d u log( θ u ) + 1 2 X r,s ∈ [ k ] ( m r,s log( P r,s ) − n r n s P r,s ) (6) T aking deriv ativ es, it is readily shown from ( 6 ) that the maximum lik eliho od estimator (MLE) for eac h parameter has a closed-form solution. F or u ∈ [ n ] and r, s ∈ [ k ], the maximum likelihoo d estimators are given by b θ u = d u n − 1 r X w : c w = c u d w , b π r = n r n , b P r,s = m r,s n r n s . (7) 5.2. Monitoring Strategy T o develop a monitoring strategy that detects lo cal and global changes in a netw ork, we first supp ose that the communit y lab els c are fixed throughout time. Let k b e the n um ber of distinct comm unit y lab els. Giv en c , we directly monitor the MLE b P , where at eac h time t w e estimate the k 2 unique entries of b P for graph G t . This statistic reflects the o v erall connection prop ensit y among communities. T o monitor for changes in θ , one could in principle monitor eac h statistic b θ u separately; how ev er, this leads to an unmanageable n um be r of con trol charts. Instead we monitor the sample standard deviation of the estimates { b θ j : c j = r } at eac h time t . In particular w e monitor the statistic given by s r = 1 n r − 1 X u : c u = r ( b θ u − 1) 2 ! 1 / 2 , r = 1 , . . . , k . (8) Our choice in using the standard deviation is motiv ated b y the fact that sub ject to ( 4 ), the exp ectation of { θ u : c u = r } is fixed to b e exactly 1. Thus, we use s r to capture the v ariability in o v erall connection within communit y r . W e note that it is p ossible for δ r to remain fixed while the prop ensity parameters change. F or example, in yet to b e published work Y u et al. ( 2016 ) define a θ for eac h individual within a comm unit y , and treat these prop ensities as fixed parameters to b e mo deled and monitored. Their fo cus is the detection of c hange in individual connection prop ensities within communities. In summary , our surveillance plan monitors k 2 + k statistics { b P q ,r , s q : q ≤ r ∈ [ k ] } through time. Ev en though our statistics are derived with the assumption of fixed comm unit y structure, w e exp ect these statistics to capture some communit y structure changes as well, since in this scenario the mean connectivity of no des in the netw ork will also likely change. Detecting Change in T emporal Networks with the DCSBM 11 5.2.1. Shewhart Control Chart F or eac h of the statistics that w e estimate, w e use a Shewhart and EWMA control charts to determine what v alues indicate a significant c hange. Let S t b e a statistic at time t , and let m b e the n um b er of Phase I netw orks. F or t > m , the Shewhart control chart for individual outcomes signals a change in the statistic if S t lies outside of the control limits b µ ± 3 b σ , where b µ is the sample mean of the m Phase I observ ations, and b σ is the mo ving range estimate for the standard deviation of these m observ ations given by b σ = √ π 2( m − 1) m X j =2 | S j − S j − 1 | . Note that the constant 2 / √ π is equiv alent to d 2 , the normalization constan t used in the con trol c hart literature. 5.2.2. EWMA Control Chart Whereas the Shewhart con trol chart is designed to detect sudden large c hanges in S t , the width of the ± 3 b σ limits results in reduced sensitivit y to p ersisten t c hanges that are small to medium in size. In this situation the EWMA control chart is to b e preferred ov er the Shewhart control chart. Instead of plotting the observ ed v alues of S t directly , for t > m the EWMA control chart is a time series plot of Z t , the exp onentially weigh ted moving av erage of the S t , where Z t = λS t + (1 − λ ) Z t − 1 , Z 0 = b µ is a common c hoice for the starting v alue of the moving av erage and λ (0 < λ ≤ 1) is a smo othing constan t. Through empiral inv estigation Cro wder ( 1989 ) provides guidance on the c hoice of λ that optimizes the p erformance of the EWMA control chart. Montgomery ( 2013 ) suggests that v alues of λ in the interv al 0 . 05 ≤ λ ≤ 0 . 25 work well in practice with λ = 0 . 2 b eing a p opular choice. The control limits of the EWMA control chart are given by b µ ± 3 b σ s λ (2 − λ ) [1 − (1 − λ ) 2 t ] . Note that as t increases, i.e., as the num ber of Phase I I observ ations increases, these control limits approac h the steady-state v alues given by b µ ± 3 b σ s λ (2 − λ ) . (9) If Z t lies outside these control limits, it signals that a small and p ersisten t c hange has o ccurred. Because the curren t observ ation S t is de-emphasized in this moving av erage, the EWMA con trol c hart will not signal sudden large changes as quic kly as a Shewhart control chart. Thus the nature of change one wishes to detect should dictate which con trol chart is used. In practice, it is sensible to simultaneously monitor S t using b oth approaches. W e explore the utility of b oth the Shewhart and EWMA control charts when applied to the U.S. Senate co-v oting netw ork in Section 6 and we use sim ulation to inv estigate the detection prop erties of the Shewhart con trol c hart in Section 7 . 6. Application to the U .S. Senate V oting Network W e no w use the DCSBM surv eillance procedure to in v estigate the dynamic relationship b et w een Republican and Demo crat Senators in the U.S. Congress. W e analyzed the co-voting net w ork of the U.S. Senate from 1867 (Congress 40) to 2015 (Congress 113). This net w ork was first analyzed in Mo o dy and Muc ha ( 2013 ) and has b een since inv estigated in Ro y et al. ( 2014 ). In Mo o dy and Muc ha ( 2013 ) the mo dularit y , or extent of divisiveness, of the netw ork was calculated ov er time, and it was found that generally Republicans and Demo crats hav e become more p olarized ov er time. The dynamic DCSBM framework provides a means to formally mo del this net w ork and test for c hanges in the communit y structure and voting patterns among part y members. 12 James D . Wilson et al. 6.1. Description of Data W e generated a dynamic net w ork to mo del the co-voting patterns among U.S. Senators in the follo wing manner. W e first collected the roll call voting data for eac h Congress from http: //voteview.com . This data set con tains the voting decision (either ya y , nay , or abstain) of each Senator for ev ery bill submitted to the Senate. F or each Congress, we mo del the Senators in that Congress as the collection of no des. Binary edges are placed b et w een t w o Senators if they vote concurren tly (either b oth y a y or b oth nay) for at least 75% of the total num b er of bills on whic h either of them v oted. Three of the net w orks that we analyze are shown in Figure 2 . This figure illustrates the tendency of the Senators to vote according to his or her own party affiliation. W e summarize the n umber of Senators, n umber of bills, and the total n umber of edges in eac h Congress in Figure 3 . Fig. 2. An illustration of the 40th, 70th, and 100th Senate networks in the U .S . Senate voting network. Each network was drawn using the F ruchter man Reingold lay out. Nodes are colored according to political affiliation, where red represents Republican and b lue represents Democratic affiliation. Fig. 3. Features of the dynamic U .S. Senate v oting network. 6.2. Results T o analyze p olitical p olarization, we applied the DCSBM surveillance strategy with Shewhart and EWMA con trol charts to this dynamic netw ork. Since no de lab els across graphs are not registered, i.e., no des do not represent the same Senators across time, estimating the comm unit y lab els using the sp ectral clustering strategy mentioned in Section 5.1.1 is not appropriate. As we are in terested in understanding p olitical p olarization, w e instead set the communit y lab els at time t according to the p olitical affiliation of eac h Senator (1 for Demo crat and 2 for Republican). W e Detecting Change in T emporal Networks with the DCSBM 13 set the Phase I size to b e m = 25 and compute the Shewhart and EWMA control charts for the estimators { b P q ,r , s q : q , r = 1 , 2 } . F or the EWMA c hart, w e calculated the con trol limits in ( 9 ) and set λ = 0 . 2. Estimation of the DCSBM and surveillance to ok appro ximately tw o minutes to run on this data set using R soft w are on a laptop with a 2.6 GHz Intel Core i5 pro cessor. The Shewhart and EWMA control charts are shown in Figure 4 . The con trol c harts in Figure 4 reveal three interesting and relev ant features about the U.S. Senate v oting patterns. First, b oth the Shewhart and EWMA con trol charts signal lar ge v alues of b P 1 , 2 from Congress 91 (1969 - 1971) to Congress 94 (1975 - 1977). This finding suggests that Republicans and Demo crats tended to v ote concurren tly more often than exp ected during this p eriod of time. F urthermore, the EWMA control chart signals large v alues of s 1 during this time p eriod. This suggests that the voting prop ensity of the Demo cratic party during this time is significan tly more v ariable than exp ected. Interestingly , this time frame lies at the second half of the so-called “Ro c k efeller Republican” era, which lasted from 1960 to 1980. During this era, man y Republican Senators had mo derate views that reflected the ideals of the go vernor of New Y ork, Nelson Ro ck efeller ( Rae , 1989 ; Smith , 2014 ). The Ro c k efeller Republicans w ere strong supp orters of the civil rights mov emen t, including the Civil Rights Act of 1968, and held esp ecially mo derate fiscal views under the Presidency of Ric hard Nixon (93rd Congress). Notably , this general cohesion among parties - marked by large v alues of b P 1 , 2 in the con trol c harts - ended in Congress 94. This Congress coincides with the end of Nelson Ro ck efeller’s role as Vice President of the United States in 1977. T o the b est of our kno wledge, this is the first work to identify this p olitical era using Senatorial co-v oting data. Next, the EWMA control c harts for b P 1 , 1 and b P 2 , 2 signal lar ge v alues at Congress 104. This sug- gests that the in tra-part y co-voting prop ensities for b oth the Demo cratic and Republican parties b ecame exceedingly large at that time. This finding supp orts the theory of recent p olarization of the parties at the b eginning of Bill Clinton’s first term as President (Congress 103). According to Mo o dy and Mucha ( 2013 ), this time p erio d marked an imp ortant transition at which conser- v ative Demo crats and lib eral Republicans joined ma jority-part y coalitions in b oth Congress 103 (Demo cratic ma jority) and Congress 104 (Republican ma jority). This transition left the middle ground b et w een parties empt y , which ma y ha v e lead to an enduring p olarization. These results also coincide with the findings of Ro y et al. ( 2014 ). The Shewhart con trol chart did not as clearly signal this c hange; ho w ev er, in eac h of the c harts there is an increasing trend beginning in Congress 100. W e note that the Shewhart lo w er con trol limit for b P 1 , 1 , b P 1 , 2 , and b P 2 , 2 is less than zero. This indicates that the v ariabilit y of these v alues in Phase I was to o large to construct tigh t control limits. As Shewhart c harts are b etter suited for large sudden changes, it is exp ected that these c harts will identify this p olarization c hange later than the EWMA c hart, as sho wn. Finally , we see from the EWMA con trol c harts for s 1 and s 2 signals a significan tly small v alue of these statistics at Congress 105. This suggests that the v ariabilit y of total interaction of the Senators steadily and significantly reduced during this p erio d. This finding complements the p olarization theory describ ed ab ov e, and suggests that since Congress 105, eac h U.S. Senator tends to vote according to his or her part y , regardless of the bill. 14 James D . Wilson et al. Shewhart Control Charts 0.0 0.4 0.8 P ^ 1 1 Congress Democrat - Democrat 40 50 60 70 80 90 100 110 -0.02 0.02 0.06 P ^ 1 2 Congress Republican - Democrat 40 50 60 70 80 90 100 110 0.0 0.4 0.8 P ^ 2 2 Congress Republican - Republican 40 50 60 70 80 90 100 110 0.0 0.4 0.8 δ ^ 1 Congress Value 40 50 60 70 80 90 100 110 0.0 0.5 1.0 1.5 2.0 δ ^ 2 Congress Value 40 50 60 70 80 90 100 110 s s EWMA Control Charts 0.2 0.4 0.6 0.8 P ^ 1 1 Congress Democrat - Democrat 40 50 60 70 80 90 100 110 -0.01 0.01 0.03 P ^ 1 2 Congress Republican - Democrat 40 50 60 70 80 90 100 110 0.2 0.4 0.6 P ^ 2 2 Congress Republican - Republican 40 50 60 70 80 90 100 110 0.2 0.4 0.6 0.8 δ ^ 1 Congress Value 40 50 60 70 80 90 100 110 0.4 0.8 1.2 δ ^ 2 Congress Value 40 50 60 70 80 90 100 110 s s Fig. 4. Shewhar t (top) and EWMA (bottom) control char ts f or each of the DCSBM statistics for the dynamic voting networ k of the U .S . Senate, when using a Phase I size of 25. The red dashed lines represent the upper and lower control limits for the Shewhart chart. Blue dots represent Congresses for which Democrats held a majority in Senate. These control char ts illustrate a recent schism among Republican and Democr atic v oting patter ns in the Senate as well as an era of political cohesion during the ”Roc k ef eller Republican” er a. Detecting Change in T emporal Networks with the DCSBM 15 T able 1. A description of the changes introduced to the dynamic DCSBMs in our simulation study . Sim ulation Change Description 1 P ∗ 1 , 1 = P 1 , 1 + local outbreak in communit y 1 2 P ∗ i,j = P i,j + global outbreak ( i = 1 , 2, j = 1 , 2) 3 δ ∗ 1 = δ 1 + τ lo cal v ariabilit y increase in communit y 1 4 δ ∗ i = δ i + τ global v ariability increase ( i = 1 , 2) 5 c → c ∗ merge comm unities 6 c → c ∗ split comm unit y 1 into 2 communities 7. Simulation Study In this section, w e inv estigate the detection of structural changes in a netw ork b G ( n, T ) = { b G 1 , . . . , b G T } generated under a dynamic DCSBM. W e consider lo cal and global changes in the net w ork as parameterized b y changes in P → P ∗ , δ → δ ∗ , and c → c ∗ at time t ∗ . Note that w e assume the communit y lab els c are known and so we do not surv eil the maxim um likelihoo d estimates b π . Because these lo cal and global c hanges are large and in tro duced suddenly , w e use Shewhart con trol charts as the monitoring strategy . In Section 7.1 w e ev aluate this monitoring strategy on a collection of illustrative examples to gain an in tuition of the DCSBM and the p erformance of the prop osed metho dology . In Section 7.2 w e quantify the strengths and weaknesses of our metho d using an analysis of aver age run lengths under a v ariety of sim ulated conditions. T o ev aluate the p erformance of our detection strategy , w e altered the netw ork size and the magnitude of the c hange b eing introduced. T his sim ulation strategy can b e readily used to assess the p erformance of an y netw ork surveillance metho d. 7.1. Illustrativ e Examples W e b egin our sim ulation study by demonstrating the Shewhart con trol charts on a collection of six dynamic net works, eac h of whic h reflects a differen t structural c hange at time t ∗ . W e in vestigate c hanges in the mean and v ariance of in teraction rate, b oth locally and globally , as w ell as c hanges in comm unit y s tructure. F or each simulation, we generated a dynamic net w ork according to ( 5 ) with n = 50 no des, k = 2 equally sized comm unities, T = 50 time p oin ts, and a c hange implemented at time t ∗ = 30. W e use the first m = 25 sim ulated netw orks for Phase I, and implemented the Shewhart c on trol chart for the statistics { b P q ,r , s q : q , r = 1 , 2 } using the surveillance strategy describ ed in Section 5.2 . In all six sim ulations, we set P = 0 . 2 0 . 1 0 . 1 0 . 2 , δ r ≡ 0 . 5 for r = 1 , 2 . Con trol charts are sho wn for each simulation in Figures 5 , 6 , and 7 . Belo w, w e describ e the six sim ulated net w orks and the results of our monitoring plan. T o conserve space we do not present c harts for s 2 , and instead describ e them qualitatively where appropriate. The implemen ted c hanges for eac h simulation are describ ed in T able 1. Sim ulations 1 - 2: Mean Interaction Rate Changes In the first t w o simulations, w e monitor changes in the mean in teraction rates in the netw ork. In simulation 1, we introduce a lo cal mean in teraction outbreak in communit y 1 by setting P ∗ 1 , 1 = P 1 , 1 + with = 0 . 10. The top of Figure 5 reveals that the control chart for b P 1 , 1 efficien tly signals a change at time 30; whereas, all other statistics remain in con trol ov er the entire time interv al. In simulation 2, w e introduce a global mean interaction outbreak by increasing all entries of P by = 0 . 10. In this case, the probability estimates b P 1 , 1 , b P 1 , 2 and b P 2 , 2 all lead to a signal for a change at time 30, and s 1 and s 2 remain in control, though the chart for s 2 is not shown here. W e note that b P 1 , 2 app ears to signal the most dramatic change. This is due to the fact that the signal to noise ratio introduced b y increasing the o v erall interaction rate in the netw ork is highest for the in ter comm unit y interactions. 16 James D . Wilson et al. Sim ulation 1 0.2 0.4 0.6 δ ^ 1 Time Value 0 5 10 20 30 40 50 0.10 0.25 0.40 P ^ 1 1 Time Value 0 5 10 20 30 40 50 0.06 0.12 P ^ 1 2 Time Value 0 5 10 20 30 40 50 0.05 0.20 0.35 P ^ 2 2 Time Value 0 5 10 20 30 40 50 s" Sim ulation 2 0.30 0.45 0.60 δ ^ 1 Time Value 0 5 10 15 20 25 30 35 40 45 50 0.10 0.25 0.40 P ^ 1 1 Time Value 0 5 10 15 20 25 30 35 40 45 50 0.05 0.20 0.35 P ^ 1 2 Time Value 0 5 10 15 20 25 30 35 40 45 50 0.15 0.30 P ^ 2 2 Time Value 0 5 10 15 20 25 30 35 40 45 50 s Fig. 5. Shewhar t control char ts for the dynamic networks generated for simulations 1 and 2 estimated using the first 25 networks. Detecting Change in T emporal Networks with the DCSBM 17 Sim ulations 3 - 4: V ariance of Interaction Rate Changes Next we monitor changes in the v ariation of the interaction rate in the simulated netw ork. In sim ulation 3 we increase δ 1 b y τ = 0 . 25, which results in a change in the v ariability of interaction in comm unit y 1. The top of Figure 6 reveals that this c hange is indeed signalled b y the s 1 c hart near t = 30. W e exp ect the reaction of the chart, and hence the signal dela y , to dep end on the magnitude of change. W e in v estigate this further in the next section. In simulation 4 w e simulated a global change in δ = ( δ 1 , δ 2 ), which increases the v ariability of in teractions among all nodes. In this case δ 1 and δ 2 are b oth increased b y τ = 0 . 25. The b ottom of Figure 6 reveals that s 1 signals the c hange almost immediately . Although not shown here, the con trol chart for s 2 b eha v es similarly . Imp ortan tly , the connection probabilit y estimates remain in control in these simulations suggesting, as desired, that the mean in teraction rate in the netw ork do es not c hange. Sim ulations 5 - 6: Change in Communit y Structure In simulations 5 and 6, w e consider t w o common c hanges in comm unit y structure: merging and splitting of comm unities. In sim ulation 5, w e sim ulate net works with t wo equally sized comm unities up to time t ∗ = 30. A t time t ∗ , w e then merge the t w o comm unities in to one and set the connection v alue to the av erage of the former connection probabilities, that is P ∗ = 0 . 15. Structurally , this c hange results in an increase of b P 1 , 2 b y 0.05 and a decrease in b P 1 , 1 and b P 2 , 2 b y 0.05. Our con trol c harts from Figure 7 detect this trend, and we see that the change is appropriately detected using b P 1 , 2 . Although we witness a decrease in b P 1 , 1 and b P 2 , 2 , the con trol chart do es not signal a change immediately . Because this c hange is relativ ely small, it w ould be better detected b y EWMA con trol c harts for b P 1 , 1 and b P 2 , 2 . In sim ulation 6, w e once again b egin with t w o equally sized comm unities. At time t ∗ = 30, we split communit y 1 into tw o communities of size 12 and 13, resp ectiv ely . F or the three communities after time t ∗ , we fix P i,i = 0 . 20 and P i,j = 0 . 10 as before. Structurally such a change will b e reflected b y an ov erall decrease in b P 1 , 1 . W e see this trend in the chart in the b ottom of Figure 7 ; how ever, the c hange was not identified until time t = 42, where b P 1 , 1 w en t b elo w the con trol limits. W e exp ect that this type of c hange will be more readily detected in larger net w orks and in net w orks where the split communit y is large. W e inv estigate this further in the next section. 7.2. A v erage Run Length Analysis F or each scenario describ ed in T able 1, w e ev aluated our monitoring metho dology b y sim ulating the situation 1000 times. On each of these 1000 simulated runs, we calculated the num ber of net w orks until the control c hart detects a c hange, i.e., the run length, and we then estimate the a v erage run length (ARL) from these 1000 sim ulations. Because µ and σ are estimated from Phase I, there will be practitioner-to-practioner sampling differences in observ ed ARL v alues, which is the basis for an ARL distribution. Thus the av erage run lengths w e rep ort are estimates of the mean of this distribution, which we refer to as the av erage ARL (AARL) as in Saleh et al. ( 2015 ). This AARL is the basis up on which different surveillance metho ds can b e compared. In what follo ws, w e describe the p erformance of the surveillance technique discussed in the previous t w o sections. In eac h of the scenerios discussed b elo w w e assume the same initial form of P and δ as discussed in the previous section, with n = 100 no des in eac h net w ork. W e in v estigated the p erformance of the metho d with m = 25, m = 50 and m = 1000 Phase I samples. In all cases w e implemented the appropriate change at time t ∗ = 25 in Phase I I and there after generated as many netw orks required to observ e the first signal on each con trol chart. Here w e inv estigate the p erformance of con trol c harts for b P 1 , 1 , b P 1 , 2 , b P 2 , 2 , and s which is a p o oled estimate of the standard deviation of b θ based on s 1 and s 2 since w e assume δ 1 = δ 2 in Phase I. W e found comparable p erformance of our surveillance tec hnique under Phase I sizes of m = 25 , m = 50 and m = 1000. How ev er, as Saleh et al. ( 2015 ) indicate, it is unwise to guaran tee specific ARL v alues when the con trol chart parameters are estimated from small sample sizes. As suc h, w e presen t the results of the m = 1000 case here, and pro vide the results for the m = 25 and m = 50 cases in the App endix. Note that when m = 1000, w e gain insigh t into the p erformance of the metho dology under fav orable conditions (i.e., when information ab out each statistic’s distribution is ample). 18 James D . Wilson et al. Sim ulation 3 0.3 0.5 0.7 δ ^ 1 Time Value 0 5 10 15 20 25 30 35 40 45 50 0.10 0.20 0.30 P ^ 1 1 Time Value 0 5 10 15 20 25 30 35 40 45 50 0.04 0.10 0.16 P ^ 1 2 Time Value 0 5 10 15 20 25 30 35 40 45 50 0.10 0.25 P ^ 2 2 Time Value 0 5 10 15 20 25 30 35 40 45 50 s Sim ulation 4 0.2 0.4 0.6 δ ^ 1 Time Value 0 5 10 15 20 25 30 35 40 45 50 0.10 0.25 P ^ 1 1 Time Value 0 5 10 15 20 25 30 35 40 45 50 0.04 0.10 0.16 P ^ 1 2 Time Value 0 5 10 15 20 25 30 35 40 45 50 0.10 0.25 P ^ 2 2 Time Value 0 5 10 15 20 25 30 35 40 45 50 s Fig. 6. Shewhar t control char ts for the dynamic networks generated for simulations 3 and 4 estimated using the first 25 networks. Detecting Change in T emporal Networks with the DCSBM 19 Sim ulation 5 0.3 0.5 δ ^ 1 Time Value 0 5 10 15 20 25 30 35 40 45 50 0.10 0.20 0.30 P ^ 1 1 Time Value 0 5 10 15 20 25 30 35 40 45 50 0.05 0.15 P ^ 1 2 Time Value 0 5 10 15 20 25 30 35 40 45 50 0.10 0.20 0.30 P ^ 2 2 Time Value 0 5 10 15 20 25 30 35 40 45 50 s Sim ulation 6 0.3 0.5 δ ^ 1 Time Value 0 5 10 15 20 25 30 35 40 45 50 0.10 0.20 P ^ 1 1 Time Value 0 5 10 15 20 25 30 35 40 45 50 0.06 0.12 P ^ 1 2 Time Value 0 5 10 15 20 25 30 35 40 45 50 0.05 0.20 P ^ 2 2 Time Value 0 5 10 15 20 25 30 35 40 45 50 s Fig. 7. Shewhar t control char ts for the dynamic networks generated for simulations 5 and 6 estimated using the first 25 networks. 20 James D . Wilson et al. Sim ulation 0: No Change W e begin by considering the performance of the metho dology when no structural change has o ccurred. Doing so allows us to quanitify the prev alence of false alarms , i.e., when the con trol c hart incorrectly indicates a change has o ccurred. The AARLs asso ciated with the contr ol charts for s , b P 1 , 1 , b P 1 , 2 , and b P 2 , 2 are sho wn in T able 2 . Although there will be v ariation in in-con trol ARLs, the large AARL v alues shown in the Simulation 0 row are reassuring; they indicate that false alarms are not exp ected to o ccur un til hundreds of “in-control” net w orks ha v e b een observed. When structural changes ha v e o ccurred, w e exp ect m uc h smaller AARLs to b e asso ciated with at least one of the four control c harts. W e discuss these scenarios below. Sim ulations 1 - 2: Mean Interaction Rate Changes W e quan tify the metho d’s abilit y to detect lo c al changes in P , sp ecifically in comm unit y 1, b y adding = 0 . 01 , 0 . 05 , 0 . 10 to P 1 , 1 . As mentioned previously , such a change is expected to be detected on the b P 1 , 1 con trol c hart. The Sim ulation 1 AARLs in the b P 1 , 1 column of T able 2 indicate that this is indeed the case; on a v erage we exp ect the b P 1 , 1 con trol c hart to detect such a c hange in roughly ten netw orks for mo derate sized c hanges in P 1 , 1 , and roughly t wo net w orks for large c hanges. On the other hand, the large AARL v alues for the other three statistics indicate that none of them is likely to detect this c hange, as desired. W e similarly quan tify the metho d’s ability to detect glob al changes in P by adding = 0 . 01 , 0 . 05 , 0 . 10 to eac h P i,j . In this situation, w e exp ect all en tries of b P to signal a c hange. The Sim ulation 2 AARLs in the b P 1 , 1 , b P 1 , 2 , and b P 2 , 2 columns of T able 2 supp ort this h yp othesis. As exp ected, w e see that the b P 1 , 2 con trol c hart signals this c hange fastest since is m uc h larger relativ e to P 1 , 2 than it is to P 1 , 1 and P 2 , 2 . Sim ulations 3 - 4: V ariance of Interaction Rate Changes W e introduced lo c al c hanges in interaction v ariabilit y among the no des in communit y 1 by adding τ = 0 . 05 , 0 . 10 , 0 . 25 to δ 1 , and w e introduce glob al c hanges in interaction v ariability among all nodes in the netw ork b y adding τ = 0 . 05 , 0 . 10 , 0 . 25 to eac h δ j , j = 1 , 2. In b oth cases, we exp ect the s con trol chart to signal this c hange. The AARLs in the Simulation 3 and Sim ulation 4 ro ws of T able 2 supp ort this claim. In particular, w e can exp ect this control chart to detect global c hanges more quickly than local changes, and in both cases large changes will b e detected more quic kly than small changes. Sim ulations 5 - 6: Change in Communit y Structure As discussed in the previous section, Simulation 5 corresp onds to the merging of comm unities. Since P 1 , 2 is most affected by this change, w e exp ect the b P 1 , 2 con trol c hart to signal quick est. The AARLs in the “Simulation 5” row of T able 2 agree with this intuition; while, b P 1 , 1 and b P 2 , 2 tend to detect this change more quic kly than s , the b P 1 , 2 c hart detects the change almost immediately . In terestingly , this result do es not app ear to dep end on the size of the netw ork. When communit y j is split in to t w o (equally sized) comm unities, the illustrativ e example in Section 7.1 suggests that a control c hart for b P j,j should signal most quickly . The results in the Sim ulation 6 ro w of T able 2 substan tiate this; when comm unit y 1 is split in to t w o comm unities, the con trol for b P 1 , 1 detects this more quickly than the other control charts, but p erhaps not as quic kly as a practitioner would like. This suggests that the prop osed surv eillance metho dology may not b e ideal for detecting comm unit y splitting, even though it is high y effective at detecting each of the other types of structural change considered. 8. Discussion In this pap er w e hav e illustrated the utility of the dynamic degree corrected stochastic blo c k mo del (DCSBM) in mo deling and simulating realistic dynamic netw orks with lo cal and global structural c hanges. Our proposed mo del is flexible, and can capture b oth degree heterogeneity and comm unit y structure in netw orks, t w o imp ortan t features that are common in so cial and biological net w orks. W e prop osed a fast and effective monitoring methodology based on the surv eillance Detecting Change in T emporal Networks with the DCSBM 21 T able 2. Av erage ARLs for Sim ulations in Section 7.2 when m = 1000 . Sim ulation Change s b P 1 , 1 b P 1 , 2 b P 2 , 2 0 none 317.18 439.25 446.50 338.25 = 0 . 01 294.80 134.00 413.70 332.4 1 P ∗ 1 , 1 = P 1 , 1 + = 0 . 05 284.90 9.87 257.27 207.70 = 0 . 10 524.40 2.23 289.90 325.90 = 0 . 01 498.80 140.90 64.65 142.30 2 P ∗ i,j = P i,j + = 0 . 05 211.10 9.48 1.71 12.17 = 0 . 10 93.30 2.01 1.01 2.28 τ = 0 . 05 106.51 221.40 260.10 202.70 3 δ ∗ 1 = δ 1 + τ τ = 0 . 10 115.70 152.33 305.29 544.60 τ = 0 . 25 18.81 63.35 107.20 431.00 τ = 0 . 05 93.58 232.30 246.10 216.10 4 δ ∗ i = δ i + τ τ = 0 . 10 36.33 142.00 185.94 218.50 τ = 0 . 25 4.94 52.88 92.23 53.87 n = 50 327.60 74.97 1.64 40.81 5 Merge comm. n = 100 247.00 39.79 1.66 27.61 n = 500 72.70 37.56 1.61 37.32 n = 50 152.10 32.88 168.30 427.80 6 Split comm. n = 100 127.50 33.90 313.39 426.20 n = 500 72.70 33.37 315.50 446.50 of maxim um lik eliho od estimates from the DCSBM using Shewhart and EWMA control charts for individuals. When applying our method to the U.S. Senate co-voting netw ork, w e were able to iden tify relev ant and significan t changes in the bipartisan nature of the U.S. Congress. Our analysis reveals that the dynamic DCSBM can effectively mo del a v ariety of dynamic net w orks with structural c hanges, and that our prop osed surveillance strategy can detect relev ant changes in a real dynamic system. Our prop osed monitoring strategy establishes one practically useful tec hnique among a general family of metho ds for surv eillance. Our framework relies on tw o comp onen ts: a parametric dynamic random graph mo del for mo deling the features of the graph, and a control chart from statistical pro cess monitoring for the detection of c hanges in the parameters. W e considered a dynamic DCSBM random graph mo del and the Shewhart and EWMA control charts for surveillance. This serv es only as a first step in understanding the utilit y of our proposed surveillance strategy . In future work, it would b e useful to explore the use of other parametric random graph mo dels and con trol charts and to assess the adv antages and disadv antages of each strategy . In particular, future w ork will explore the utility of dynamic laten t space mo dels like that discussed in Sew ell and Chen ( 2015 ) as well as dynamic exp onen tial random graph mo dels like the TERGM family describ ed in Hanneke et al. ( 2010 ). Our curren t surveillance framework requires the surveillance of on the order of k 2 statistics, where k is the n um ber of comm unities in the netw ork. If the n um ber of comm unities is large, e.g., if k = O ( n ), our prop osed surveillance strategy will b ecome cumbersome and ma y suffer from m ultiple testing issues. F or this reason, an imp ortan t next step is to develop a surveillance metho dology that is not limited b y the num b er of no des or communities in the netw ork. F or example, one could develop a formal lik eliho od ratio test for the DCSBM from one time p oint to the next. A t every time p oint in Phase I I, the lik eliho od ratio test statistic could b e plotted on a control chart whose control limits are based on the exact or an approximate distribution of the statistic. The dev elopmen t of a lik elihoo d ratio test for this net w ork mo del is an imp ortan t, but difficult, problem. Y an et al. ( 2014 ) provides some in tuition for how to pro ceed here, but more w ork needs to b e done. Finally , the ma jority of con temp orary surv eillance metho dologies are based on the assump- tion that the observ ed dynamic graph is unw eighted. As a consequence, mo del-based approaches generally mo del the existence of an edge as a Bernoulli random v ariable and often rely on some thresholding technique to binarize coun t data. The DCSBM flexibly mo dels the edge weigh t as- so ciated with each edge using a Poisson random v ariable. Thus, one can utilize the DCSBM to 22 James D . Wilson et al. in v estigate and quan tify the loss of information when coun t data is thresholded to binary outcomes. Appendix Appendix A: Relationship of DCSBM with other Random Graph Models The DCSBM generalizes sev eral families of w ell-studied and widely-applied random graph mod- els. F or the conv enience of the reader, w e describe three important families of random graph mo dels and their relationship with the DCSBM b elo w. The analysis of random graphs has a rich history , and a v ariety of mo dels ha v e b een developed and used in a wide range of applications. Golden b erg et al. ( 2010 ) and Fien b erg ( 2012 ) pro vide tw o recen t surv eys of random graph mo dels, and Durrett ( 2007 ) provides a b o ok level treatmen t of the topic. W e refer the reader to these references and those men tioned b elow for more details about random graph theory and its application. • Sto chastic blo c k mo del : When θ u ≡ 1 for all u ∈ [ n ] and P r,s ∈ (0 , 1) for all r , s ∈ [ k ], the degree corrected s tochastic blo ck mo del reduces to the (non-degree corrected) sto c hastic blo c k mo del from Holland et al. ( 1983 ); Snijders and Nowic ki ( 1997 ); Nowic ki and Snijders ( 2001 ). In this special case connection probabilities are fully described b y the k × k probability matrix P . In this random graph, vertices in the same communit y are treated as sto chastic al ly e quivalent in the sense that vertices of the same communit y hav e the same degree prop ensity . • Erd˝ os-R´ enyi ( p ) : Supp ose that θ u ≡ 1 and that P r,s ≡ p ∈ (0 , 1) for all r , s ∈ [ k ]. Then the DCSBM reduces to the Erd˝ os-R ´ enyi random graph mo del with probabilit y parameter p ( Erd¨ os and R´ enyi , 1960 ). The Erd˝ os-R ´ enyi random graph mo del treats edges as indep enden t and iden tically distributed random v ariables with connection probability p . As a result, the mo del do es not distinguish vertices of differen t communities. The Erd˝ os-R´ en yi random graph is often used as a n ull mo del to whic h significant netw ork features can b e detected through comparison. F or example, the Erd˝ os-R ´ en yi random graph pla ys an imp ortant role in comm unit y detection b oth as a means to iden tify comm unities ( Newman , 2006 ), and as a means to analyze the theoretical prop erties of communit y detection algorithms ( Bick el et al. , 2011 ). • Chung-Lu model : An imp ortan t family of random graph mo dels is the family of fixed degree random graphs. These mo dels are used to c haracterize the degree heterogeneity of an observ ed graph with degree sequence d = { d (1) , . . . , d ( n ) } . A fixed degree random graph is a probabilit y measure on the family of undirected graphs that ha v e degree sequence d . Imp ortan t examples of fixed degree random graphs include the configuration mo del ( Bender and Canfield , 1978 ; Bollob´ as , 1979 ; Molloy and Reed , 1995 ), the β -mo del ( Chatterjee et al. , 2011 ), and the Ch ung-Lu model ( Aiello et al. , 2000 ). As a sp ecial case, w e consider the Chung- Lu fixed degree model with degree sequence d . F or k = 1, when θ u = d ( u ) / q P w ∈ [ n ] d ( w ), and P 1 , 1 = 1, then the resulting exp ected edge w eigh t b etw een no des u, v ∈ [ n ] is given by: E [ w u,v ] = d ( u ) d ( v ) P w ∈ [ n ] d ( w ) . This is precisely the exp ected edge w eigh ts asso ciated with the Chung-Lu random graph mo del. The Ch ung-Lu mo del is often used as a null random graph mo del against which the features of an observed netw ork is compared. F or example, this model is often used for the detection and ev aluation of communit y structure in netw orks ( Newman , 2006 ; Wilson et al. , 2013 , 2014 ). Appendix B: Additional Results f or Simulation study W e provide the av erage ARL for the simulations conducted in Section 7.2 for Phase I size m = 25 and m = 50 in T ables 3 and 4 , resp ectiv ely . Detecting Change in T emporal Networks with the DCSBM 23 T able 3. A v erage ARLs f or Simulations in Section 7.2 when m = 25 . Sim ulation Change s b P 1 , 1 b P 1 , 2 b P 2 , 2 0 none 425.50 507.53 512.40 534.40 = 0 . 01 474.20 299.50 487.64 506.20 1 P ∗ 1 , 1 = P 1 , 1 + = 0 . 05 613.67 19.75 494.40 482.20 = 0 . 10 649.00 2.67 474.52 474.80 = 0 . 01 587.50 280.60 149.50 297.00 2 P ∗ i,j = P i,j + = 0 . 05 555.70 18.44 1.98 17.84 = 0 . 10 350.60 2.61 1.01 2.66 τ = 0 . 05 366.70 383.30 482.40 490.17 3 δ ∗ 1 = δ 1 + τ τ = 0 . 10 193.70 299.80 419.50 481.90 τ = 0 . 25 35.80 118.90 306.00 509.40 τ = 0 . 05 229.90 380.00 480.70 382.80 4 δ ∗ i = δ i + τ τ = 0 . 10 107.90 312.90 342.00 288.50 τ = 0 . 25 6.98 132.90 188.50 108.00 n = 50 451.90 288.30 1.90 271.30 5 Merge comm. n = 100 452.30 268.30 1.84 269.10 n = 500 443.60 283.00 1.91 247.70 n = 50 226.00 224.00 497.20 509.85 6 Split comm. n = 100 247.50 275.00 506.50 487.00 n = 500 220.60 269.30 551.40 480.80 T able 4. A v erage ARLs f or Simulations in Section 7.2 when m = 50 . Sim ulation Change s b P 1 , 1 b P 1 , 2 b P 2 , 2 0 none 398.10 408.99 436.10 429.50 = 0 . 01 432.20 210.80 456.20 434.10 1 P ∗ 1 , 1 = P 1 , 1 + = 0 . 05 577.83 12.27 443.30 473.50 = 0 . 10 604.00 2.36 435.99 424.50 = 0 . 01 551.90 204.70 81.72 213.80 2 P ∗ i,j = P i,j + = 0 . 05 497.10 12.30 1.78 12.77 = 0 . 10 217.10 2.34 1.01 2.34 τ = 0 . 05 261.40 294.10 378.20 410.48 3 δ ∗ i = δ i + τ τ = 0 . 10 136.68 225.10 359.90 427.50 τ = 0 . 25 26.05 80.83 250.40 460.80 τ = 0 . 05 172.20 303.29 361.90 328.50 4 δ ∗ = δ + τ τ = 0 . 10 58.94 232.80 290.20 319.00 τ = 0 . 25 5.68 90.87 139.40 88.58 n = 50 414.46 177.90 1.80 155.60 5 Merge comm. n = 100 366.99 171.90 1.88 169.50 n = 500 386.70 142.90 1.83 162.60 n = 50 172.10 165.10 472.40 457.50 6 Split comm. n = 100 163.90 145.00 480.90 436.02 n = 500 169.50 165.30 428.15 424.00 24 James D . Wilson et al. References Aiello, W., F. Chung, and L. Lu (2000). A random graph mo del for massive graphs. In Pr o c e e dings of the thirty-se c ond annual ACM symp osium on The ory of c omputing , pp. 171–180. A CM. Airoldi, E. M., D. M. Blei, S. E. Fien b erg, and E. P . Xing (2009). Mixed membership sto chastic blo c kmodels. In A dvanc es in Neur al Information Pr o c essing Systems , pp. 33–40. Ak oglu, L. and C. F aloutsos (2013). Anomaly , even t, and fraud detection in large net work datasets. In Pr o c e e dings of the sixth ACM international c onfer enc e on Web se ar ch and data mining , pp. 773–774. A CM. Azarnoush, B., K. Pa ynabar, J. Bekki, and G. Runger (2016). Monitoring temp oral homogeneity in attributed netw ork streams. Journal of Quality T e chnolo gy 48 (1), 28–43. Barab´ asi, A.-L. and R. Alb ert (1999). Emergence of scaling in random net w orks. Sci- enc e 286 (5439), 509–512. Barnett, I. and J.-P . Onnela (2016). Change p oint detection in correlation net w orks. Scientific r ep orts 6 . Bender, E. A. and E. R. Canfield (1978). The asymptotic num ber of lab eled graphs with given degree sequences. Journal of Combinatorial The ory, Series A 24 (3), 296–307. Bic k el, P . J., A. Chen, and E. Levina (2011). The metho d of moments and degree distributions for net w ork mo dels. The A nnals of Statistics 39 (5), 2280–2301. Bindu, P . and P . S. Thilagam (2016). Mining so cial netw orks for anomalies: Metho ds and c hal- lenges. Journal of Network and Computer Applic ations 68 , 213–229. Bollob´ as, B. (1979). A pr ob abilistic pr o of of an asymptotic formula for the numb er of lab el le d r e gular gr aphs . Aarhus Universitet. Chatterjee, S., P . Diaconis, and A. Sly (2011). Random graphs with a given degree sequence. The A nnals of Applie d Pr ob ability 21 (4), 1400–1435. Chau, D. H., S. Pandit, and C. F aloutsos (2006). Detecting fraudulen t p ersonalities in netw orks of online auctioneers. In Know le dge Disc overy in Datab ases: PKDD 2006 , pp. 103–114. Springer. Chen, Z., W. Hendrix, and N. F. Samatov a (2012). Comm unity-based anomaly detection in evo- lutionary net w orks. Journal of Intel ligent Information Systems 39 (1), 59–85. Clauset, A., C. R. Shalizi, and M. E. Newman (2009). Po wer-la w distributions in empirical data. SIAM R eview 51 (4), 661–703. Cro wder, S. V. (1989). Design of exp onentially w eighted mo ving a v erage sc hemes. Journal of Quality T e chnolo gy 21 (3), 155–162. Durrett, R. (2007). R andom gr aph dynamics . Cambridge Universit y Press. Erd¨ os, P . and A. R ´ enyi (1960). On the ev olution of random graphs. Public ations of the Mathe- matic al Institute of Hungarian A c ademy of Scienc es 5 , 17–61. Fien b erg, S. E. (2012). A brief history of statistical mo dels for net work analysis and open c hallenges. Journal of Computational and Gr aphic al Statistics 21 (4), 825–839. Fire, M., G. Katz, and Y. Elo vici (2012). Strangers in trusion detection - detecting spammers and fak e profiles in so cial net w orks based on top ology anomalies. Human J. 1 (1), 26–39. F ortunato, S. (2010). Comm unit y detection in graphs. Physics r ep orts 486 (3), 75–174. F ris´ en, M. (2009). Optimal sequential surv eillance for finance, public health, and other areas (with discussion). Se quential Analysis 28 , 310–337. Detecting Change in T emporal Networks with the DCSBM 25 F u, W., L. Song, and E. P . Xing (2009). Dynamic mixed membership blockmodel for ev olving net w orks. In Pr o c e e dings of the 26th annual international c onfer enc e on machine le arning , pp. 329–336. A CM. Golden b erg, A., A. X. Zheng, S. E. Fien b erg, and E. M. Airoldi (2010). A surv ey of statistical net w ork mo dels. F oundations and T r ends R in Machine L e arning 2 (2), 129–233. Greene, D., D. Doyle, and P . Cunningham (2010). T rac king the ev olution of comm unities in dy- namic so cial net w orks. In 2010 international c onfer enc e on advanc es in so cial networks analysis and mining (ASONAM) , pp. 176–183. IEEE. Han, Q., K. Xu, and E. Airoldi (2015). Consistent estimation of dynamic and m ulti-la y er blo ck mo dels. In Pr o c e e dings of the 32nd International Confer enc e on Machine L e arning (ICML-15) , pp. 1511–1520. Hannek e, S., W. F u, and E. P . Xing (2010). Discrete temporal models of social net works. Ele ctr onic Journal of Statistics 4 , 585–605. Heard, N. A., D. J. W eston, K. Platanioti, and D. J. Hand (2010). Bay esian anomaly detection metho ds for so cial net w orks. The Annals of Applie d Statistics 4 (2), 645–662. Holland, P . W., K. B. Laskey , and S. Leinhardt (1983). Sto chastic blo ckmodels: first steps. So cial networks 5 (2), 109–137. Jones-F armer, L. A., W. H. W o o dall, S. H. Steiner, and C. W. Champ (2014). An ov erview of phase I analysis for pro cess impro v emen t and monitoring. Journal of Quality T e chnolo gy 46 (3), 265–280. Karrer, B. and M. E. Newman (2011). Sto c hastic blo ckmodels and comm unit y structure in net- w orks. Physic al R eview E 83 (1), 016107. Kasth urirathna, D. and M. Pirav eenan (2015). Emergence of scale-free c haracteristics in so cio- ecological systems with b ounded rationalit y . Scientific r ep orts 5 . Krebs, V. E. (2002). Mapping netw orks of terrorist cells. Conne ctions 24 (3), 43–52. Krivitsky , P . N. and M. S. Handco c k (2014). A separable mo del for dynamic netw orks. Journal of the R oyal Statistic al So ciety: Series B (Statistic al Metho dolo gy) 76 (1), 29–46. Marc hette, D. (2012). Scan statistics on graphs. Wiley Inter disciplinary R eviews: Computational Statistics 4 (5), 466–473. McCulloh, I. and K. M. Carley (2011). Detecting c hange in longitudinal so cial netw orks. Journal of So cial Structur e 12 , 1–37. Mollo y , M. and B. Reed (1995). A critical p oin t for random graphs with a giv en degree sequence. R andom structur es & algorithms 6 (2-3), 161–180. Mon tgomery , D. C. (2013). Intr o duction to statistic al quality c ontr ol (7 ed.). John Wiley and Sons, Inc. Mo ody , J. and P . J. Mucha (2013). Portrait of political party p olarization. Network Scienc e 1 (01), 119–121. Neil, J., C. Hash, A. Brugh, M. Fisk, and C. B. Storlie (2013). Scan statistics for the online detection of lo cally anomalous subgraphs. T e chnometrics 55 (4), 403–414. Newman, M. E. (2006). Mo dularit y and comm unit y structure in net works. Pr o c e e dings of the National A c ademy of Scienc es 103 (23), 8577–8582. No wic ki, K. and T. A. Snijders (2001). Estimation and prediction for sto chastic blo c kstructures. Journal of the Americ an Statistic al Asso ciation 96 (455), 1077–1087. 26 James D . Wilson et al. P andit, S., D. H. Chau, S. W ang, and C. F aloutsos (2007). Netprob e: a fast and scalable system for fraud detection in online auction netw orks. In Pr o c e e dings of the 16th international c onfer enc e on World Wide Web , pp. 201–210. ACM. P ark, Y., C. E. Prieb e, and A. Y oussef (2013). Anomaly detection in time series of graphs using fusion of graph inv ariants. IEEE Journal of Sele cte d T opics in Signal Pr o c essing 7 (1), 67–75. P ark er, K. S., J. D. Wilson, J. Marsc hall, P . J. Muc ha, and J. P . Henderson (2015). Net w ork analysis rev eals sex-and an tibiotic resistance-asso ciated an tivirulence targets in clinical uropathogens. A CS Infe ctious Dise ases 1 (11), 523–532. P eel, L. and A. Clauset (2014). Detecting c hange points in the large-scale structure of evolving net w orks. arXiv pr eprint arXiv:1403.0989 . P orter, M. A., J.-P . Onnela, and P . J. Mucha (2009). Comm unities in net w orks. Notic es of the AMS 56 (9), 1082–1097. P orter, M. D. and G. White (2012). Self-exciting hurdle mo dels for terrorist activity . The Annals of Applie d Statistics 6 (1), 106–124. Prieb e, C. E., J. M. Conroy , D. J. Marchette, and Y. P ark (2005). Scan statistics on Enron graphs. Computational & Mathematic al Or ganization The ory 11 (3), 229–247. Qin, T. and K. Rohe (2013). Regularized sp ectral clustering under the degree-corrected sto chastic blo c kmodel. In A dvanc es in Neur al Information Pr o c essing Systems , pp. 3120–3128. Rae, N. C. (1989). The De cline and F al l of the Lib er al R epublic ans: fr om 1952 to the Pr esent . Oxford Univ ersit y Press, USA. Reid, E., J. Qin, Y. Zhou, G. Lai, M. Sageman, G. W eimann, and H. Chen (2005). Collecting and analyzing the presence of terrorists on the web: A case study of jihad w ebsites. In Intel ligenc e and Se curity Informatics , pp. 402–411. Springer. Ro y , S., Y. Atc hade, and G. Mic hailidis (2014). Change-point estimation in high-dimensional Mark o v random field mo dels. arXiv pr eprint arXiv:1405.6176 . Saleh, N. A., M. A. Mahmoud, L. A. Jones-F armer, I. Zwetsloot, and W. H. W o o dall (2015). Another lo ok at the EWMA control chart with estimated parameters. Journal of Quality T e ch- nolo gy 47 (4), 363–382. Saleh, N. A., M. A. Mahmoud, M. J. Keefe, and W. H. W o odall (2015). The difficult y in designing Shewhart xbar and x con trol c harts with estimated param ters. Journal of Quality T e chnol- o gy 47 (2), 127–138. Sa v age, D., X. Zhang, X. Y u, P . Chou, and Q. W ang (2014). Anomaly detection in online so cial net w orks. So cial Networks 39 , 62–70. Sew ell, D. K. and Y. Chen (2015). Laten t space mo dels for dynamic netw orks. Journal of the A meric an Statistic al Asso ciation 110 (512), 1646–1657. Shett y , J. and J. Adibi (2005). Discov ering imp ortant no des through graph entrop y the case of Enron email database. In Pr o c e e dings of the 3r d international workshop on Link disc overy , pp. 74–81. A CM. Smith, R. N. (2014). On his own terms: A life of Nelson Ro ckefel ler . Random House. Snijders, T. A. and K. No wic ki (1997). Estimation and prediction for sto chastic blo c kmodels for graphs with latent blo ck structure. Journal of Classific ation 14 (1), 75–100. Sparks, R. and J. D. Wilson (2016). Monitoring communication outbreaks among an unknown team of actors in dynamic netw orks. arXiv pr eprint arXiv:1606.09308 . Detecting Change in T emporal Networks with the DCSBM 27 Sussman, D. L., M. T ang, D. E. Fishkind, and C. E. Prieb e (2012). A consistent adjacency sp ectral em bedding for sto c hastic blo c kmodel graphs. Journal of the A meric an Statistic al Asso- ciation 107 (499), 1119–1128. V argas, J. A. (F ebruary 17, 2012). Spring aw akening: ho w an Egyptian revolution b egan on faceb ook. The New Y ork Times, Sunday Bo ok R eview . V on Luxburg, U. (2007). A tutorial on sp ectral clustering. Statistics and c omputing 17 (4), 395–416. Wilson, J., S. Bhamidi, and A. Nob el (2013). Measuring the statistical significance of lo cal con- nections in directed net works. Neur al Information Pr o c essing Systems: F r ontiers of Network A nalysis: Metho ds, Mo dels and Applic ations . Wilson, J. D., S. W ang, P . J. Mucha, S. Bhamidi, and A. B. Nob el (2014). A testing based extraction algorithm for identifying significan t communities in net w orks. The Annals of Applie d Statistics 8 (3), 1853–1891. W o o dall, W. H. (2016). Bridging the gap b etw een theory and practice in basic statistical pro cess monitoring. Quality Engine ering , In press. W o o dall, W. H. and D. C. Mon tgomery (1999). Research issues and ideas in statistical pro cess con trol. Journal of Quality T e chnolo gy 31 (4), 376–386. W o o dall, W. H. and D. C. Mon tgomery (2014). Some curren t directions in the theory and appli- cation of statistical pro cess monitoring. Journal of Quality T e chnolo gy 46 (1), 78–94. W o o dall, W. H., M. Zhao, K. Pa ynabar, R. Sparks, and J. D. Wilson (2016). An ov erview and p ersp ectiv e on so cial net w ork monitoring. IIE T r ansactions , In press. arXiv preprin t Xu, K. S. and A. O. Hero (2013). Dynamic sto c hastic blo c kmodels: Statistical mo dels for time- ev olving netw orks. In So cial Computing, Behavior al-Cultur al Mo deling and Pr e diction , pp. 201– 210. Springer. Y an, X., C. Shalizi, J. E. Je nsen, F. Krzak ala, C. Mo ore, L. Zdeb oro v´ a, P . Zhang, and Y. Zh u (2014). Mo del selection for degree-corrected block models. Journal of Statistic al Me chanics: The ory and Exp eriment 2014 (5), P05007. Y u, L., K. L. Tsui, and W. H. W o o dall (2016). Detecting no de prop ensity changes in dynamic degree corrected sto chastic blo c k models. W ork in progress. Zhao, M. J., A. R. Driscoll, R. D. F ric k er Jr., W. H. W o o dall, and D. J. Spitzner (2016). Per- formance ev aluation of so cial netw ork anomoly detection using a moving windo w based scan metho d. Submitted to Computational and Mathematic al Or ganization The ory .
Original Paper
Loading high-quality paper...
Comments & Academic Discussion
Loading comments...
Leave a Comment