Data Science in Service of Performing Arts: Applying Machine Learning to Predicting Audience Preferences
Performing arts organizations aim to enrich their communities through the arts. To do this, they strive to match their performance offerings to the taste of those communities. Success relies on understanding audience preference and predicting their b…
Authors: Jacob Abernethy (University of Michigan), Cyrus Anderson (University of Michigan), Alex Chojnacki (University of Michigan)
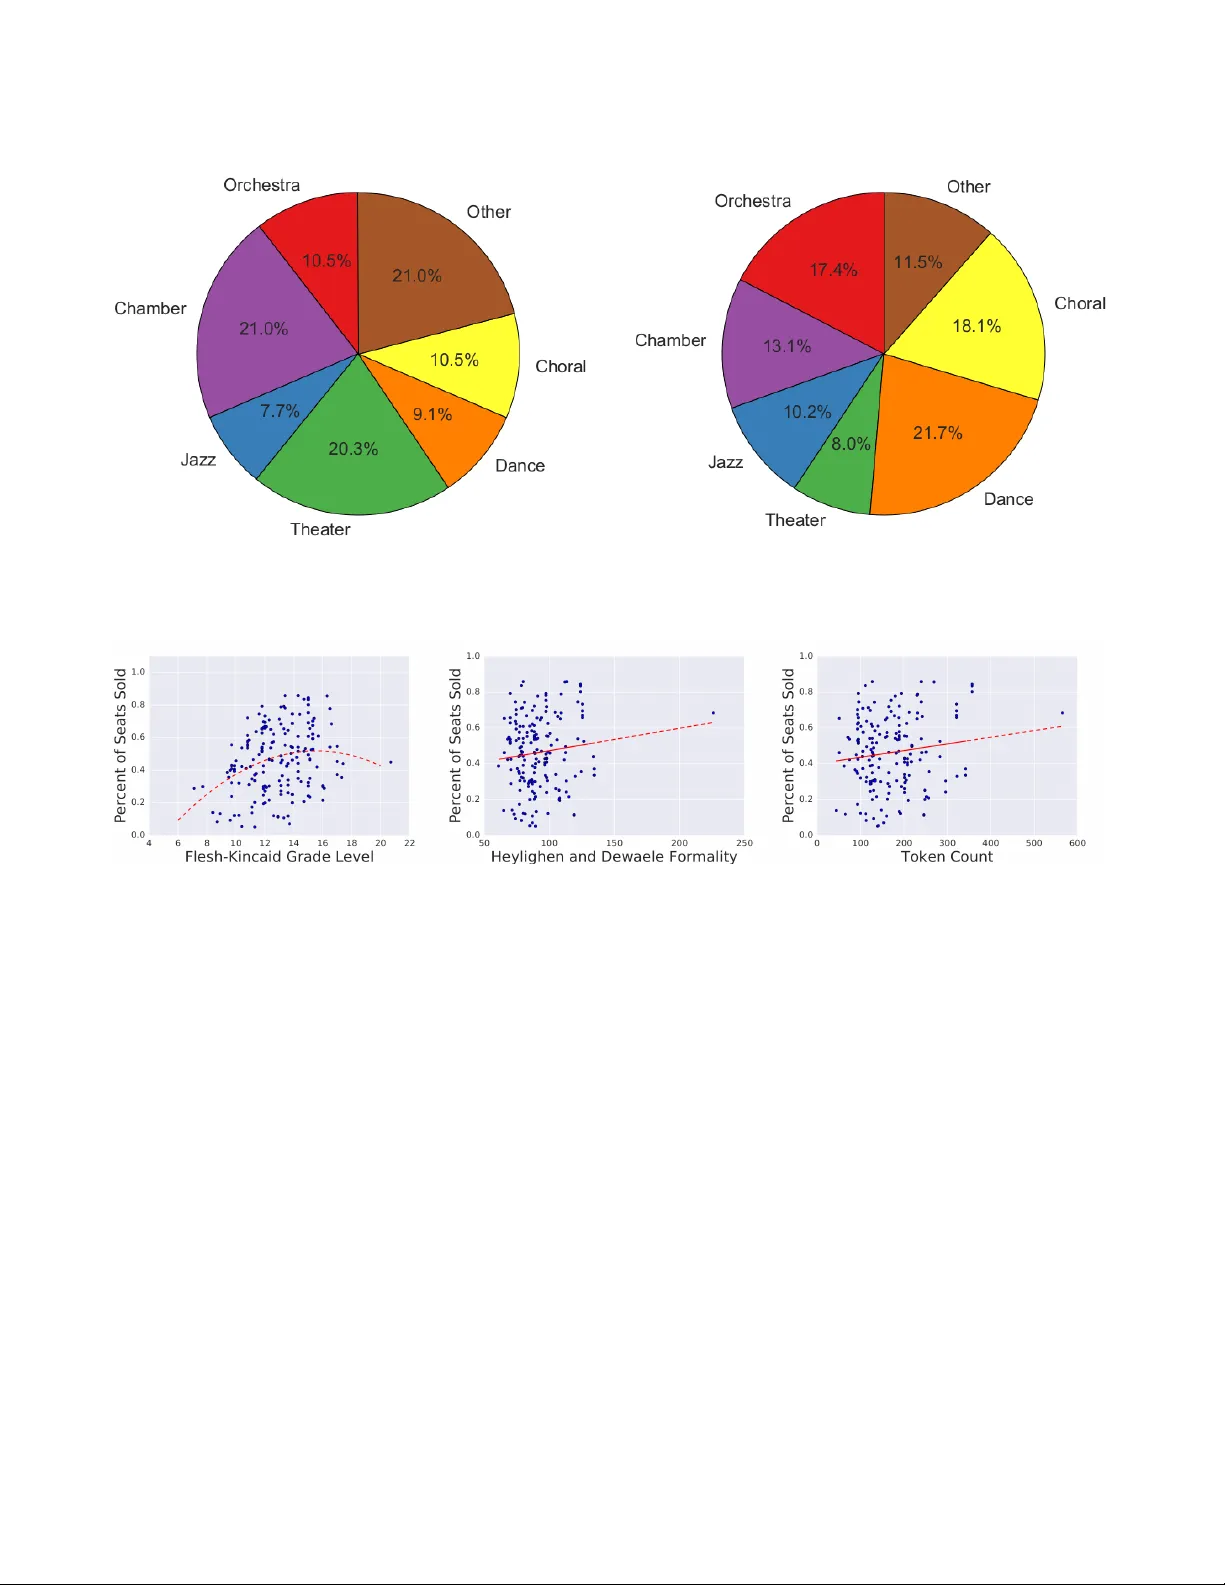
Data Science in Service of P erf orming Ar ts: Appl ying Machine Learning to Predicting A udience Preferences Jacob Aber neth y University of Michigan Ann Arbor, MI jabernet@umich.edu Cyrus Anderson University of Michigan Ann Arbor, MI andersct@umich.edu Ale x Chojnacki University of Michigan Ann Arbor, MI thealex@umich.edu Chengyu Dai University of Michigan Ann Arbor, MI daich@umich.edu John Dr yden University of Michigan Ann Arbor, MI jcdryden@umich.edu Eric Schwar tz University of Michigan Ann Arbor, MI ericmsch@umich.edu W enbo Shen University of Michigan Ann Arbor, MI shenwb@umich.edu Jonathan Stroud University of Michigan Ann Arbor, MI stroud@umich.edu Laura Wendlandt University of Michigan Ann Arbor, MI wenlau ra@umich.edu Sheng Y ang University of Michigan Ann Arbor, MI physheng@umich.edu Daniel Zhang University of Michigan Ann Arbor, MI dtzhang@umich.edu ABSTRA CT P erforming arts organizations aim to enrich th eir commu- nities through the arts. T o do this, they strive to match their p erformance offerings to the taste of those communi- ties. Success relies on understanding audience preference and predicting their b eha vior. Similar to most e-commerce or digital entertainmen t firms, arts presenters need to rec- ommend the righ t p erformance to the right customer at the righ t time. As part of the Michigan Data Science T eam (MDST), we partnered with the Universit y Musical So ciet y (UMS), a non-profit performing arts presen ter housed in the Univ ersity of Michigan, Ann Arb or. W e are providing UMS with analysis and business intelligence, utilizing historical individual-lev el sales data. W e built a recommendation sys- tem based on collab orativ e filtering, gaining insights in to the artistic preferences of customers, along with the similar- ities betw een p erformances. T o b etter understand audience behavior, we used statistical metho ds from customer-base analysis. W e characterized customer heterogeneit y via seg- men tation, and we modeled customer cohorts to understand and predict tick et purc hasing patterns. Finally , we com- bined statistical modeling with natural language pro cessing (NLP) to explore the impact of wording in program descrip- tions. These ongoing effort s prov ide a platform to launch targeted mark eting campaigns , helping UMS carry out its mission b y allo cating its resources more efficien tly . Celebrat- ing its 138th season, UMS is a 2014 recip ient o f the National Medal of Arts, and it con tinues to enric h comm unities b y connecting world-reno wned artists with diverse audiences, especially students in their formative years. W e aim to con- Bloomb erg Data for Go od Exchange Conference. 25-Sep-2016, New Y ork City , NY, USA. tribute to that mission through data science and customer analytics. K eywords Mac hine Learning, Collab orativ e Filtering, Natural Languag e Processing 1. INTR ODUCTION The Universit y Musical So ciet y (UMS) is a 501(c)(3) non- profit p erforming arts organization affiliated with the Uni- v ersity of Michigan in Ann Arbor. UMS seeks to engage the comm unit y with new and innov ative artists. F ounded in the win ter of 1880, UMS is one of the oldest non-profit performing arts presen ters in the country and presen ts 65 to 75 sho ws p er year in a v ariet y of genres. UMS holds even ts in the Ann Arbor area across multiple ven ues. The largest is Hill Auditorium, which has a maximum capacit y of 3,536 and accommo dates world -class musician s and p erformers. On the one hand, UMS is a non-profit organization, dep end- ing on donations and gran ts for funding. On the o ther, it de- pends on generating reven ue through tic ket sales. Muc h like man y other businesses, UMS uses common tactics in multi- c hannel retail, online marketing, and digital con tent distri- bution to maximize its marketing strategy . UMS maintains a large purchase history database, containing information suc h as what marketin g material w as sent to customers, ho w tic kets were purc hased, and how users’ purc hasing habits ha ve changed ov er time. In this pap er, w e explore how this ric h dataset can be further utilized to gain a b etter understanding of the UMS audi- ence to even tually guide marketing and ev ent programming decisions. W e sho w ho w mac hine learning and other da ta analysis techniques can b e applied to gain insigh t into pur- c hasing patterns, as w ell as suggest impro vemen ts in future mark eting strategy . Section 2 p ositions this work in the con- text of other research. Section 3 describes the main UMS dataset, as w ell as additio nal data collected, and p rovides model-free visualizations of the data patterns. Section 4 examines the performances themselves, sp ecifically through the language used in descriptions. Section 5 uses collab o- rativ e filtering techniques to analyze purc hase history data. Section 6 sho ws how Mark ov cha ins can be used to mo del the data, linking to a broader stream of statistical mo deling in customer-base analysis. Finally , we end in Section 7 with conclusions and future work. 2. RELA TED WORK Prior to this, p erforming arts organizations ha ve used data analytics to b etter understand their customer bases. There has been work done on segmen ting customers in to wel l- defined groups based on their purchasing b eha viors [3, 13]. Our work lev erages new adv ances in machine learning and data science to b etter understand customer b eha vior. One of the techniques that we incorporate is text analysis. W e use stylistic features of the text, which hav e previously been used to predict things like documen t authorship and genre [5, 9]. Another con tribution is that we demonstrate ho w to utilize recent developmen ts in matrix factorization [11] to understand customer artistic preferences and how tic ket sales are correlated based on the artistic styles of p er- formances. In our metho d, all of these analytics can be ex- tracted from easily accessible tick et purc hase data, without organizing dedicated customer surveys. Finally , we use cus- tomer lifecycle analysis, modeling customers’ ability to buy with Mark o v c hains [4], similar to [14], where Marko v c hains w ere used to mo del customers’ switc hing betw een differen t brands. 3. D A T A UMS has provided us with five y ears of anonymized tic k et purc hasing data from 2011 to 2015. W e use the first three y ears for training and hold out the most recent t w o y ears for test data. This data set includes ov er 190,000 transactions from 48,000 users, totaling o v er $13 million in rev en ue. Eac h transaction contains the following pieces of information: • UMS account num ber • Date the accoun t w as created (or digitalized, for pre- digital accounts) • Customer type (either a household, individual, or or- ganization) • Name, date, and ven ue of the p erformance • Price of the tick ets and num ber of seats sold • Information ab out whether the tick et was part of a promotion or sp ecial offer • Mo de of sale (how the tick et was b ought, for example, via the UMS website or ov er the phone) • Date of the order • Postal co de of the customer One particu larly important dynamic captured in the dataset is information ab out subscr iptions. A t the b eginning of each performance season, UMS offers customers the chance to purc hase sub scriptions, whic h are pac k ages of tick ets for a series of sh ows. Usually each subscription is thematic and includes related shows. Some current subscription series are Dance and Theater, Jazz, and Choral / V o cal. Subscriptions often need to b e treated differently during data analysis b e- cause when customers buy a series, they do not individually select each show. This changes their purc hasing patterns and b ehaviors. 3.1 Data V isualizations Data visualizations reveal patterns in terms of customer ac- tivit y , reven ue comp osition, and purc hase patterns. Figure 1 shows select statistics and visualizations from the UMS dataset. W e d efine the activit y duration of each customer as the time span b et ween the first purchase and the last purc hase. In terestingly , 66% p ercen t of customers made only one purchase, never returning to buy another tick et. This suggests that there is great potential to con vert these one-time customers into frequen t customers. The imp or- tance of frequen t customers is highligh ted in the pie c hart of the reven ue comp osition. This pie chart shows that more than one-third of all reven ue is from subscription purcha ses. This relativ ely large p ercen tage of reven ue is from a rela- tiv ely small fraction of customers, as only 5. 6% customers are subscription buy ers. High purc hase concent ration is to be expected with a large heterogeneous audience. Finally , w e find that the non-su bscription purc hases and subscrip- tion purc hases ha v e distinct time patterns. Non-subscription (regular tick et) purchases are distributed throughout the y ear. There are almost no non-subscrip tion purchases in the mon ths of May , June, and July since there are generally no performances sc heduled during these mon ths. In addition, at the opening day s of v arious tick et groups, there is alwa ys a rush for tick ets. Contrary to the non-subscription purchases, subscription purchases are concen trated from April to June when there are very few p erformances. This is understand- able since the subscriptions are for the coming season from Septem b er to April of next year. The rushes for tic kets in both patterns imply that performances organized b y UMS are very p opular and wel l-received. 3.2 Perf ormance Descriptions T o augment the purchasing data provided by UMS, we col- lect descriptions for each p erformance. These descriptions are written by UMS and are publicly a v ailable on the UMS w ebsite. The av erage description length is 164.4 tokens, where eac h token is either a w ord or a symbol. After the descriptions are collected, they are manually categorized in to sev en categories: Orchestra, Chamber, Jazz, Theater, Dance, Choral, and Other. Figure 2 s hows the p ercen tage of p erformance descriptions in eac h category , as well as the total num b er of seats sold in each genre. These charts high- ligh t some discrepancies in the n um b er of shows offered for eac h genre and the p opularit y of eac h genre. F or example, I ndividual tickets on sale S tuden t tickets on sale Subscr iption tickets on sale Jan Fe b M ar Ap r M ay Jun Jul Au g S ept Oc t N ov D ec Jan Fe b M ar Ap r M ay Jun Jul Au g S ept Oc t N ov D ec Figure 1: T op left pie chart: the duration of customers’ activities. The duration is defined as the time span betw een the customer’s first purc hase and his or her last purc hase. T op righ t pie c hart: UMS rev en ue composition by the price groups: regular price, subscription price, studen t price, or other. T op heat map: the n umber of non-subscription tick ets b ought throughout the y ear. Darker colors indicate that more tic ket s were bought on that da y . Bottom heat map: the n um b er of subscription tick ets bought throughout the year. F or b oth heatmaps, purchase data from 2013 is used. 9.1% of performances are in the Dance category , while 21.7% of the total num ber of seats sold are to Dance sho ws. 4. WORDING IN PERFORMANCE DESCRIP- TIONS One of the marketing to ols that UMS has at their disposal is the written p erformance descriptions distributed via pro- grams, bro c hures, p osters, and online media. Analyzing the writing st yle of these descriptions can provide insight into wh y customers choose to see the shows that they do. They also help to explain similarity of p erformances and artists. Sev eral metrics exist to measure the style of a piece of writ- ing. One of these is readability , which assigns a reading grade level to a piece of writing. One standard measure of readabilit y is the Flesc h-Kincaid Grade Lev el [10]. This measure is often used to measure the complexity of a piece of literature [1, 7]. The grade level is calculated according to the following formula: 0 . 39 total words total sentences + 11 . 8 total syllables total words − 15 . 59 (1) Another text-based style metric is formalit y . F ormality at- tempts to quantify the preciseness and informativeness of a statemen t. The Heylighen and Dewaele measure of formalit y is calculated according to the follo wing formula [8]: (noun freq. + adjectiv e freq. + prep osition freq.+ article freq. − pronoun freq. − verb freq. − adv erb freq. − interjection freq. + 100) / 2 (2) A third text-based st yle metric is the length of a do cument. Figure 3 shows the relationship b et ween these three metrics and the p ercentage of seats sold for ev ery show. Only tick- ets that are not part of a subscription are included for this analysis. A 2-dimensional line of best fit is fitted to the read- abilit y plot, while 1-dimensional lines of b est fit are fitted to Figure 2: The left pie c hart shows p erformance descriptions broken down by category . The right pie chart compares the total n umber of seats sold in each genre. Figure 3: Style metrics applied to the written performance descriptions. These graphs sho w the relationship b etw een three st yle metrics (readability , formality , and length) and the p ercen tage of seats sold for that show. These plots do not include tic kets sold as part of a subscription. Eac h graph is fitted with either a 2-dimensional or a 1-dimensional line, to sho w the trends in the data. The Pearson correlation co efficien ts for these scatter plots are, from left to right, 0.26, 0.12, and 0.14. the other plots. These plots sho w that on a v erage, as for- malit y and description length increase, there is an increase in the n um b er of tick ets sold for that p erformance. There is a similar trend for readabilit y , but this data is b etter fit- ted with a p olynomial curve, indicating that the optimal readabilit y for a program description is around grade level 15. 5. COLLABORA TIVE FIL TERING MODEL- ING FOR PURCHASE HISTOR Y In addition to analyzing performance descriptions, another w ay to understand historical purc hasing patterns is through the use of a model based on collab orative filtering. [2, 11]. P opularized b y the Netflix Prize in 2006, collaborative filter- ing is a technique that automatically matches customers to performances they might enjoy based on information such as purc hase history and customer or conten t similarit y . Unlike Netflix, where conten t remains a v ailable to all users, a p er- forming arts organization has liv e p erformance c onstraints that come and go. Because of this, the collab orative filter- ing approach applied will hav e to mak e recommendations among a small set of possible shows remaining in the giv en season. W e return to this as future work in the final section. Another in teresting comp onen t of this collab orativ e filter- ing modeling problem is the div ersit y of p erformances across genres. Due to the great v ariety of UMS p erformances, it is difficult to define a reliable similarit y metric that can b e used to compare p erformances. Therefore, our system relies primarily on well-documented recent purchase history . Ap- plying matrix factorization (MF) to collab orativ e filtering has achiev ed great success in b oth academic researc h and industrial application. W e adopt this approac h, which is formally introduced b elo w. 5.1 Methodology First, we represent purc hase history as a binary-v alued ma- trix X with dimensions N c x N p , where N c and N p are the num b ers of unique customers and p erformances, resp ec- tiv ely , in the dataset. X ij = 1 indicates that customer i purc hased a tick et for p erformance j , and X ij = 0 indi- cates that no tick et was purchased. Figure 4: Visualizing artistic preferences of b oth students (red) and the general public (black). This scatter plot sho ws the em b eddings of different customers in a latent space representing artistic style preferences. Figure 5: Visualizing artistic styles for p erformances that belong to differen t subscription series. Green: Choral Unions, Purple: Cham ber Music, Black: Dance, Orange: Jazz, Red: Others Ev ery customer’s willingness to purchase a tick et for a sp e- cific performance can b e expressed in terms of how w ell that performance matches each of the artistic st yles the customer is interested in. W e also include constant bias terms to model that some customers hav e more buying p ow er and similarly some p erformances are more p opular than others. This gives us the following equation. X ij ≈ X l L il R j l + B L i + B R j (3) T ranslating into the language of matrices, X ≈ LR T + B L + B R (4) A more formal wa y of p osing the problem is to express it in terms of a regularized F rob enius norm optimization prob- lem, as follows: minimize L , R , B L , B R k X − LR T − B L − B R k 2 F + λ 2 k L k F + λ 2 k R k F sub ject to L ∈ M N c ,L , R ∈ M N p ,L , B L , B R , ∈ M N c ,N p In the abov e equation, B L / B R are column-wise / ro w-wise constan t matrices resp ectively . This optimization problem is closely related t o singular v alue decomposition (SVD). It is generalized to include a constant term in the formula and to make training possible even when some of the data is not present. Standard approac hes to training this model include sto ch as- tic gradient descen t (SGD) and alternating least square (ALS). W e adopt the latter approac h, b ecause empirically we found that SGD with all random initialization fails to conv erge when th e matrix is tall-and-skin ny (when the num b er of cus- tomers greatly exceeds the n umber of p erformances). Note that if w e fix either L or R and optimize with resp ect to the other, then the problem b ecomes a standard quadratic matrix optimization problem whic h can be solv ed by least squares. Alternating b etw een fixing either L or R and solv- ing for the other, the algorithm con v erges reasonably well after a few h undred steps for practical use and further study . 5.2 Interpr eting the Factorization This simple matrix factorization mo del can provide insight in to customers and p erformances, based solely on the pur- c hase history . L and R ha ve clear geometric interpretatio ns as collections of vect ors of each customer or performance’s position in the laten t space of artistic st yle. F or each cus- tomer v ector, the magnitude of the v ector is related to the total purchases of the c ustomer, while the direction o f th e v ector represen ts the customer’s artistic style preferences. F or each p erformance v ector, the magnitude of the v ector is related to the n um b er of seats sold for the performance, while the direction of the vector represents the artistic style of the p erformance. Each poin t in th e laten t space repre- sen ts a vector connecting the origin to that p oin t. 5.2.1 Customer Prefer ence Analysis These customer vectors can b e used to explore customer heterogeneit y in taste. Since UMS is affiliated with the Uni- v ersity of Mic higan, w e will use those v ectors to compare univ ersity studen ts’ artistic preferences with the preferences of the non-studen t general public. This analysis furthers one of the core goals of UMS, which is to enrich studen ts’ cul- tural exp eriences. T o in v estigate this question, we restrict our mo del to the three most significant latent dimensions, to allow for easy visualization. W e separate out students b y lo oking for customers who hav e purchased tick ets from a studen t promotion or at a student price. F rom the visualization of Figure 4, w e conclude that b oth studen ts and the general public hav e large in-group v aria- tion of artistic style preferences. This is reflected in the di- v erse directions of the latent vectors; they cannot b e simply clustered into a few definite groups. The great spectrum of performance t yp es that UMS curren tly provides serves this div erse communit y well. More importantly , our result also s uggests that in general studen ts do not hav e differen t artistic preferences than reg- ular customers. Ho w ever, the latent vect ors representing studen t customers hav e sma ller magnitudes, meaning that studen ts in general hav e less willingness to purc hase. This certainly has face v alidity , as students t ypically hav e smaller incomes than w orking adults. This analysis, while not able to mak e strong causal claims, suggests that UMS ma y be wise to contin ue their current student discount pricing p ol- icy , which is giving general discoun ts to students while not limiting the discounts to any sp ecific types of p erformances. 5.2.2 P erformance Style Analysis Another question of interest is if p erformances in the same subscription series are also similar in terms of artistic style. W e inv estigate this question by sp ecifically analyzing the purc hase data excluding subscription tick ets. Performance v ectors with similar directions indicate similar artistic styles, as shown in Fi gure 5. In general, Jazz (orange) p erformances and Choral Union (green) series do show similarity with others of their kind. Cham b er (purple) and Dance (black) performances are represen ted by latent vect ors with very small magnitudes due to limited v enue sizes relativ e to other genres. Additio nally , a few Other (red) performances ap- pro ximately form a straight line, showing v ery related style. Man y of these are ann ually recurring p erformances of Han- del’s Messiah, an Ann Arb or traditional holiday show that man y p eople attend. In general, w e found individual tic ket purc hase patterns match the hand-pic ked subscription series based on genre, as exp ected. 5.3 Discussion on Missing Data As most of UMS’s customers come from the lo cal college to wn of Ann Arb or, many of them hav e only b een residents of the to wn for a few y ears. This must b e taken in to ac- coun t when considering a customer’s willingness to purchase a tic k et. If a p erson is not living in Ann Arb or at the time of the p erformance, he or she should not b e considered unwill- ing to purchase the tick et. Instead, that information should be considered missing. A reasonable appro ximation of the customer’s arriv al time is the customer’s UMS account cre- ation date. Our training method ALS supp orts the use of missing en- tries, as long as w e solve for each L i v ector sequentially , b y doing regression only on the p erformance entries j that are not missing for a particular customer (lik ewise for training R j ). After this correction, the mo del contains significantl y few er artifacts and is more interpretable. 6. CUSTOMER LIFECYCLE ANAL YSIS Collaborative filtering provides a wa y to analyze the artistic preferences of users. Another w ay t o understand transac- tion history is to analyze dynamics of purchase b eha vior throughout a customer’s lifecycle, with an aim to wards cal- culating customer lifetime v alue. This information is partic- ularly helpful for iden tifying which customers will b e most v aluable in the future (and which should be ignored). Know- ing this can improv e the efficiency of targeted promotional efforts, from costly postal mail catalogs to more p ersonalized emails. W e dra w on a rich literature of customer-base analysis and customer relationship managemen t in marketing [6]. T o be- gin, w e will use a lifecycle co nsisting of three stages: ‘activ e’, ‘inactiv e’, and ‘dead’. While these can b e inferred from the data as laten t states, we provide an anal ysis based on o b- serv ed stages. If a customer purchases any tic kets in a year, he or she is asso ciated with the active state. The inactive state means the customer purchas es no tick ets in a giv en y ear, and the dead state is reache d if a customer is inac- tiv e for tw o or more y ears. These three lifecycle states can be mo deled u sing a Marko v c hain. A Mark ov chain mo d- els system dynamics as a set of states, where at the end of eac h season, a customer can transition from one state to any other state according to a set of probabilities. The transi- tion probabilities dep end only on the current state. Fitting the mo del then en tails finding the nonzero transition prob- abilities. The fitted Mark o v chain is shown in Figure 6. Nearly half the customers in a given cohort b ecome inactive, and of the inactiv e customers, most do not return, i.e., are ch urned. W e see that UMS sustains this turnov er with a num b er of completely new customers eac h year. Nev ertheless, under- standing customer ch urn is important in balancing custome r acquisition and retention efforts. 7. CONCLUSION & FUTURE WORK The work presen ted in this pap er analyzes historical pur- c hase history data for UMS. W e analyze the correlation betw een program description w ording and tick et sales and utilize collaborative filtering techniques to understand cus- tomer artistic preferences and performance styles. W e also model the lifecycle of customers as a Marko v cha in, showing ho w customer activit y falls in to regular patterns. This work is ongoing in all three fronts. The Marko v mo del of customer lifecycles presented here relies on ‘observed’ states with predefined lab els. But future work will infer ‘unobserv ed’ states using hidden Marko v mo dels. A sp ecial case of these mo dels is kno wn as ‘Buy till y ou die’ mo dels [6]. By allo wing for customer c hurn to be inferred, we will aim for deep er understan ding of purc hase behavi or throughout the customer lifecycle. Mo ving forward, we are w orking on building an intelligen t recommendation system that will b e able to predict which customers wi ll enjo y new shows. While this build s on collab- Figure 6: A Marko v chain sho wing the lifecycles of UMS customers. The three stages in this cycle are “active” , “inactiv e” , and “death” . The probabilities of mo ving from one stage to another are shown in the diagram. The transitions o ccur ann ually . orativ e filtering techniques, it is made more difficult by the ‘cold start problem.’ This o ccurs when there is no av ailable purc hasing information for previously unseen shows. One solution to this problem is to compare new sho ws with previous shows that are similar in conten t. This requires ha ving some means of assessing similarity betw een sho ws. W e hav e b egun work ing on a wa y to do this using topic modeling on performance descriptions. T opic mo dels extract a set of topics from a corpus of train ing do cuments. Each topic is a distribution of w ords, and it describ es whic h words are used most frequently in that particular topic. Then, eac h document is assigned a distribution of topics. Docu- men ts that hav e similar topic distributions should hav e sim- ilar conten t. T opic mo deling can be used to assign topic distributions to each p erformance description and find sim- ilar p erformances. In order to ha ve an effective topic mo del, it must be trained o ver a large corpus of do cuments. The p erformance descrip- tions are short and do not provide enough in formation to train a goo d model. W e ha ve begun collecting a m uc h larger corpus of performance-related documents to train a model. This larger corpus consists of Wikip edia pages that are rele- v ant to differen t p erformance genres, suc h as theater, dance, and orchestra. The larger corpus will b e used to train an ef- fectiv e topic mo del, which will then b e used to find similar- it y scores b et ween different p erformance descriptions. This information will b e input to the collab orativ e filtering algo- rithm to complete a fully functional recommendation sys- tem. F rom a metho dological persp ective, w e see a promising di- rection in combining these three areas: topic modeling, col- laborative filtering, and predictiv e models of repeat cus- tomer behavior. Such an integration across data science approac hes will not only b e useful to UMS and arts orga- nizations, but to a broader metho dological and customer analytics audience as well. Our work demonstrates ho w data science can help nonprofit organizations further ac hiev e their missions. Data visualiza- tions and business analytics help extract information in un- derutilized data and iden tify areas of impro vemen t. The sta- tistical mo dels and machi ne learning approaches presen ted here are only a starting p oint for wa ys data science can help inform decision making in the p erforming arts. Acknowledgments The authors would like to thank UMS, sp ecifically the UMS staff Sara Billman, Anna Prushinsk a ya, and Mallory Sc hirr for graciously providing their dataset, as well as working with us to identify imp ortant areas of fo cus for our ongoing collaboration. The authors w ould also lik e to thank man y other MDST members who indirectly con tributed to this pro ject. This wo rk is supp orted b y the National Science F oundation under CAREER gran t I IS-1453304, an aw ard that helped facilitate the developmen t of the Michigan Data Science T eam. 8. ADDITIONAL A UTHORS 9. REFERENCES [1] E. Agich tein, C. Castillo, D. Donato, A. Gionis, and G. Mishne. Finding high-quality cont ent in so cial media. In Pr o c e e dings of the 2008 international c onfer enc e on web se ar ch and data mining , pages 183–194. ACM, 2008. [2] R. M. Bell and Y. Koren. Lessons from the netflix prize challenge. ACM SIGKDD Explor ations Newsletter , 9(2):75–79, 2007. [3] A. S. Brown. A segment ation mo del for p erforming arts tick et buyers. Unpublishe d Survey R esults. WolfBr own , 2007. [4] K. L. Chung. Markov chains . Springer, 1967. [5] O. De V el. Mining e-mail authorship. In Pr o c. Workshop on T ext Mining, ACM International Confer enc e on Know le dge Disc overy and Data Mining (KDD’2000) , 2000. [6] P . S. F ader and B. G. Hardie. Probability mo dels for customer-base analysis. Journal of Inter active Marketing , 23:61–69, 2009. [7] D. B. F riedman and L. Hoffman-Go etz. A systematic review of readability and comprehension instrumen ts used for print and web-based cancer information. He alth Educ ation & Behavior , 33(3):352–373, 2006. [8] F. Heylighen and J.-M. Dewaele. F ormality of language: definition, measurement and b eha vioral determinan ts. Interner Bericht, Center “L e o Ap ostel” , V rije Universiteit Br ¨ ussel , 1999. [9] J. Karlgren. Stylistic exp erimen ts in information retriev al. In Natur al language information r etrieval , pages 147–166. Springer, 1999. [10] J. P . Kincaid, R. P . Fishburne Jr, R. L. Rogers, and B. S. Chissom. Deriv ation of new readability formulas (automated readability index, fog coun t and flesch reading ease formula) for navy enlisted p ersonnel. T echnical rep ort, DTIC Do cument, 1975. [11] Y. Koren, R. Bell, C. V olinsky , et al. Matrix factorization techniques for recommender systems. Computer , 42(8):30–37, 2009. [12] D.-R. Liu and Y.-Y. Shih. Hybrid approaches to product recommendation based on customer lifetime v alue and purchase preferences. Journal of Systems and Softwar e , 77(2):181–191, 2005. [13] A. Mitchell. The pr ofessional per forming arts: Atten danc e p atterns, pr efer enc es, and motives , v olume 2. Asso ciation of College, Univ ersity , and Comm unity Arts Administrators, 1984. [14] D. G. Morrison. T esting brand-switching mo dels. Journal of Marketing R ese arch , pages 401–409, 1966.
Original Paper
Loading high-quality paper...
Comments & Academic Discussion
Loading comments...
Leave a Comment