StructMatrix: large-scale visualization of graphs by means of structure detection and dense matrices
Given a large-scale graph with millions of nodes and edges, how to reveal macro patterns of interest, like cliques, bi-partite cores, stars, and chains? Furthermore, how to visualize such patterns altogether getting insights from the graph to support wise decision-making? Although there are many algorithmic and visual techniques to analyze graphs, none of the existing approaches is able to present the structural information of graphs at large-scale. Hence, this paper describes StructMatrix, a methodology aimed at high-scalable visual inspection of graph structures with the goal of revealing macro patterns of interest. StructMatrix combines algorithmic structure detection and adjacency matrix visualization to present cardinality, distribution, and relationship features of the structures found in a given graph. We performed experiments in real, large-scale graphs with up to one million nodes and millions of edges. StructMatrix revealed that graphs of high relevance (e.g., Web, Wikipedia and DBLP) have characterizations that reflect the nature of their corresponding domains; our findings have not been seen in the literature so far. We expect that our technique will bring deeper insights into large graph mining, leveraging their use for decision making.
💡 Research Summary
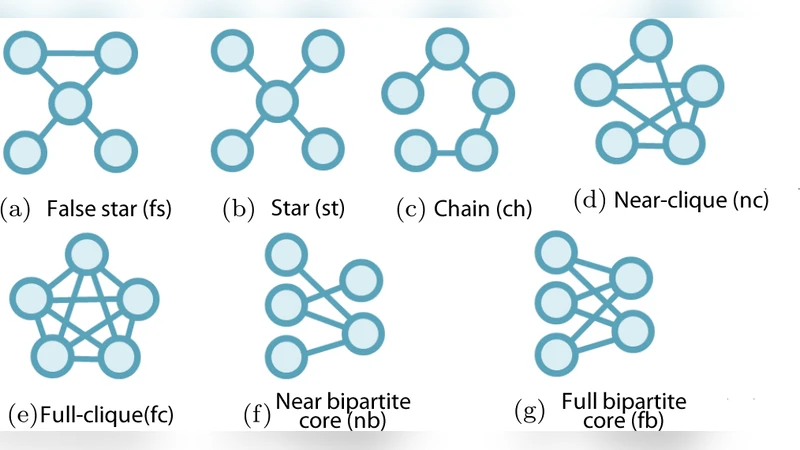
StructMatrix is a methodology that enables the visual inspection of massive graphs by first detecting recurring sub‑structures and then visualizing the relationships among those structures in a dense adjacency matrix. The authors define a vocabulary ψ consisting of seven common patterns—false stars, stars, chains, near‑cliques, full‑cliques, near‑bipartite cores, and full‑bipartite cores—and design an algorithm that partitions a graph into these structures. The partitioning builds on the Slash‑Burn technique: high‑degree hub nodes are removed iteratively (about the top 1 % each step), causing the graph to shatter into smaller connected components. Each component is processed in parallel; if it matches one of the ψ patterns (using simple edge‑to‑node ratio tests and bipartiteness checks) it is recorded as a structure instance, otherwise it is queued for further shattering.
All discovered structures are collected in a set Γ. For every pair of structures (s_i, s_j) the algorithm computes D(s_i, s_j), the number of edges that connect them, and builds an n × n binary matrix M where n = |Γ|. Rows and columns are grouped by structure type, creating a block‑matrix layout. Within each block, structures are ordered by their total degree to other structures, so that the most “connected” instances appear in the lower‑left corner. Because the matrix can be far larger than the display, each block is rendered as a density‑based heat map: multiple original edges are aggregated into a single pixel, and the pixel’s color encodes the combined size of the two structures (blue for small, red for large). Users can adjust the resolution parameters (Res_x, Res_y) to zoom in on a block, revealing finer detail until the original edge‑level view is reached.
The authors evaluate StructMatrix on real‑world graphs with up to one million nodes and several million edges, including a web crawl, the Wikipedia link network, and the DBLP citation graph. The visualizations expose domain‑specific macro‑patterns: the web graph is dominated by large stars and near‑cliques, Wikipedia shows many near‑bipartite cores, and DBLP contains a mixture of chains and stars. Compared with traditional node‑link drawings, edge‑bundling, or plain adjacency‑matrix scaling (e.g., Net‑Ray), StructMatrix achieves far greater scalability, lower memory consumption, and interactive exploration capabilities.
Key contributions are: (1) a novel structure‑centric graph condensation and visualization pipeline, (2) a highly scalable parallel shattering algorithm that maximizes structure detection rather than compression, and (3) empirical evidence that macro‑structure distributions reflect the underlying semantics of different graph domains. Limitations include the fixed set ψ, which may miss more complex or domain‑specific patterns, and reliance on simple density thresholds that can be sensitive to noise. Future work is suggested to incorporate adaptive structure vocabularies, machine‑learning‑based pattern discovery, and richer interactive filtering to broaden applicability.
Comments & Academic Discussion
Loading comments...
Leave a Comment