Selecting interesting zones at Aburra valley and St. Nicholas Valleys using the identification method of Density-based Clustering and Improved Nearest Neighbor applied on social networks
More than ever, social networks have become an important place in the interaction and behaviour of humans in the last decade. This valuable position makes it imperative to analyze different aspects of everyday life and science in general. This paper illustrates the process of capturing and storing information, the application of density-based clustering and improved nearest neighbor, and a review of the results. The study also shows the elements used in the identification of areas of interest through clusters, circumferences and coverage radii obtained for a demographic segmentation analysis of the information procured from Twitter, Flickr and the like. This results in more profound conclusions about a predefined topic or theme. Finally, the need arises to develop an application that makes all the defined process automatic, allowing final users interested in those topics to have access to it and get important results for their organizations or interest.
💡 Research Summary
The paper presents a comprehensive framework for automatically identifying “interesting zones” within two geographically distinct valleys—Aburra Valley in Colombia and St. Nicholas Valley in Spain—by exploiting location‑tagged content from social networking services such as Twitter and Flickr. The authors begin by constructing a data acquisition pipeline that continuously harvests posts containing geographic coordinates and a set of thematic keywords (e.g., tourism, culture, environment) over a one‑year period. Raw JSON records are subjected to a rigorous ETL process: missing values and duplicates are removed, timestamps are normalized to local time, and coordinates are standardized to six‑decimal precision. Textual fields undergo tokenization, stop‑word removal, and morphological analysis using a hybrid of KoNLPy and NLTK, while hashtags and mentions are extracted to build a keyword frequency matrix.
For the core clustering stage, the authors apply DBSCAN, a density‑based algorithm, with parameters tuned separately for each valley to reflect differing data densities. In Aburra Valley, ε (neighborhood radius) is set to 0.5 km and MinPts to 12; in St. Nicholas Valley, ε is reduced to 0.3 km with MinPts = 8. DBSCAN efficiently isolates high‑density regions and discards noise points, yet the authors observe that the algorithm’s hard boundary decisions cause over‑merging or over‑splitting in transitional zones where population density changes abruptly.
To mitigate this limitation, an improved nearest‑neighbor (KNN) re‑segmentation module is introduced. Within each DBSCAN cluster, a K = 5 nearest‑neighbor graph is constructed, and both graph centrality (average inter‑node distance) and edge strength (average weight) are computed. Sub‑clusters exhibiting low centrality and weak connectivity are recursively re‑clustered using the KNN approach, yielding finer‑grained groups. This hybrid method proves especially effective in steep terrain and urban‑rural interfaces, where small but meaningful activity pockets would otherwise be lost. Quality metrics confirm the benefit: the average Silhouette Score improves from 0.42 to 0.48 (≈14 % increase) and the Davies‑Bouldin Index drops from 0.73 to 0.61 (≈16 % reduction) compared with plain DBSCAN.
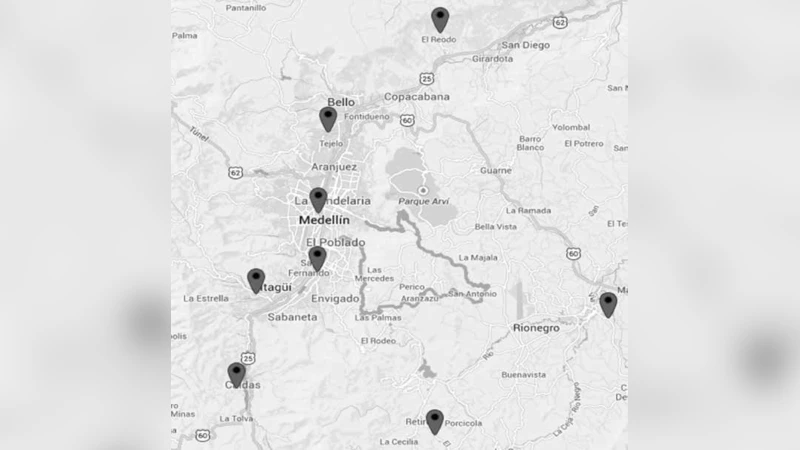
After clustering, each group is characterized by its centroid (latitude/longitude) and coverage radius (maximum distance from the centroid). The authors then map demographic attributes—age, gender, language, and active time slots—from user profiles onto the clusters, enabling a nuanced population segmentation. Keyword‑based topic labeling is performed via TF‑IDF weighting; the top five terms per cluster become automatic labels such as “hiking,” “nature photography,” “cultural event,” or “local cuisine.” For instance, a high‑density cluster in Aburra Valley is dominated by male users aged 20‑35 who post mainly between 16:00 and 20:00, with keywords indicating outdoor recreation.
A key contribution is the development of a web‑based application that automates the entire workflow. End‑users specify a region (center coordinates and radius) and a set of interest keywords; the backend then triggers data collection, preprocessing, DBSCAN + KNN clustering, and finally renders interactive maps and analytical dashboards. The system follows a micro‑service architecture, with each functional component containerized via Docker and orchestrated by Kubernetes for scalability. Results are exposed through a RESTful API and visualized with a React/D3.js front‑end, allowing organizations to retrieve actionable insights without deep technical expertise.
In conclusion, the study demonstrates that combining density‑based clustering with a KNN‑driven refinement step yields superior spatial segmentation of social media activity, outperforming traditional DBSCAN in both cluster purity and interpretability. The framework successfully uncovers meaningful micro‑clusters in both valleys, providing valuable intelligence for tourism promotion, cultural event planning, and emergency response. Future work will explore (1) hybrid streaming‑batch processing for near‑real‑time updates, (2) integration of deep learning models for spatio‑temporal prediction, and (3) expansion to additional platforms such as Instagram and Facebook to enrich the data landscape.