Mining Brain Networks using Multiple Side Views for Neurological Disorder Identification
Mining discriminative subgraph patterns from graph data has attracted great interest in recent years. It has a wide variety of applications in disease diagnosis, neuroimaging, etc. Most research on subgraph mining focuses on the graph representation …
Authors: Bokai Cao, Xiangnan Kong, Jingyuan Zhang
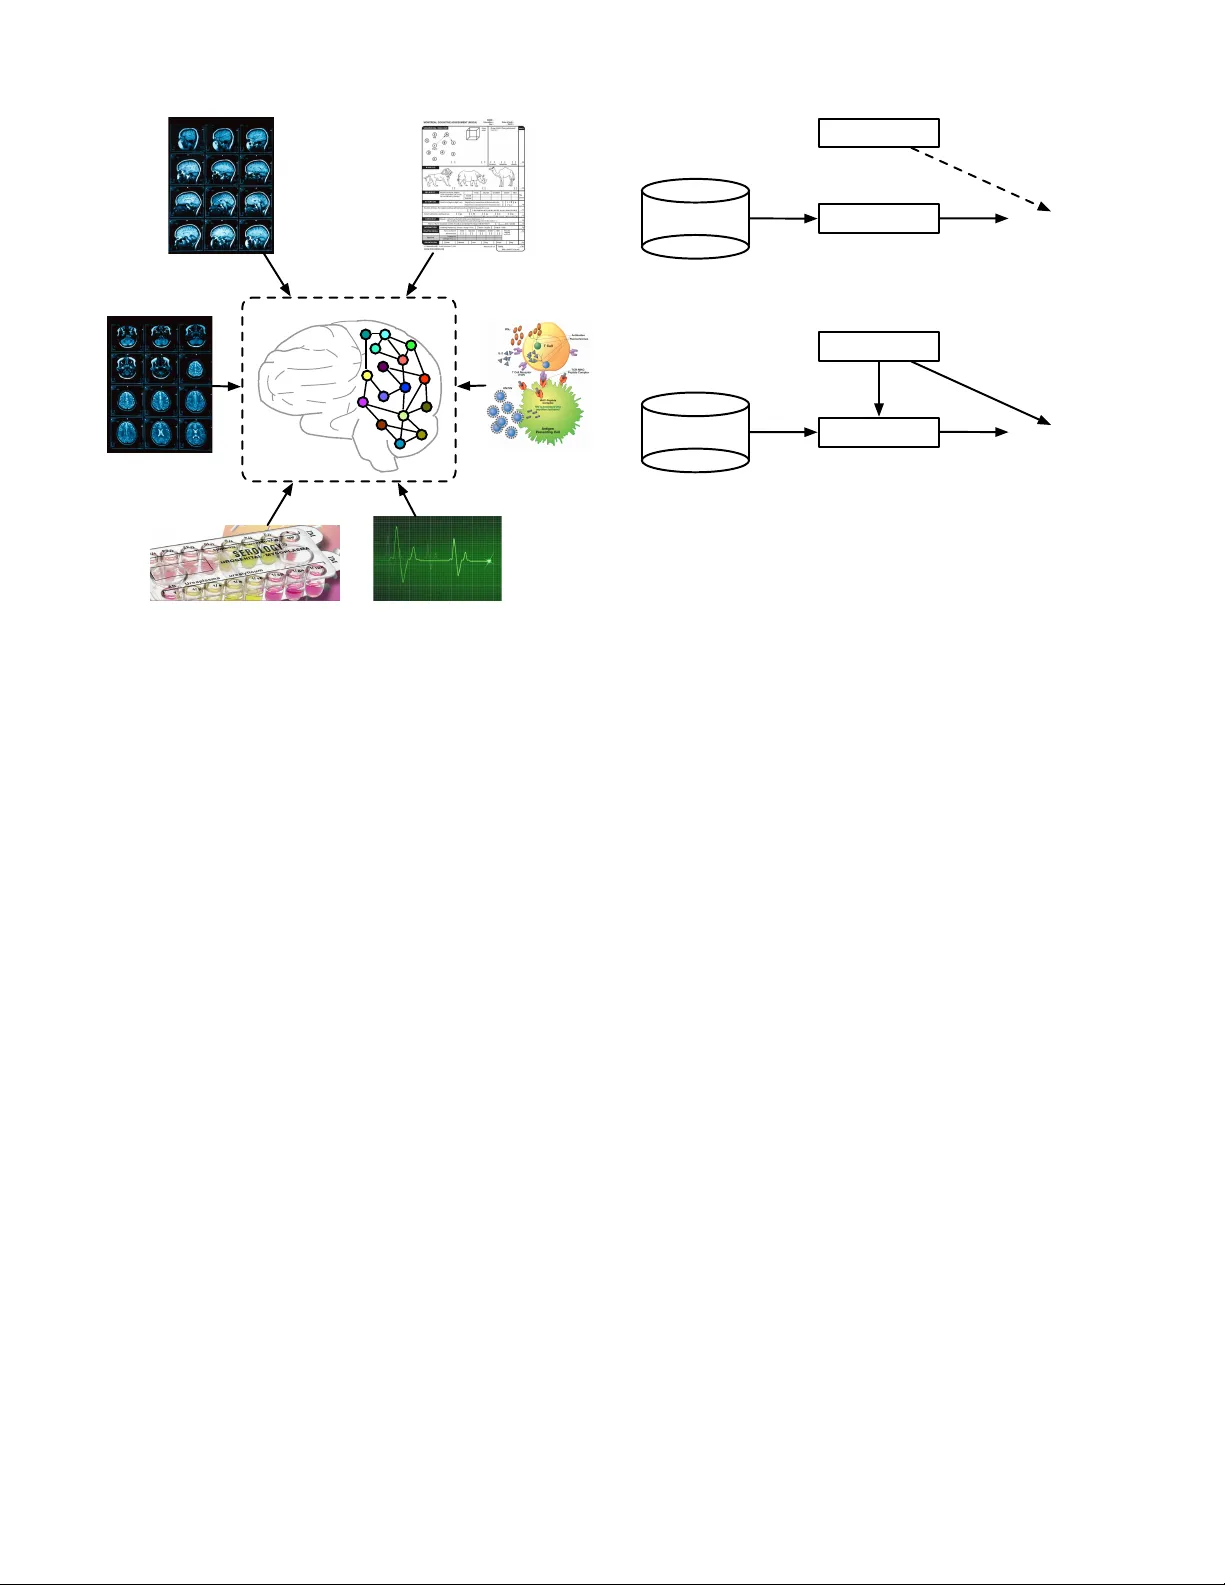
Mining Brain Networks using Multiple Side V ie ws for Neurological Disorder Identification Bokai Cao ∗ , Xiangnan K ong † , Jingyuan Zhang ∗ , Philip S. Y u ∗ ‡ and Ann B. Ragin § ∗ Department of Computer Science, Univ ersity of Illinois at Chicago, IL, USA; { caobokai, jzhan8, psyu } @uic.edu † Department of Computer Science, W orcester Polytechnic Institute, MA, USA; xk ong@wpi.edu ‡ Institute for Data Science, Tsinghua Univ ersity , Beijing, China § Department of Radiology , Northwestern Uni versity , IL, USA; ann-ragin@northwestern.edu Abstract —Mining discriminative subgraph patter ns from graph data has attracted great interest in recent years. It has a wide variety of applications in disease diagnosis, neuroimaging, etc. Most resear ch on subgraph mining focuses on the graph repr esentation alone. Howe ver , in many real-world applications, the side information is available along with the graph data. F or example, for neurological disorder identification, in addition to the brain networks derived from neuroimaging data, hundreds of clinical, immunologic, ser ologic and cognitive measures may also be documented for each subject. These measures compose mul- tiple side views encoding a tremendous amount of supplemental information f or diagnostic purposes, yet are often ignored. In this paper , we study the problem of discriminative subgraph selection using multiple side views and propose a novel solution to find an optimal set of subgraph features for graph classification by exploring a plurality of side views. W e derive a feature ev aluation criterion, named gSide, to estimate the usefulness of subgraph patterns based upon side views. Then we develop a branch-and- bound algorithm, called gMSV, to efficiently search for optimal subgraph features by integrating the subgraph mining process and the procedure of discriminative feature selection. Empirical studies on graph classification tasks for neurological disorders using brain networks demonstrate that subgraph patterns se- lected by the multi-side-view guided subgraph selection appr oach can effectively boost graph classification perf ormances and are rele vant to disease diagnosis. Index T erms —subgraph pattern, graph mining, side informa- tion, brain network. I . I N T RO D U C T I O N Recent years hav e witnessed an increasing amount of data in the form of graph representations, which in volve complex structures, e.g . , brain networks, social networks. These data are inherently represented as a set of nodes and links, instead of feature vectors as traditional data. For e xample, brain networks are composed of brain regions as the nodes, e.g. , insula , hip- pocampus , thalamus , and functional/structural connectivities between the brain regions as the links. The linkage structure in these brain networks can encode tremendous information about the mental health of the human subjects. For example, in the brain networks deriv ed from functional magnetic resonance imaging (fMRI), functional connections/links can encode the correlations between the functional activities of brain regions. While structural links in diffusion tensor imaging (DTI) brain networks can capture the number of neural fibers connecting different brain regions. The complex structures and the lack of vector representations within these graph data raise a challenge for data mining. An ef fectiv e model for mining the graph data should be able to extract a set of subgraph patterns for further analysis. Motiv ated by such challenges, graph mining research problems, in particular graph classification, hav e received considerable attention in the last decade. The graph classification problem has been studied exten- siv ely . Con ventional approaches focus on mining discrimina- tiv e subgraphs from graph view alone. This is usually feasible for applications like molecular graph analysis, where a large set of graph instances with labels are available. For brain net- work analysis, howe ver , usually we only hav e a small number of graph instances, ranging from 30 to 100 brain networks [18]. In these applications, the information from the graph view alone are usually not sufficient for mining important subgraphs. W e notice that, fortunately , the side information is av ailable along with the graph data for neurological disorder identification. For example, in neurological studies, hundreds of clinical, immunologic, serologic and cognitiv e measures may be av ailable for each subject [4], [5], in addition to brain networks deriv ed from the neuroimaging data, as shown in Figure 1. These measures compose multiple side views which contain a tremendous amount of supplemental information for diagnostic purposes. It is desirable to extract valuable information from a plurality of side views to gu ide the process of subgraph mining in brain networks. Despite its value and significance, the feature selection problem for graph data using auxiliary views has not been studied in this context so far . There are two major difficulties in learning from multiple side views for graph classification, as follows: The primary view in graph repr esentation : Graph data nat- urally composes the primary view for graph mining problems, from which we want to select discriminative subgraph patterns for graph classification. Howe ver , it raises a challenge for data mining with the complex structures and the lack of v ector representations. Con ventional feature selection approaches in vector spaces usually assume that a set of features are given before conducting feature selection. In the context of graph data, howev er, subgraph features are embedded within the graph structures and usually it is not feasible to enumerate the full set of subgraph features for a graph dataset before feature selection. Actually , the number of subgraph features grows exponentially with the size of graphs. Side view 4: clinical measures Side view 6: cognitive measures Side view 1: MRI sequence A Side view 2: MRI sequence B Side view 5: immunologic measures Side view 3: serologic measures Primary view: brain network Fig. 1. An example of multiple side views associated with brain networks in medical studies. The side views in vector representations : In many applica- tions, side information is available along with the graph data and usually exists in the form of vector representations. That is to say , an instance is represented by a graph and additional vector -based features at the same time. It introduces us to the problem of how to leverage the relationship between the primary graph view and a plurality of side views, and how to facilitate the subgraph mining procedure by exploring the vector -based auxiliary views. For example, in brain networks, discriminativ e subgraph patterns for neurological disorders indicate brain injuries associated with particular regions. Such changes can potentially express in other medical tests of the subject, e.g. , clinical, immunologic, serologic and cognitiv e measures. Thus, it would be desirable to select subgraph features that are consistent with these side views. Figure 2(a) illustrates the process of selecting subgraph patterns in con ventional graph classification approaches. Ob- viously , the valuable information embedded in side views is not fully lev eraged in feature selection process. Most subgraph mining approaches focus on the drug discovery problem which hav e access to a great amount of graph data for chemical compounds. For neurological disorder identification, howe ver , there are usually limited subjects with a small sample size of brain networks av ailable. Therefore, it is critical to learn knowledge from other possible sources. W e notice that transfer learning can borrow supervision knowledge from the source domain to help the learning on the target domain, e.g. , finding a good feature representation [9], mapping relational knowledge [23], [24], and learning across graph database [28]. Howe ver , as far as we know , they do not look at transferring Subgraph Patterns Graph Classification Side Views Brain Networks Mine (a) Con ventional methods treat side vie ws and subgraph patterns separately and may only concatenate them in the final step for graph classification. Subgraph Patterns Graph Classification Side Views Brain Networks Guide Mine (b) Our method uses side views as guidance for the process of selecting subgraph patterns. Fig. 2. T wo strategies of leveraging side views in feature selection process for graph classification. complementary information from vector-based side views to graph database whose instances are complex structural graphs. T o solve the above problems, in this paper , we introduce a nov el framework for discriminative subgraph selection using multiple side views. Our framework is illustrated in Fig- ure 2(b). In contrast to existing subgraph mining approaches that focus on a single view of the graph representation, our method can explore multiple vector -based side vie ws to find an optimal set of subgraph features for graph classification. W e first verify side information consistency via statistical hypoth- esis testing. Based on auxiliary views and the av ailable label information, we design an ev aluation criterion for subgraph features, named gSide. By deriving a lower bound, we dev elop a branch-and-bound algorithm, called gMSV, to efficiently search for optimal subgraph features with pruning, thereby av oiding exhausti ve enumeration of all subgraph features. In order to ev aluate our proposed model, we conduct experiments on graph classification tasks for neurological disorders, using fMRI and DTI brain networks. The experiments demonstrate that our subgraph selection approach using multiple side views can effecti vely boost graph classification performances. Moreov er , we show that gMSV is more efficient by pruning the subgraph search space via gSide. I I . P RO B L E M F O R M U L A T I O N Before presenting the subgraph feature selection model, we first introduce the notations that will be used throughout this paper . Let D = { G 1 , · · · , G n } denote the graph dataset, which consists of n graph objects. The graphs within D are labeled by [ y 1 , · · · , y n ] > , where y i ∈ {− 1 , +1 } denotes the binary class label of G i . D E FI N I T I O N 1 (Side view): A side view is a set of vector - based features z i = [ z 1 , · · · , z d ] > associated with each graph object G i , where d is the dimensionality of this view . A side view is denoted as Z = { z 1 , · · · , z n } . W e assume that there are multiple side views {Z (1) , · · · , Z ( v ) } a vailable for the graph dataset D , where v is the number of side views. W e employ kernels κ ( p ) on Z ( p ) , such that κ ( p ) ij represents the similarity between G i and G j from the perspectiv e of the p -th view . The RBF kernel is used as the default kernel in this paper , unless otherwise specified: κ ( p ) ij = exp − k z ( p ) i − z ( p ) j k 2 2 d ( p ) ! (1) D E FI N I T I O N 2 (Graph): A graph is represented as G = ( V , E ) , where V = { v 1 , · · · , v n v } is the set of vertices, E ⊆ V × V is the set of edges. D E FI N I T I O N 3 (Subgraph): Let G 0 = ( V 0 , E 0 ) and G = ( V , E ) be two graphs. G 0 is a subgraph of G (denoted as G 0 ⊆ G ) iff V 0 ⊆ V and E 0 ⊆ E . If G 0 is a subgraph of G , then G is supergraph of G 0 . In this paper, we adopt the idea of subgraph-based graph classification approaches, which assume that each graph object G j is represented as a binary vector x j = [ x 1 j , · · · , x mj ] > associated with the full set of subgraph patterns { g 1 , · · · , g m } for the graph dataset { G 1 , · · · , G n } . Here x ij ∈ { 0 , 1 } is the binary feature of G j corresponding to the subgraph pattern g i , and x ij = 1 if f g i is a subgraph of G j ( g i ⊆ G j ), otherwise x ij = 0 . Let X = [ x ij ] m × n denote the matrix consisting of binary feature vectors using S to represent the graph dataset D . X = [ x 1 , · · · , x n ] = [ f 1 , · · · , f m ] > ∈ { 0 , 1 } m × n . The full set S is usually too large to be enumerated. There is usually only a subset of subgraph patterns T ⊆ S rele v ant to the task of graph classification. W e briefly summarize the notations used in this paper in T able I. The key issue of discriminative subgraph selection using multiple side views is how to find an optimal set of subgraph patterns for graph classification by exploring the auxiliary views. This is non-trivial due to the following problems: • How to lev erage the valuable information embedded in multiple side views to ev aluate the usefulness of a set of subgraph patterns? • How to efficiently search for the optimal subgraph pat- terns without exhausti ve enumeration in the primary graph space? In the following sections, we will first introduce the op- timization frame work for selecting discriminativ e subgraph features using multiple side vie ws. Next, we will describe our subgraph mining strate gy using the e valuation criterion deri ved from the optimization solution. I I I . D A TA A N A L Y S I S A motiv ation for this work is that the side information could be strongly correlated with the health state of a subject. Before proceeding, we first introduce real-world data used in this work and in vestigate whether the av ailable information from side vie ws has any potential impact on neurological disorder identification. A. Data Collections In this paper, we study the real-world datasets collected from the Chicago Early HIV Infection Study at Northwestern Univ ersity [26]. The clinical cohort includes 56 HIV (positive) and 21 seronegati ve controls (negati ve). The datasets contain functional magnetic resonance imaging (fMRI) and diffusion tensor imaging (DTI) for each subject, from which brain networks can be constructed, respectively . For fMRI data, we used DP ARSF toolbox 1 to extract a se- quence of responds from each of the 116 anatomical volumes of interest (A V OI), where each A V OI represents a different brain region. The correlations of brain acti vities among differ - ent brain regions are computed. Positi ve correlations are used as links among brain regions. For details, functional images were realigned to the first volume, slice timing corrected, and normalized to the MNI template and spatially smoothed with an 8-mm Gaussian kernel. The linear trend of time series and temporally band-pass filtering (0.01-0.08 Hz) were remov ed. Before the correlation analysis, sev eral sources of spurious variance were also removed from the data through linear regression: (i) six parameters obtained by rigid body correction of head motion, (ii) the whole-brain signal av eraged over a fixed re gion in atlas space, (iii) signal from a ventricular region of interest, and (iv) signal from a region centered in the white matter . Each brain is represented as a graph with 90 nodes corresponding to 90 cerebral regions, excluding 26 cerebellar regions. For DTI data, we used FSL toolbox 2 to extract the brain networks. The processing pipeline consists of the following steps: (i) correct the distortions induced by eddy currents in the gradient coils and use af fine registration to a reference volume for head motion, (ii) delete non-brain tissue from the image of the whole head [29], [14], (iii) fit the diffusion tensor model at each vox el, (iv) build up distributions on diffusion parameters at each vox el, and (v) repetiti vely sample from the distrib utions of vox el-wise principal diffusion directions. As with the fMRI data, the DTI images were parcellated into 90 regions (45 for each hemisphere) by propagating the Automated Anatomical Labeling (AAL) to each image [33]. Min-max normalization was applied on link weights. In addition, for each subject, hundreds of clinical, imaging, immunologic, serologic and cogniti ve measures were docu- mented. Seven groups of measurements were in vestigated in our datasets, including neur opsychological tests , flow cytome- try , plasma luminex , freesurfer , over all brain micr ostructur e , localized brain micr ostructur e , brain volumetry . Each group can be regarded as a distinct view that partially reflects subject status, and measurements from different medical examina- tions can provide complementary information. Moreover , we preprocessed the features by min-max normalization before employing the RBF kernel on each view . 1 http://rfmri.org/DP ARSF 2 http://fsl.fmrib .ox.ac.uk/fsl/fslwiki T ABLE I I M PO RTA NT N OTA T I O NS . Symbol Definition and Description | . | cardinality of a set k . k norm of a vector D = { G 1 , · · · , G n } giv en graph dataset, G i denotes the i -th graph in the dataset y = [ y 1 , · · · , y n ] > class label vector for graphs in D , y i ∈ {− 1 , +1 } S = { g 1 , · · · , g m } set of all subgraph patterns in the graph dataset D f i = [ f i 1 , · · · , f in ] > binary vector for subgraph pattern g i , f ij = 1 iff g i ⊆ G j , otherwise f ij = 0 x j = [ x 1 j , · · · , x mj ] > binary vector for G j using subgraph patterns in S , x ij = 1 iff g i ⊆ G j , otherwise x ij = 0 X = [ x ij ] m × n matrix of all binary vectors in the dataset, X = [ x 1 , · · · , x n ] = [ f 1 , · · · , f m ] > ∈ { 0 , 1 } m × n T set of selected subgraph patterns, T ⊆ S I T ∈ { 0 , 1 } m × m diagonal matrix indicating which subgraph patterns are selected from S into T min sup minimum frequency threshold; frequent subgraphs are contained by at least min sup ×|D | graphs k number of subgraph patterns to be selected λ ( p ) weight of the p -th side view (default: 1) κ ( p ) kernel function on the p -th side view (default: RBF kernel) B. V erifying Side Information Consistency W e study the potential impact of side information on select- ing subgraph patterns via statistical hypothesis testing. Side information consistency suggests that the similarity of side view features between instances with the same label should hav e higher probability to be larger than that with different labels. W e use hypothesis testing to validate whether this statement holds in the fMRI and DTI datasets. For each side vie w , we first construct two vectors a ( p ) s and a ( p ) d with an equal number of elements, sampled from the sets A ( p ) s and A ( p ) d , respectiv ely: A ( p ) s = { κ ( p ) ij | y i y j = 1 } (2) A ( p ) d = { κ ( p ) ij | y i y j = − 1 } (3) Then, we form a two-sample one-tail t-test to validate the existence of side information consistency . W e test whether there is sufficient e vidence to support the hypothesis that the similarity score in a ( p ) s is larger than that in a ( p ) d . The null hypothesis is H 0 : µ ( p ) s − µ ( p ) d ≤ 0 , and the alternativ e hypothesis is H 1 : µ ( p ) s − µ ( p ) d > 0 , where µ ( p ) s and µ ( p ) d represent the sample means of similarity scores in the two groups, respectiv ely . T ABLE II H Y PO TH E S I S T E ST I N G R E SU LT S ( P - VAL U E S ) T O V E RI F Y S I D E I N FO R M A T I O N C O NS I S T EN C Y . Side vie ws fMRI dataset DTI dataset neur opsychological tests 1.3220e-20 3.6015e-12 flow cytometry 5.9497e-57 5.0346e-75 plasma luminex 9.8102e-06 7.6090e-06 fr eesurfer 2.9823e-06 1.5116e-03 overall brain micr ostructur e 1.0403e-02 8.1027e-03 localized brain micr ostructur e 3.1108e-04 5.7040e-04 brain volumetry 2.0024e-04 1.2660e-02 The t-test results, p-values, are summarized in T able II. The results show that there is strong evidence, with significance lev el α = 0 . 05 , to reject the null hypothesis on the two datasets. In other words, we v alidate the existence of side information consistency in neurological disorder identification, thereby paving the way for our next study of leveraging multiple side views for discriminativ e subgraph selection. I V . M U LT I - S I D E - V I E W D I S C R I M I N A T I V E S U B G R A P H S E L E C T I O N In this section, we address the first problem discussed in Section II by formulating the discriminati ve subgraph selection problem as a general optimization framew ork as follows: T ∗ = argmin T ⊆S F ( T ) s.t. |T | ≤ k (4) where |·| denotes the cardinality and k is the maximum number of feature selected. F ( T ) is the e valuation criterion to estimate the score (can be the lower the better in this paper) of a subset of subgraph patterns T . T ∗ denotes the optimal set of subgraph patterns T ∗ ⊆ S . A. Exploring Multiple Side V iews: gSide Follo wing the observations in Section III-B that the side view information is clearly correlated with the prespecified label information, we assume that the set of optimal sub- graph patterns should ha ve the following properties. The similarity/distance between instances in the space of subgraph features should be consistent with that in the space of a side view . That is to say , if two instances are similar in the space of the p -th view ( i.e. , a high κ ( p ) ij value), the y should also be close to each other in the space of subgraph features ( i.e. , a small distance between subgraph feature vectors). On the other hand, if two instances are dissimilar in the space of the p -th view ( i.e. , a low κ ( p ) ij value), they should be far away from each other in the space of subgraph features ( i.e. , a large distance between subgraph feature vectors). Therefore, our objectiv e function could be to minimize the distance between subgraph features of each pair of similar instances in each side view , and maximize the distance between dissimilar instances. This idea is formulated as follows: argmin T ⊆S 1 2 v X p =1 λ ( p ) n X i,j =1 kI T x i − I T x j k 2 2 Θ ( p ) ij (5) where I T is a diagonal matrix indicating which subgraph features are selected into T from S , ( I T ) ii = 1 iff g i ∈ T , otherwise ( I T ) ii = 0 . The parameters λ ( p ) ≥ 0 are employed to control the contributions from each view . Θ ( p ) ij = ( 1 |H ( p ) | ( i, j ) ∈ H ( p ) − 1 |L ( p ) | ( i, j ) ∈ L ( p ) (6) where H ( p ) = { ( i, j ) | κ ( p ) ij ≥ µ ( p ) } , L ( p ) = { ( i, j ) | κ ( p ) ij < µ ( p ) } , and µ ( p ) is the mean value of κ ( p ) ij , i.e. , 1 n 2 P n i,j =1 κ ( p ) ij . This normalization is to balance the effect of similar instances and dissimilar instances. Intuitiv ely , Eq. (5) will minimize the distance between subgraph features of similar instance-pairs with κ ( p ) ij ≥ µ ( p ) , while maximize the distance between dissimilar instance-pairs with κ ( p ) ij < µ ( p ) in each view . In this way , the side view information is effecti vely used to guide the process of discrim- inativ e subgraph selection. The fact verified in Section III-B that the side view information is clearly correlated with the prespecified label information can be very useful, especially in the semi-supervised setting. W ith prespecified information for labeled graphs, we further consider that the optimal set of subgraph patterns should satisfy the following constraints: labeled graphs in the same class should be close to each other; labeled graphs in dif ferent classes should be far away from each other . Intuitiv ely , these constraints tend to select the most discriminati ve subgraph patterns based on the graph labels. Such an idea has been well explored in the context of dimensionality reduction and feature selection [2], [31]. The constraints abov e can be mathematically formulated as minimizing the loss function: argmin T ⊆S 1 2 n X i,j =1 kI T x i − I T x j k 2 2 Ω ij (7) where Ω ij = 1 |M| ( i, j ) ∈ M − 1 |C | ( i, j ) ∈ C 0 otherwise (8) and M = { ( i, j ) | y i y j = 1 } denotes the set of pairwise constraints between graphs with the same label, and C = { ( i, j ) | y i y j = − 1 } denotes the set of pairwise constraints between graphs with different labels. By defining matrix Φ ∈ R n × n as Φ ij = Ω ij + v X p =1 λ ( p ) Θ ( p ) ij (9) we can combine and rewrite the function in Eq. (5) and Eq. (7) as F ( T ) = 1 2 n X i =1 n X j =1 kI T x i − I T x j k 2 2 Φ ij = tr ( I > T X ( D − Φ) X > I T ) = tr ( I > T X LX > I T ) = X g i ∈T f > i L f i (10) where tr ( · ) is the trace of a matrix, D is a diagonal matrix whose entries are column sums of Φ , i.e. , D ii = P j Φ ij , and L = D − Φ is a Laplacian matrix. D E FI N I T I O N 4 (gSide): Let D = { G 1 , · · · , G n } denote a graph dataset with multiple side views. Suppose Φ is a matrix defined as Eq. (9), and L is a Laplacian matrix defined as L = D − Φ , where D is a diagonal matrix, D ii = P j Φ ij . W e define an ev aluation criterion q , called gSide, for a subgraph pattern g i as q ( g i ) = f > i L f i (11) where f i = [ f i 1 , · · · , f in ] > ∈ { 0 , 1 } n is the indicator vector for subgraph pattern g i , f ij = 1 iff g i ⊆ G j , otherwise f ij = 0 . Since the Laplacian matrix L is positiv e semi-definite, for any subgraph pattern g i , q ( g i ) ≥ 0 . Based on gSide as defined above, the optimization problem in Eq. (4) can be written as T ∗ = argmin T ⊆S X g i ∈T q ( g i ) s.t. |T | ≤ k (12) The optimal solution to the problem in Eq. (12) can be found by using gSide to conduct feature selection on a set of subgraph patterns in S . Suppose the gSide v alues for all subgraph patterns are denoted as q ( g 1 ) ≤ · · · ≤ q ( g m ) in sorted order , then the optimal solution to the optimization problem in Eq. (12) is T ∗ = k ∪ i =1 { g i } (13) B. Sear ching with A Lower Bound: gMSV Now we address the second problem discussed in Section II, and propose an efficient method to find the optimal set of subgraph patterns from a graph dataset with multiple side views. A straightforward solution to the goal of finding an optimal feature set is the exhausti ve enumeration, i.e. , we could first enumerate all subgraph patterns from a graph dataset, and then calculate the gSide v alues for all subgraph patterns. In the context of graph data, ho wev er, it is usually not feasible to enumerate the full set of subgraph patterns before feature selection. Actually , the number of subgraph patterns gro ws exponentially with the size of graphs. Inspired by recent advances in graph classification approaches [6], [19], [20], [36], which nest their e valuation criteria into the subgraph mining process and dev elop constraints to prune the search space, we adopt a similar approach by deri ving a dif ferent constraint based upon gSide. By adopting the gSpan algorithm proposed by Y an and Han [37], we can enumerate all the subgraph patterns for a graph dataset in a canonical search space. In order to prune the subgraph search space, we now derive a lower bound of the gSide value: T H E O R E M 1: Giv en any two subgraph patterns g i , g j ∈ S , g j is a supergraph of g i , i.e. , g i ⊆ g j . The gSide value of g j is bounded by ˆ q ( g i ) , i.e. , q ( g j ) ≥ ˆ q ( g i ) . ˆ q ( g i ) is defined as ˆ q ( g i ) , f > i ˆ L f i (14) where the matrix ˆ L is defined as ˆ L pq , min(0 , L pq ) . P RO O F . According to Definition 4, q ( g j ) = f > j L f j = X p,q : G p ,G q ∈G ( g j ) L pq (15) where G ( g j ) , { G k | g j ⊆ G k , 1 ≤ k ≤ n } . Since g i ⊆ g j , according to anti-monotonic property , we hav e G ( g j ) ⊆ G ( g i ) . Also ˆ L pq , min(0 , L pq ) , we have ˆ L pq ≤ L pq and ˆ L pq ≤ 0 . Therefore, q ( g j ) = X p,q : G p ,G q ∈G ( g j ) L pq ≥ X p,q : G p ,G q ∈G ( g j ) ˆ L pq ≥ X p,q : G p ,G q ∈G ( g i ) ˆ L pq = ˆ q ( g i ) (16) Thus, for any g i ⊆ g j , q ( g j ) ≥ ˆ q ( g i ) . Algorithm 1 The Proposed Method: gMSV Input: D , min sup, k , { λ ( p ) , κ ( p ) } v p =1 Output: T : Set of optimal subgraph patterns 1: T = ∅ , θ = I nf 2: while unexplored nodes in the DFS code tree 6 = ∅ do 3: g = currently explored node in the DFS code tree 4: if f req ( g ) ≥ min sup then 5: if |T | < k or q ( g ) < θ then 6: T = T ∪ { g } 7: if |T | > k then 8: g max = argmax g 0 ∈T q ( g 0 ) 9: T = T / { g max } 10: end if 11: θ = max g 0 ∈T q ( g 0 ) 12: end if 13: if ˆ q ( g ) < θ then 14: Depth-first search the subtree rooted from g 15: end if 16: end if 17: end while 18: return T W e can now nest the lower bound into the subgraph mining steps in gSpan to efficiently prune the DFS code tree. During the depth-first search through the DFS code tree, we always maintain the currently top- k best subgraph patterns according to gSide and the temporally suboptimal gSide value (denoted by θ ) among all the gSide values calculated before. If ˆ q ( g i ) ≥ θ , the gSide value of any supergraph g j of g i should be no less than ˆ q ( g i ) according to Theorem 1, i.e. , q ( g j ) ≥ ˆ q ( g i ) ≥ θ . Thus, we can safely prune the subtree rooted from g i in the search space. If ˆ q ( g i ) < θ , we cannot prune this subtree since there might exist a supergraph g j of g i such that q ( g j ) < θ . As long as a subgraph g i can improve the gSide values of any subgraphs in T , it is added into T and the least best subgraph is removed from T . Then we recursively search for the next subgraph in the DFS code tree. The branch-and-bound algorithm gMSV is summarized in Algorithm 1. V . E X P E R I M E N T S In order to ev aluate the performance of the proposed solu- tion to the problem of feature selection for graph classification using multiple side views, we tested our algorithm on brain network datasets deriv ed from neuroimaging, as introduced in Section III-A. A. Experimental Setup T o the best of our knowledge, this paper is the first work on leveraging side information in feature selection problem for graph classification. In order to ev aluate the performance of the proposed method, we compare our method with other methods using different statistical measures and discriminative score functions. For all the compared methods, gSpan [37] is used as the underlying searching strategy . Note that although alternativ e algorithms are av ailable [36], [16], [17], the search step ef ficiency is not the focus of this paper . The compared methods are summarized as follows: • gMSV: The proposed discriminative subgraph selection method using multiple side views. Follo wing the observa- tion in Section III-B that side information consistency is verified to be significant in all the side views, the parame- ters in gMSV are simply set to λ (1) = · · · = λ ( v ) = 1 for experimental purposes. In the case where some side vie ws are suspect to be redundant, we can adopt the alternativ e optimization strategy to iteratively select discriminativ e subgraph patterns and update view weights. • gSSC: A semi-supervised feature selection method for graph classification based upon both labeled and unla- beled graphs. The parameters in gSSC are set to α = β = 1 unless otherwise specified [20]. • Discriminative Subgraphs (Conf, Ratio, Gtest, HSIC): Supervised feature selection methods for graph classifi- cation based upon confidence [11], frequency ratio [15], [17], [16], G-test score [36] and HSIC [19], respectiv ely . The top-k discriminative subgraph features are selected in terms of different discrimination criteria. • Frequent Subgraphs (Freq): In this approach, the ev al- uation criterion for subgraph feature selection is based upon frequency . The top-k frequent subgraph features are selected. W e append the side view data to the subgraph-based graph representations computed by the abov e algorithms before feed- ing the concatenated feature vectors to the classifier . Another baseline that only uses side view data is denoted as MSV. For a fair comparison, we used LibSVM [8] with linear kernel as the base classifier for all the compared methods. In the experiments, 3-fold cross v alidations were performed on balanced datasets. T o get the binary links, we performed sim- ple thresholding over the weights of the links. The thr eshold for fMRI and DTI datasets was 0.9 and 0.3, respectively . B. P erformance on Graph Classification The experimental results on fMRI and DTI datasets are shown in Figure 3 and Figure 4, respecti vely . The average performances with dif ferent number of features of each method are reported. Classification accuracy is used as the ev aluation metric. In Figure 3, our method gMSV can achie ve the classification accuracy as high as 97.16% on the fMRI dataset, which is significantly better than the union of other subgraph-based features and side view features. The black solid line denotes the method MSV, the simplest baseline that uses only side view data. Conf and Ratio can do slightly better than MSV. Freq adopts an unsupervised process for selecting subgraph patterns, resulting in a comparable performance with MSV, indicating that there is no additional information from the selected subgraphs. Other methods that use different discrimi- nation scores without lev eraging the guidance from side views perform even worse than MSV in graph classification, because they ev aluate the usefulness of subgraph patterns solely based on the limited label information from a small sample size of brain networks. The selected subgraph patterns can poten- tially be redundant or irrele vant, thereby compromising the effects of side view data. Importantly , gMSV outperforms the semi-supervised approach gSSC which explores the unlabeled graphs based on the separability property . This indicates that rather than simply considering that unlabeled graphs should be separated from each other , it would be better to regularize such separability/closeness to be consistent with the av ailable side views. Similar observations can be found in Figure 4, where gMSV outperforms other baselines by achie ving a good performance as high as 97.33% accuracy on the DTI dataset. W e notice that only gMSV is able to do better than MSV by adding com- plementary subgraph-based features to the side view features. Moreov er , the performances of other schemes are not consis- tent ov er the two datasets. The 2nd and 3rd best schemes, Conf and Ratio, for fMRI do not perform as well for DTI. These results support our premise that exploring a plurality of side views can boost the performance of graph classification, and the gSide e valuation criterion in gMSV can find more informativ e subgraph patterns for graph classification than subgraphs based on frequency or other discrimination scores. C. T ime and Space Complexity Next, we ev aluate the effecti veness of pruning the subgraph search space by adopting the lower bound of gSide in gMSV. In this section, we compare the runtime performance of two implementation v ersions of gMSV: the pruning gMSV uses the lower bound of gSide to prune the search space of subgraph 50 55 60 65 70 75 80 85 90 95 100 0.88 0.89 0.9 0.91 0.92 0.93 0.94 0.95 0.96 0.97 0.98 Number of selected features Accuracy gMSV gSSC Freq Conf Ratio Gtest HSIC MSV Fig. 3. Classification performance on the fMRI dataset with different number of features. 50 55 60 65 70 75 80 85 90 95 100 0.82 0.84 0.86 0.88 0.9 0.92 0.94 0.96 0.98 1 Number of selected features Accuracy gMSV gSSC Freq Conf Ratio Gtest HSIC MSV Fig. 4. Classification performance on the DTI dataset with different number of features. enumerations, as sho wn in Algorithm 1; the unpruning gMSV denotes the method without pruning in the subgraph mining process, e.g. , deleting the line 13 in Algorithm 1. W e test both approaches and recorded the average CPU time used and the av erage number of subgraph patterns explored during the procedure of subgraph mining and feature selection. The comparisons with respect to the time complexity and the space complexity are shown in Figure 5 and Figure 6, respectiv ely . On both datasets, the unpruning gMSV needs to explore exponentially larger subgraph search space as we decrease the min sup value in the subgraph mining process. When the min sup value is too low , the subgraph enumeration step in the unpruning gMSV can run out of the memory . Howe ver , the pruning gMSV is still effecti ve and efficient when the min sup value goes to very low , because its running time and space requirement do not increase as much as the unpruning gMSV by reducing the subgraph search space via the lower bound of gSide. 4 6 8 10 12 14 16 18 20 10 0 10 1 10 2 10 3 min_sup% CPU Time Cost (se) unpruning pruning (a) fMRI dataset 12 14 16 18 20 22 24 26 10 1 10 2 10 3 min_sup% CPU Time Cost (se) unpruning pruning (b) DTI dataset Fig. 5. A verage CPU time for pruning versus unpruning with varying min sup. 4 6 8 10 12 14 16 18 20 10 4 10 5 10 6 10 7 min_sup% # Subgraphs Explored unpruning pruning (a) fMRI dataset 12 14 16 18 20 22 24 26 10 4 10 5 10 6 10 7 min_sup% # Subgraphs Explored unpruning pruning (b) DTI dataset Fig. 6. A verage number of subgraph patterns explored in the mining procedure for pruning versus unpruning with varying min sup. The focus of this paper is to in vestigate side information consistency and explore multiple side views in discriminati ve subgraph selection. As potential alternati ves to the gSpan- based branch-and-bound algorithm, we could employ other more sophisticated searching strategies with our proposed multi-side-view e valuation criterion, gSide. For example, we can replace with gSide the G-test score in LEAP [36] or the log ratio in COM [16] and GAIA [17], etc. Ho we ver , as shown in Figure 5 and Figure 6, our proposed solution with pruning, gMSV, can survi ve at min sup = 4% ; considering the limited number of subjects in medical experiments as introduced in Section III-A, gMSV is ef ficient enough for neurological disorder identification where subgraph patterns with too few supported graphs are not desired. D. Ef fects of Side V iews In this section, we first in vestigate the dif ferent contributions from different side views. T able III shows the performance of gMSV on the fMRI dataset by considering only one side view each time. In general, the best performance is achiev ed by simultaneously exploring all the side views. Specifically , we observe that the side view flow cytometry can independently provide the most informative side information for selecting discriminativ e subgraph patterns on the fMRI brain networks, which might imply that HIV brain injuries in the sense of functional connectivity are most likely to express in measure- ments from this side view . It is consistent with our finding in Section III-B that the side vie w flow cytometry is the most significantly correlated with the prespecified label information. Results on the DTI dataset are shown in T able IV. T ABLE III A V E RA G E C LA S S I FIC ATI O N P E R FO R M A NC E S O F G MS V O N T HE F M RI DAT A S E T W I T H D I FFE R E NT S I NG L E S I D E V I EW S . Side vie ws Acc. Prec. Rec. F1 neur opsychological tests 0.743 0.851 0.679 0.734 flow cytometry 0.887 0.919 0.872 0.892 plasma luminex 0.715 0.769 0.682 0.710 fr eesurfer 0.786 0.851 0.737 0.785 overall brain micr ostructur e 0.672 0.824 0.500 0.618 localized brain micr ostructur e 0.628 0.686 0.605 0.637 brain volumetry 0.701 0.739 0.737 0.731 All side views 0.972 1.000 0.949 0.973 T ABLE IV A V E RA G E C LA S S I FIC ATI O N P E R FO R M A NC E S O F G MS V O N T HE D T I DAT A S E T W I T H D I FFE R E NT S I NG L E S I D E V I EW S . Side vie ws Acc. Prec. Rec. F1 neur opsychological tests 0.616 0.630 0.705 0.662 flow cytometry 0.815 0.847 0.808 0.822 plasma luminex 0.736 0.801 0.705 0.744 fr eesurfer 0.631 0.664 0.632 0.644 overall brain micr ostructur e 0.604 0.626 0.679 0.647 localized brain micr ostructur e 0.723 0.717 0.775 0.741 brain volumetry 0.605 0.616 0.679 0.644 All side views 0.973 1.000 0.951 0.974 E. F eatur e Evaluation Figure 7 and Figure 8 display the most discriminativ e subgraph patterns selected by gMSV from the fMRI dataset and the DTI dataset, respectively . These findings examining functional and structural networks are consistent with other in viv o studies [7], [34] and with the pattern of brain injury at autopsy [10], [22] in HIV infection. With the approach presented in this analysis, alterations in the brain can be detected in initial stages of injury and in the context of clini- cally meaningful information, such as host immune status and immune response ( flow cytometry ), immune mediators ( plasma luminex ) and cognitive function ( neur opsychological tests ). This approach optimizes the v aluable information inherent in complex clinical datasets. Strategies for combining v ari- ous sources of clinical information have promising potential for informing an understanding of disease mechanisms, for identification of ne w therapeutic targets and for discov ery of biomarkers to assess risk and to e valuate response to treatment. V I . R E L A T E D W O R K T o the best of our knowledge, this paper is the first work exploring side information in the task of subgraph feature selection for graph classification. Our work is related to subgraph mining techniques and multi-view feature selection problems. W e briefly discuss both of them. Mining subgraph patterns from graph data has been stud- ied e xtensiv ely by many researchers. In general, a v ariety of filtering criteria are proposed. A typical ev aluation cri- terion is frequenc y , which aims at searching for frequently Occipital_Sup_L Occipital_Sup_R (a) Lingual_L Lingual_R Calcarine_L Calcarine_R (b) Fig. 7. Discriminativ e subgraph patterns that are associated with HIV , selected from the fMRI dataset. Cingulum_Post_L Cingulum_Post_R Precuneus_L Precuneus_R (a) Hippocampus_L ParaHippocampus_L (b) Fig. 8. Discriminativ e subgraph patterns that are associated with HIV , selected from the DTI dataset. appearing subgraph features in a graph dataset satisfying a prespecified min sup value. Most of the frequent subgraph mining approaches are unsupervised. For example, Y an and Han de veloped a depth-first search algorithm: gSpan [37]. This algorithm builds a lexicographic order among graphs, and maps each graph to an unique minimum DFS code as its canonical label. Based on this lexicographic order , gSpan adopts the depth-first search strategy to mine frequent connected subgraphs efficiently . Many other approaches for frequent subgraph mining hav e also been proposed, e.g . , AGM [13], FSG [21], MoFa [3], FFSM [12], and Gaston [25]. Moreov er , the problem of supervised subgraph mining has been studied in recent work which examines how to improv e the ef ficiency of searching the discriminati ve subgraph patterns for graph classification. Y an et al. introduced two concepts structural leap sear ch and frequency-descending mining , and proposed LEAP [36] which is one of the first work in discriminativ e subgraph mining. Thoma et al. proposed CORK which can yield a near-optimal solution using greedy feature selection [32]. Ranu and Singh proposed a scalable approach, called GraphSig, that is capable of mining discriminative sub- graphs with a low frequency threshold [27]. Jin et al. proposed COM which takes into account the co-occurences of subgraph patterns, thereby facilitating the mining process [16]. Jin et al. further proposed an e volutionary computation method, called GAIA, to mine discriminative subgraph patterns using a ran- domized searching strategy [17]. Our proposed criterion gSide can be combined with these ef ficient searching algorithms to speed up the process of mining discriminativ e subgraph patterns by substituting the G-test score in LEAP [36] or the log ratio in COM [16] and GAIA [17], etc. Zhu et al. designed a div ersified discrimination score based on the log ratio which can reduce the ov erlap between selected features by considering the embedding ov erlaps in the graphs [38]. Similar idea can be integrated into gSide to improve feature div ersity . There are some recent works on incorporating multi-view learning and feature selection. T ang et al. studied unsupervised multi-view feature selection by constraining that similar data instances from each view should ha ve similar pseudo-class labels [30]. Cao et al. e xplored tensor product to bring dif ferent views together in a joint space and presents a dual method of tensor-based multi-view feature selection [4]. Aggarwal et al. considered side information for text mining [1]. Ho wev er, these methods are limited in requiring a set of candidate features as input, and therefore are not directly applicable for graph data. W u et al. considered the scenario where one object can be described by multiple graphs generated from different feature views and proposes an ev aluation criterion to estimate the discriminative power and the redundancy of subgraph features across all views [35]. In contrast, in this paper , we assume that one object can have other data representations of side views in addition to the primary graph view . In the context of graph data, the subgraph features are embedded within the complex graph structures and usually it is not feasible to enumerate the full set of features for a graph dataset before the feature selection. Actually , the number of subgraph features grows exponentially with the size of graphs. In this paper , we explore the side information from multiple views to effecti vely facilitate the procedure of discriminativ e subgraph mining. Our proposed feature selection for graph data is integrated to the subgraph mining process, which can efficiently prune the search space, thereby av oiding exhaustiv e enumeration of all subgraph features. V I I . C O N C L U S I O N A N D F U T U R E W O R K W e presented an approach for selecting discriminati ve sub- graph features using multiple side vie ws. This has impor - tant applications in neurological disorder diagnosis via brain networks. W e show in this paper that by lev eraging the information from multiple side views that are av ailable along with the graph data, the proposed method gMSV can achieve very good performance on the problem of feature selection for graph classification, and the selected subgraph patterns are relev ant to disease diagnosis. A potential extension to our method is to combine fMRI and DTI brain networks to find discriminativ e subgraph patterns in the sense of both functional and structural connections. Other extensions include better exploring weighted links in the multi-side-view setting. It is also interesting to hav e our model applied to other domains where one can find graph data and side information aligned with the graph. For example, in bioinformatics, chemical compounds can be represented by graphs based on their inherent molecular structures and are associated with properties such as drug repositioning, side effects, ontology annotations. Lev eraging all these information to find out discriminati ve subgraph patterns can be transfor- mativ e for drug discovery . V I I I . A C K N O W L E D G E M E N T S This work is supported in part by NSF through grants III-1526499, CNS-1115234, and OISE-1129076, Google Re- search A ward, the Pinnacle Lab at Singapore Management Univ ersity , and NIH through grant R01-MH080636. R E F E R E N C E S [1] Charu C Aggarwal, Y uchen Zhao, and Philip S Y u. On the use of side information for mining text data. TKDE , pages 1–1, 2012. [2] Aharon Bar-Hillel, T omer Hertz, Noam Shental, and Daphna W einshall. Learning a mahalanobis metric from equiv alence constraints. Journal of Machine Learning Research , 6(6):937–965, 2005. [3] Christian Borgelt and Michael R Berthold. Mining molecular fragments: Finding relev ant substructures of molecules. In ICDM , pages 51–58. IEEE, 2002. [4] Bokai Cao, Lifang He, Xiangnan K ong, Philip S Y u, Zhifeng Hao, and Ann B Ragin. T ensor-based multi-view feature selection with applications to brain diseases. In ICDM , pages 40–49. IEEE, 2014. [5] Bokai Cao, Xiangnan Kong, Case y Kettering, Philip S. Y u, and Ann B. Ragin. Determinants of HIV-induced brain changes in three different periods of the early clinical course: A data mining analysis. Neur oImage: Clinical , 2015. [6] Bokai Cao, Liang Zhan, Xiangnan Kong, Philip S. Y u, Nathalie V izueta, Lori L. Altshuler , and Alex D. Leow . Identification of discriminativ e subgraph patterns in fMRI brain networks in bipolar affectiv e disorder . In Brain Informatics and Health . Springer, 2015. [7] JMB Castelo, SJ Sherman, MG Courtney , RJ Melrose, and CE Stern. Al- tered hippocampal-prefrontal acti vation in HIV patients during episodic memory encoding. Neur ology , 66(11):1688–1695, 2006. [8] Chih-Chung Chang and Chih-Jen Lin. LIBSVM: a library for support vector machines , 2001. Software av ailable at http://www .csie.ntu.edu. tw/ ∼ cjlin/libsvm. [9] W enyuan Dai, Gui-Rong Xue, Qiang Y ang, and Y ong Y u. Co-clustering based classification for out-of-domain documents. In KDD , pages 210– 219. ACM, 2007. [10] Ian Paul Everall, Philip J Luthert, and Peter L Lantos. Neuronal number and volume alterations in the neocortex of hiv infected individuals. Journal of Neur ology , Neurosur gery & Psychiatry , 56(5):481–486, 1993. [11] Chuancong Gao and Jianyong W ang. Direct mining of discriminative patterns for classifying uncertain data. In KDD , pages 861–870. ACM, 2010. [12] Jun Huan, W ei W ang, and Jan Prins. Ef ficient mining of frequent subgraphs in the presence of isomorphism. In ICDM , pages 549–552. IEEE, 2003. [13] Akihiro Inokuchi, T akashi W ashio, and Hiroshi Motoda. An apriori- based algorithm for mining frequent substructures from graph data. In Principles of Data Mining and Knowledge Discovery , pages 13–23. Springer , 2000. [14] Mark Jenkinson, Mickael Pechaud, and Stephen Smith. BET2: MR- based estimation of brain, skull and scalp surfaces. In Eleventh annual meeting of the organization for human brain mapping , volume 17, 2005. [15] Ning Jin and W ei W ang. L TS: Discriminative subgraph mining by learning from search history . In ICDE , pages 207–218. IEEE, 2011. [16] Ning Jin, Calvin Y oung, and W ei W ang. Graph classification based on pattern co-occurrence. In CIKM , pages 573–582. ACM, 2009. [17] Ning Jin, Calvin Y oung, and W ei W ang. GAIA: graph classification using ev olutionary computation. In SIGMOD , pages 879–890. ACM, 2010. [18] Xiangnan Kong, Ann B Ragin, Xue W ang, and Philip S Y u. Discrimina- tiv e feature selection for uncertain graph classification. In SDM , pages 82–93. SIAM, 2013. [19] Xiangnan Kong and Philip S Y u. Multi-label feature selection for graph classification. In ICDM , pages 274–283. IEEE, 2010. [20] Xiangnan K ong and Philip S Y u. Semi-supervised feature selection for graph classification. In KDD , pages 793–802. ACM, 2010. [21] Michihiro Kuramochi and George Karypis. Frequent subgraph discovery . In ICDM , pages 313–320. IEEE, 2001. [22] TD Langford, SL Letendre, GJ Larrea, and E Masliah. Changing patterns in the neuropathogenesis of hiv during the haart era. Brain pathology , 13(2):195–210, 2003. [23] Lilyana Mihalkov a, Tuyen Huynh, and Raymond J Mooney . Mapping and revising markov logic networks for transfer learning. In AAAI , volume 7, pages 608–614, 2007. [24] Lilyana Mihalkov a and Raymond J Mooney . Transfer learning from minimal target data by mapping across relational domains. In IJCAI , volume 9, pages 1163–1168, 2009. [25] Siegfried Nijssen and Joost N Kok. A quickstart in frequent structure mining can make a difference. In KDD , pages 647–652. ACM, 2004. [26] Ann B Ragin, Hongyan Du, Renee Ochs, Y ing W u, Christina L Sammet, Alfred Shoukry , and Leon G Epstein. Structural brain alterations can be detected early in HIV infection. Neur ology , 79(24):2328–2334, 2012. [27] Sayan Ranu and Ambuj K Singh. Graphsig: A scalable approach to mining significant subgraphs in large graph databases. In ICDE , pages 844–855. IEEE, 2009. [28] Xiaoxiao Shi, Xiangnan Kong, and Philip S Y u. T ransfer significant subgraphs across graph databases. In SDM , pages 552–563. SIAM, 2012. [29] Stephen M Smith. Fast robust automated brain extraction. Human brain mapping , 17(3):143–155, 2002. [30] Jiliang T ang, Xia Hu, Huiji Gao, and Huan Liu. Unsupervised feature selection for multi-view data in social media. In SDM , pages 270–278. SIAM, 2013. [31] W ei T ang and Shi Zhong. Pairwise constraints-guided dimensionality reduction. In SDM W orkshop on F eature Selection for Data Mining , 2006. [32] Marisa Thoma, Hong Cheng, Arthur Gretton, Jiawei Han, Hans-Peter Kriegel, Alexander J Smola, Le Song, Philip S Y u, Xifeng Y an, and Karsten M Borgwardt. Near-optimal supervised feature selection among frequent subgraphs. In SDM , pages 1076–1087. SIAM, 2009. [33] Nathalie Tzourio-Mazoyer , Brigitte Landeau, Dimitri Papathanassiou, Fabrice Crivello, Olivier Etard, Nicolas Delcroix, Bernard Mazoyer , and Marc Joliot. Automated anatomical labeling of activ ations in SPM using a macroscopic anatomical parcellation of the MNI MRI single-subject brain. Neuroima ge , 15(1):273–289, 2002. [34] Xue W ang, Paul Foryt, Renee Ochs, Jae-Hoon Chung, Y ing Wu, T odd Parrish, and Ann B Ragin. Abnormalities in resting-state functional connectivity in early human immunodeficiency virus infection. Brain connectivity , 1(3):207–217, 2011. [35] Jia W u, Zhibin Hong, Shirui Pan, Xingquan Zhu, Zhihua Cai, and Chengqi Zhang. Multi-graph-view learning for graph classification. In ICDM , pages 590–599. IEEE, 2014. [36] Xifeng Y an, Hong Cheng, Jiawei Han, and Philip S Y u. Mining significant graph patterns by leap search. In SIGMOD , pages 433–444. A CM, 2008. [37] Xifeng Y an and Jiawei Han. gspan: Graph-based substructure pattern mining. In ICDM , pages 721–724. IEEE, 2002. [38] Y uanyuan Zhu, Jeffrey Xu Y u, Hong Cheng, and Lu Qin. Graph classification: a diversified discriminative feature selection approach. In CIKM , pages 205–214. ACM, 2012.
Original Paper
Loading high-quality paper...
Comments & Academic Discussion
Loading comments...
Leave a Comment