Analysis of Buffer Starvation with Application to Objective QoE Optimization of Streaming Services
Our purpose in this paper is to characterize buffer starvations for streaming services. The buffer is modeled as an M/M/1 queue, plus the consideration of bursty arrivals. When the buffer is empty, the service restarts after a certain amount of packe…
Authors: Yuedong Xu, Eitan Altman, Rachid El-Azouzi
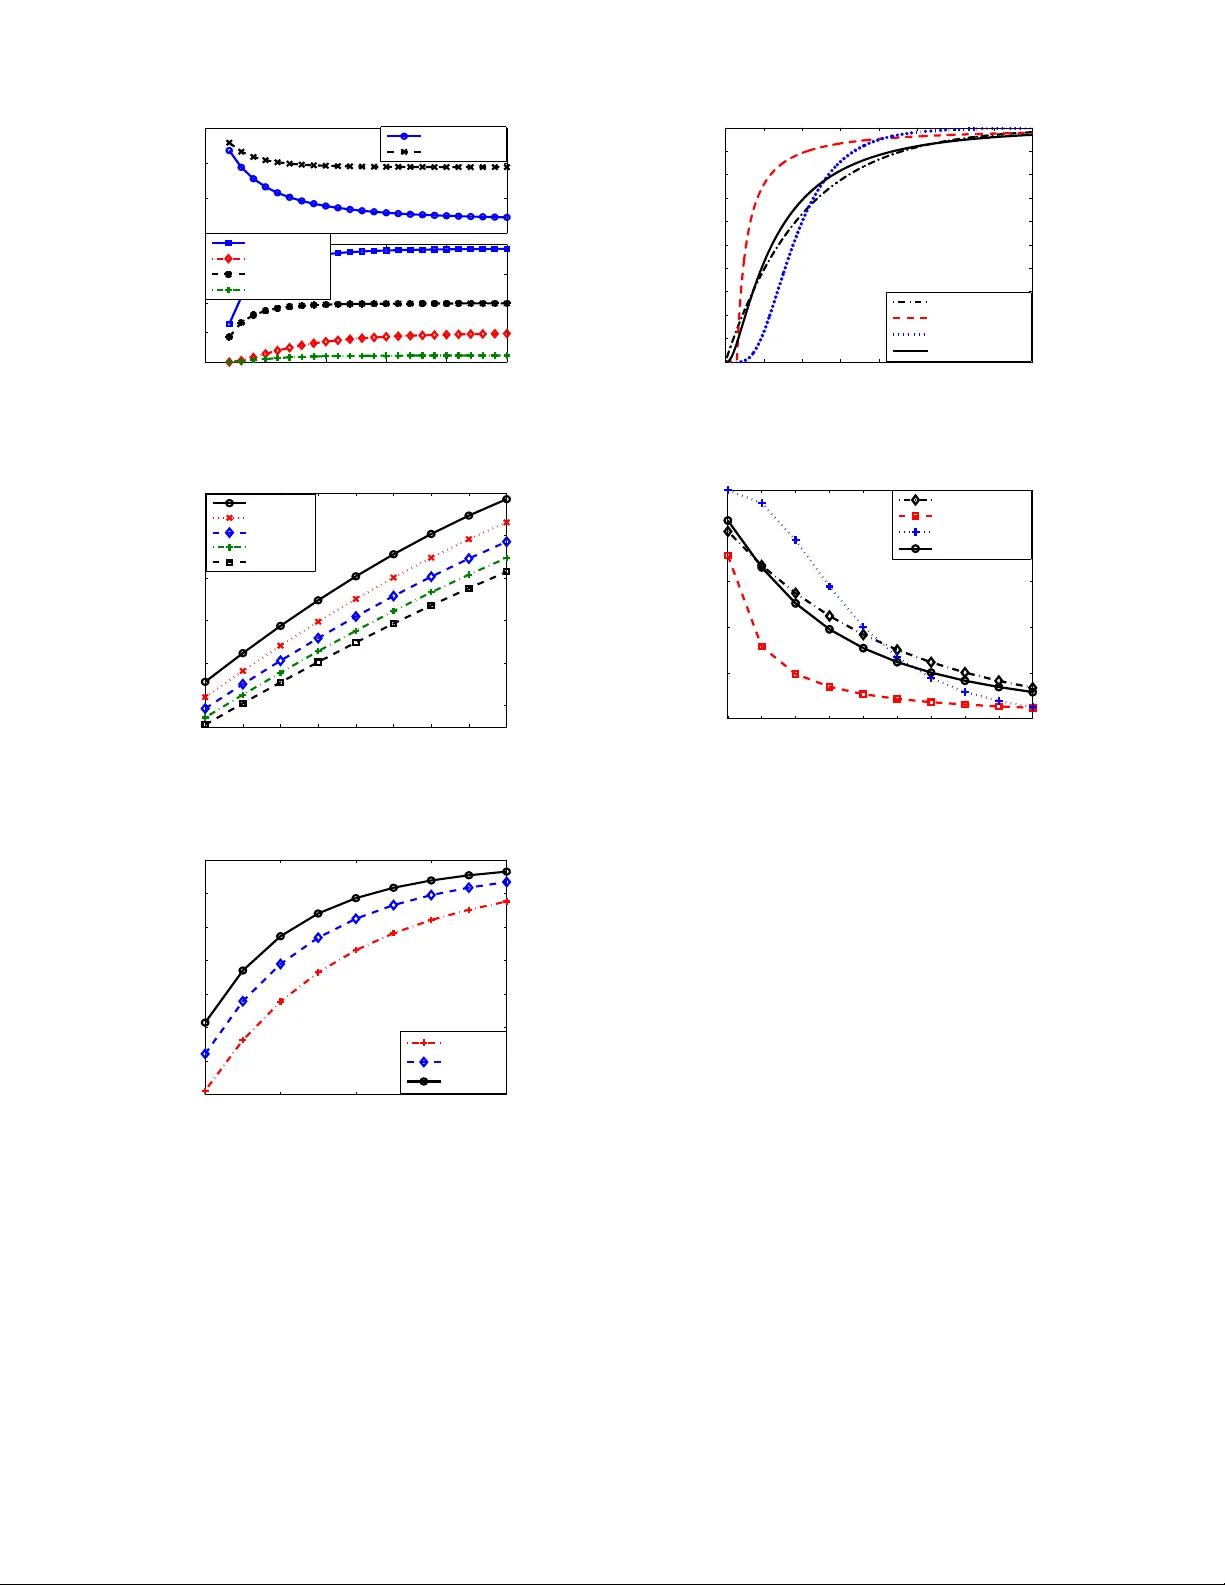
1 Analysis of Buf fer Starv ation with Applicat ion to Objecti v e QoE Optimi zation of Stre aming Services Y uedong Xu, Eitan Altman, F ellow , IEEE, Rachid El-Azouzi, Majed Ha ddad, Sa laheddine Elayou bi, and T ania Jimen ez Abstract —Our purpose in this paper is to characterize buffer starv ations fo r str eaming ser vices. The b uffer is modeled as an M/M/1 queue, plus the consideration of bursty arrivals. When the buffer is empty , th e service restarts after a certain amount of p ackets are prefetc hed . With th is goal, we propose two approaches to obtain the exact distribution of the number of buffer starva tions, one of which is based on B allot t heorem , and the other uses recursive equations. The Ballot theorem approach giv es an explici t result. W e extend t his app roach to the scenario with a constant playback rate usin g T ` akacs Ballot th eorem . The recursiv e approach, t hough not offering a n explicit result, can obtain the distribution of starvations with n on-independ ent and identi cally di stributed (i.i.d. ) arriv al process in which an ON/OFF bursty arri val process is considered in this work.W e further compute th e starv ation probability as a function of the amount of p refetched packets f or a large number of files via a fluid analysis. Among many potential applications of starvatio n analysis, we show how to apply it to optimize the objective quality of experience (QoE) of media str eaming, by exploiting the tradeoff between startup /rebuffering delay and starv ations. Index T erms —Starvation, S tart-up Delay , Quality of Experi- ence, Ballot Theorem EDICS: 8 -MSA T , 3-QA UE I . I N T R O D U C T I O N The starvation pr obability of a b uf fer is an impo rtant per- forman ce measure for proto col design of teleco mmunicatio n networks, as well as in storage systems and ecolo gical systems (e.g. d ams). S tarvation is said to o ccur wh en th e buffer is empty . V arious ap plications u se buf fering in order to con trol the rate at which packets are s erved at the destination. As long as there are packets in the b uffer , packets a rrive at the destination regularly , i.e. they are spaced b y the service tim e of the buf fer . On ce the buffer emp ties packets may arrive at the destinatio n separ ated by larger times, as the spacin g between packets now depend s also o n the in ter-arri val times at th e que ue. Star vation is in particular u ndesirable in video streaming ap plications. The time till starvation of a q ueue is r elated to the busy period wh ich h as b een we ll stud ied u nder the assum ption of a stationar y arriv al process ( see [2], [3] an d their references). In c ontrast to this assump tion, we consider a finite num ber of Part of this work appeare d in IEEE Infocom 2012. Y uedong Xu is with department of Electron ic Engineerin g, Fudan Unive r- sity , Shanghai China. E mail: ydxu@fudan.edu.cn Eitan Altman and Majed Haddad are with INRIA Sophia Antipolis, France. Email: eitan.al tman@inri a.fr and haddadma jed@yah oo.fr Rachid E l-Azouzi and and T ani a Jimenez are with Unive rsite d’A vi gnon, France. Email: rachid.elaz ouzi@un i v-avignon.fr and tania.jimenez @uni v- avi gnon.fr Salahed dine E layoubi is with Orange Labs, Paris, France. Email: salahed- dine.ela youbi@ora nge.com arriv als as we are in terested in statistics o f starvation when a file o f fixed size is transfer red. The main goal of this paper is to find the distrib ution of the n umber o f starvatio ns within a file of N packets. W e first model the buffer as an M/M/1 queue, and th en e xtend it to incorpo rate the bursty pa cket arriv al that is mod eled by an in- terrupted P oisson pr ocess (IPP) . In this system, a fixed amount of packets are pr efetched (also called “p refetching th reshold”) before th e service begins or resumes after a starvation event. In th is pap er , we main ly pro pose two ap proache s (that giv e the same result) to compu te the d istribution of the num ber of starvations fo r a single file. The first approach gives an explicit result based on the famous Ballot theorem [1]. But it is in gen eral su itable fo r indepen dent an d iden tically d istributed (i.i.d.) a rriv al process. T his mo ti vates us to p ropo se the second approa ch that yields a more flexible recu rsi ve alg orithm. Although it has no explicit result, it can be used to compute the starvation probab ilities for more complicated arriv al processes. In ter ms o f com plexity , the recursive appro ach can compute the starvation pro babilities for dif ferent combinations of the initial start-up thr eshold an d the file size in one rou nd, wh ich means an overall smaller comp lexity than the Ballot theorem approa ch. The key feature of Ballot theore m is its simple expression to compute the pr obability th at a co unting p rocess (e.g. arrival process) is strictly ahead of anothe r countin g pro cess (e.g . departur e process). Using Ballot theorem, we can compu te in a simple way th e exact distribution of the number of starvations explicitly . When the file size is large enou gh, we present the asymptotic starvation prob ability using Gau ssian (intercha nge- able with No rmal) ap proxim ation as well as an appro ximation of the Riemann integral. As a special case that the play out buf fer is mo deled b y an M/D/1 queue, the probabilities of the nu mber of starv ations can be obtain ed on the basis of a discrete version o f Ballot t heorem. Fur thermor e, un like the Ballot theor em that usually req uires the i.i.d. packet arriv als, the recursive app roach enables us to compu te the prob ability of starvations with continuo us-time ON/OF F bursty packet arriv als. Th e med ia server transfers pac kets durin g the ON state an d pauses d uring th e OFF state. It switches from on e state to the o ther after residing an exponen tially distrib uted time per iod. W e fur ther pro pose a fluid analysis of starvation b ehavior on the file level. This appro ach, instead of looking into the stochastic packet arriv als and d epartures, p redicts the starva- tion where the servers manage a large quantity of file transfers. Giv en the tra ffic intensity and the distribution of file size, we are able to com pute the starvation p robab ility as a func tion of 2 the prefetching threshold . The fluid analysis, though simp le, offers an impo rtant insight o n h ow to contr ol the p robability of starvation for many files, instead of fo r on e par ticular file. The p robabilities of starv ations developed in th is work have various ap plications in the different fields. A prom inent example is the media streaming service. T his ap plication demonstra tes a dilemm a between the pref etching p rocess an d the starvation. A longer pr efetching process causes a larger start-up/rebuffering delay , while a sho rter one might result in star vations. The user per ceiv ed media quality ( or Qo E equiv alently) is impaired by two major factors, the large start- up/rebuffering delay and the f requent starvations, accord ing to the me asurement stud ies in [27], [ 28]. Th ese two factors ar e thus defined as quality metrics of streaming service. The QoE study beco mes increasingly impo rtant in the epoch that web video ho gs up to mo re than 37% of total traffic during peak hours in USA [1 8]. In con trast to the r apid g rowth of traffic load, the band width provision usually lag s behin d. In this context, media providers and n etwork oper ators face a cruc ial challenge of main taining a satisfactory QoE of streamin g service. Wit h the results developed in this work, we are able to answer th e fun damental question : How many packets should the med ia playe r prefetc h to o ptimize the user s’ q uality of experience? T o an swer th is qu estion, we first use ob jectiv e QoE costs to model the sub jectiv e hum an un happin ess fo r bo th finite and infinite file size. An obje cti ve Qo E cost is the weighted su m function s on the start-up/rebuffering d elay an d th e star vation behaviors. The weight reflects an individual user’ s relative impatience o n the d elay th an o n the starvations. W e then formu late the objectiv e QoE optimiz ation p roblems in a va- riety of scenario s. After solving them , we obtain the optimal algorithm s to configur e the start-u p/rebuffering thresholds in packets. Lastly , we discuss the possible implementation of the prop osed algorithms. A stre aming user can dynamic ally configur e the rebuf fering thresho ld. When a starvation h ap- pens, the packet a rriv al r ate can be measured at the user side. Giv en the knowledge th e arriv al rate, service rate and the remaining file size, the user can set the rebuf fering threshold to balance the tradeoffs: i) delay vs starv ation probab ility (section VI-A) fo r a small rem aining file size and and ii) delay v s starvation inter val (section VI-B) for a large remainin g file size. The me dia server ca n config ure th e start-up thresh old for each categor y of video s (e.g. music, sports, an d TV news) b eforeh and. Given the distributions o f file size and the user thr oughp ut, it can use the algorithm in section VI-C to compute the optimal start- up threshold. Simulation stud ies in section V I dem onstrate the re lationships betwe en the objective QoE costs an d th e optimal pr efetching thresholds in a v ariety of scen arios. W e summarize the main results as follows. • W e pro pose a Ballo t theorem approach to compute the distribution of the numb er of starv ations for a file of finite size in an M/M/1 queue. It provides an explicit solution and is gener alized to an M/D/1 queue . • W e p ropose a recur si ve appro ach to com pute th e distri- bution of th e numb er o f starvations. W e fu rther extend it to the ON/OFF bursty arriv al proc ess. • W e present a fluid mode l to c ompute the starvation probab ility , g iv en the star t-up threshold and the file size distributions o f rep resentative conten t types. • Ou r study provid es the importan t un derstandin gs on how the starvation pr obabilities are impacted by the pref etch- ing threshold. W e p ropose a set of strategies to co nfigure better pr efetching thresho lds so as to balan ce the tr adeoff between the d elay and the starvations for video stream ing services. The rest of this paper is organized as f ollows. Sec tion II revie ws the related work. W e prop ose a Ballot app roach in Section III. Section IV presents th e recursive approach for an M/M/1 queue and e xtents it to the ON/OFF bursty arriv al p rocess. Section V p erforms a fluid analysis for a large number of files. Section VI p resents the QoE metrics and their optimization issues. Our theoretical results are verified in section VII. Section VIII con cludes this paper . I I . R E L AT E D W O R K The analysis of starvation is close to that of busy p eriod in transient queu es. In [ 2], [3] a uthors solve the distrib ution of the buffer size as a func tion of time for th e M/M/1 queu e. Th e exact result is expr essed as an infinite sum of mo dified Bessel function s. The starv ation analysis of this work i s different from the transient queueing analysis in tw o aspects. First, the former aims to find the prob ability generating fu nction of starvation ev ents while not the q ueue size. Second , the former d oes not assume a stationary arriv al p rocess. Ballot theor em and recu rsiv e e quations have been used to analyze the pac ket lo ss probability in a finite b uf fer when the forward erro r-correcting tech nique is deployed. Citon et al. [9] pr opose a recu rsi ve approach that en ables the m to compute th e packet loss pro bability in a block o f consecu- ti ve packet arri vals into an M/M/1 /K queue. Based on their recursive a pproach , Altm an and Jean-Ma rie in [ 10] obtain the expressions for the multidimensio nal genera ting func tion of the packet loss probab ility . T he distribution o f message delay is given in a n extended work [11]. Dubea and Altm an in [12] analy ze the p acket loss prob ability with the consider ation of random loss in inco ming an d outgo ing lin ks. I n [14], Gurewitz et al. introduce the po werful Ballot theorem to find this probab ility within a b lock of packet arri vals into an M/M/1 /K queue. T hey consider two cases, in w hich the block size is sm aller or greater than the buffer limit. Another example of ap plying Ballot theorem to ev aluate networking system is found in [13]. Humb let et al. present a method based o n Ballot theore m to study th e per forman ce of nD/D/1 queue with periodic al ar riv als and determ inistic service time. In [16], He and Sohraby use Ballot theorem to find the stationary p robability distribution in a genera l class of discr ete time systems. Privalo v and Sohraby [ 17] study the underflow behavior of CB R tra ffic in a time-slotted queueing system. Howe ver , they do not p rovide the insigh ts of having a c ertain number of starvations. In th e application s related to our work , Stock hammer et al. [15] specify the minimum start-up delay an d the minimum buf fer size for a given vid eo stream and a de terministic 3 variable bit rate (VBR) wireless channel. Recently , [6] presents a dete rministic bound , and [7] provides a stoch astic bo und of start-up delay to avoid starvation. Auth ors in [5] model the playou t buffer as a G/G/1 queue. By using diffusion ap- proxim ation, they obtain the closed-form s tarvation probability with asymptotically large fi le size. Xu et.al [21] stud y the scheduling algorithm s for m ulticast streamin g in multicar rier wireless do wnlink. Au thors in [23] studied the QoE metrics of a per sistent video streaming in cellu lar networks. They further presented a n ew method in [24] to compu te the Qo E metrics for a c ellular network with arrivals and dep artures of streaming flows . In the application field, our paper differs from state o f the ar t works in the following w ays: i) we p resent new theor ies th at yield an exact pr obability of starvation, an d the p.g.f. o f starv atio n events; ii) we st udy the asymptotic behavior with er ror analysis; iii) we perform a macroscopic starvation analysis u sing a fluid mod el; iv) we configure optimal prefetching thre sholds to optimize the QoE metrics. I I I . S TA RV AT I O N A N A LY S I S U S I N G B A L L O T T H E O R E M In this section, we study the starvation behavior of an M/M/1 (also extended to M/D/1) qu eue with finite nu mber of ar riv als b ased o n the powerful Ballot theorem . A. System Description W e co nsider a sing le med ia file with finite size N . Th e media content is pre-stored in the med ia server (e.g. vid eo on demand (V oD) service). When a user makes a req uest, th e server segmen ts th is m edia into packets, and transfer s th em to the user by use of T CP or UDP . When packets traverse the wired or wireless links, their arr i vals to the m edia p layer of a user are not deterministic due to the dyn amics of the av ailable bandwidth . Th e Poisson assump tion is not the most realistic way to describe p acket arrivals, but it reveals the essential features of the system, and is the first step for more gene ral arriv al processes. After the strea ming packets are recei ved, they are first stor ed in th e playo ut buffer . The interval b etween two pac kets that are served is assumed to b e expon entially distributed so that we can model the receiver buf fer as an M/M/1 queue. The maximum b u ffer si ze is assumed to be lar g e enoug h so that the who le file can be stor ed. This simplification is justified by the f a ct that the stor age space is u sually very large in the r eceiv er side (e.g. several GB). The user p erceived media quality has two measure s called start-up dela y and starvation . As explained ear lier , th e media player wants to a void the starvation by prefetching packets. Howe ver, this actio n might incu r a long waiting time . In what follows, we reveal th e relationship between the start-up delay and the starvation behavior, with the consideratio n o f file size. B. A P acket Level Model W e present a p acket le vel mod el to invest igate the starvation behavior . W e deno te by λ the Poisson arrival rate of the packets, and by µ the Poisson service rate. W e define ρ := λ/ µ as th e traf fic intensity . In a n on-em pty M /M/1 qu eue with everlasting arriv als, the rate at which e ither an arrival or a depar ture occurs is g i ven by λ + µ . T his event co rrespon ds to an arriv al with pro bability p , or is otherwise to an end of service with probability q , where p = λ λ + µ = ρ 1 + ρ ; q = µ λ + µ = 1 1 + ρ . The buf f er is initially empty . W e let T 1 be the start-u p delay , in which x 1 packets are accu mulated in the buffer . Ou r analysis of th e pro bability of starvation is b uilt on the famous Ballot theorem: Ballot Theorem: In a ballot, candidate A sco r es N A votes and candidate B scor es N B votes, wher e N A > N B . Assume that wh ile coun ting, all the ordering (i.e. a ll sequen ces of A’ s and B’s) a r e equally alike, the p r o bability that thr oug hout the counting, A is always ahead in the count o f votes is N A − N B N A + N B . After the service begins, the probab ility of s tarvation is giv en by Theorem 1. Theor e m 1: For the initial queu e length x 1 and the to tal size N of a file, the proba bility of starvation is given by : P s = N − 1 X k = x 1 x 1 2 k − x 1 2 k − x 1 k − x 1 p k − x 1 (1 − p ) k . (1) Proof: W e defin e E k to be an event that the buffer becom es empty for the first time when th e service of p acket k is finished. It is o bvious tha t all the events E k , k = 1 , · · · N , are mu tually exclusi ve. Th en, th e e vent of star vation is th e union ∪ N − 1 k = x 1 E k . This union of ev e nts excludes E N because the empty buf f er af ter the service of N packets is n ot a starvation. When th e buf f er is empty at the end of the service of th e k th packet, the n umber of arrivals is k − x 1 after th e prefetchin g process. The pro bability o f having k − x 1 arriv als and k departures is compu ted from a binom ial distribution, 2 k − x 1 k − x 1 p k − x 1 (1 − p ) k . W e next find the n ecessary and suffi- cient cond ition o f the ev en t E k . If we have a backward tim e axis that s tarts from the time point when the b uffer is empty for the first time, the nu mber o f departur e packets is always mo re than that of arriv al pa ckets. As a result, the Ballot Th eorem can be applied. For example, among the last m events (i.e. m ≤ 2 k − x 1 ), the number of packets that have b een playe d is alw a ys greater than the nu mber of arriv als. Oth erwise, the em pty b uffer alread y happ ens befor e the k th packet is served. Acco rding to the Ballot theore m, the pr obability o f ev e nt E k is computed by x 1 2 k − x 1 2 k − x 1 k − x 1 p k − x 1 q k . Therefo re, the pro bability of starvation, P s , is the pro bability of the union ∪ N − 1 k = x 1 E k , gi ven by eq.( 1). The starvation event may happen for mo re th an on ce du ring the file transfer . W e ar e particularly interested in the proba- bility d istribution of s ta rvations, giv en a finite file size N . The maxim um num ber of star vations is J = ⌊ N x 1 ⌋ where ⌊·⌋ is the floor o f a real num ber . W e define path a s a comp lete sequence of p acket arriv als an d depar tures. The pr obability of a path dep ends on the number of starvations. W e illustrate a typical p ath with j starvations in Figure 1. T o carry ou t the analysis, we start from the event that the first starvation takes place. W e de note by k l the l th departur e o f a p acket that sees an empty q ueue. W e notice that the path can be d ecompo sed into th ree typ es of mutu ally exclusiv e e vents as fo llows: • E vent E ( k 1 ) : th e buffer becoming empty for the first time in the entire path. 4 Fig. 1. A path with j starv ations • E vent S l ( k l , k l +1 ) : the emp ty buf fer af ter the service o f packet k l +1 giv en th at the previous empty buffer happens at th e dep arture of packet k l . • E vent U j ( k j ) : th e last empty buffer observed after th e departur e of packet k j . Obviously , a path with j starvations is compo sed of a su cces- sion of events E ( k 1 ) , S 1 ( k 1 , k 2 ) , S 2 ( k 2 , k 3 ) , · · · , S j − 2 ( k j − 2 , k j − 1 ) , S j − 1 ( k j − 1 , k j ) , U j ( k j ) . W e let P E ( k 1 ) , P S l ( k l ,k l +1 ) and P U j ( k j ) be the pro babilities of ev e nts E ( k 1 ) , S l ( k l , k l +1 ) and U j ( k j ) respectively . The main difficulty to analy ze the pro bability mass fun ction is th at the media player pa uses f or x 1 packets upo n starvation. In what follows, we analyze the pro babilities o f these events step by step. Th e event E ( k 1 ) can happ en after the dep arture of pac ket k 1 ∈ [ x 1 , N − 1 ] . Accordin g to the proo f of Theorem 1, the probab ility distribution of event E ( k 1 ) can be expressed as P E ( k 1 ) := 0 if k 1 < x 1 or k 1 = N ; x 1 2 k 1 − x 1 2 k 1 − x 1 k 1 − x 1 p k 1 − x 1 q k 1 otherwise . (2) The first starvation ca nnot happen at the departure of first ( x 1 − 1) p ackets because of the pr efetching of x 1 packets. It cannot h appen after all N packets have been served because this empty buf fer is not a starv atio n. W e n ext solve the probab ility distribution of the event U j ( k j ) . Sup pose that the re are j starvations after the service of pa cket k j . The extreme case is that the se j starvations take place consecutively . Thus, k j should be grea ter than j x 1 − 1 . Otherwise ther e canno t ha ve j starvations. The starv ation event cann ot take place after the departur e of packet N b ecause the whole file h as now b een transferred . If k j is no less th an N − x 1 , the media p layer resumes un til all the remaining N − k j packets are s to red in the buffer . Th en, starvation will n ot appear a fterwards. In the remaining cases, the event U j ( k j ) is equiv alen t t o the ev e nt that no starvation h appens af ter the service of packet k j . W e can take the comp lement of starvation pr obability as the probab ility of no starvation. Hence, the probability distribution of event U j ( k j ) is given by P U j ( k j ) := 0 , if k j < j x 1 or k j = N ; 1 , if N − x 1 ≤ k j < N ; 1 − P N − k j − 1 m = x 1 x 1 2 m − x 1 2 m − x 1 m p m − x 1 q m , otherwise . (3) W e denote by P s ( j ) the pr obability o f ha vin g j starvations. The pr obability P s (0) can b e obtain ed from Theo rem 1 directly . For the case with o ne starvation, P s (1) is solved b y P s (1) = N X i =1 P E ( i ) P U 1 ( i ) = P E · P T U 1 (4) where T denote the transpose. He re, P E is the row vector of P E ( i ) , and P U 1 is the ro w vector of P U 1 ( i ) , for i = 1 , 2 , · · · , N . T o com pute th e probab ility of ha vin g more tha n one star- vations, we n eed to find th e proba bility of ev ent S l ( k l , k l +1 ) beforeh and. Solving P S l ( k l ,k l +1 ) is non-trivial du e to that the probab ility of this event depends on the r emaining file size and the numb er of starvations. After p acket k l is served, the l th starvation is o bserved. It is clear th at k l should not be less than l x 1 in o rder to h av e l starvations. Given that the buf f er is empty after servin g packet k l , the ( l + 1 ) th starvation canno t happen at k l +1 ∈ [ k l + 1 , k l + x 1 − 1] b ecause of the su bsequent prefetchin g p rocess. Sin ce there are j starvations in total, th e ( l + 1) th starvation m ust satisfy k l +1 < N − ( j − l − 1) x 1 . W e next co mpute th e remainin g case that th e l th and the ( l + 1) th starvations ha ppen a fter packets k l and k l +1 are served. T hen, there are ( k l +1 − k l ) d epartur es, an d ( k l +1 − k l − x 1 ) a rriv als after the pr efetching process. Acco rding to the Ballot theor em, a path withou t starvation between the departu re of p acket ( k l + 1) and that of packet ( k l +1 ) is expressed as x 1 2 k l +1 − 2 k l − x 1 . Therefo re, we can express P S l ( k l ,k l +1 ) as x 1 2 k l +1 − 2 k l − x 1 2 k l +1 − 2 k l − x 1 k l +1 − k l − x 1 p k l +1 − k l − x 1 q k l +1 − k l , if k l ≥ l x 1 , k l + x 1 ≤ k l +1 < N − ( j − l − 1) x 1 ; 0 , otherwise . (5) W e denote by P S l the matrix of P S l ( k l ,k l +1 ) for k l , k l +1 ∈ [1 , N ] . Here, P S l is an uppe r triangle ma trix where all the elements in the first ( lx 1 − 1) r ows, an d the last x 1 rows are 0. Th e pr obability o f having j ( j ≥ 2) starvations is g i ven by P s ( j ) = N X k 1 =1 N X k 2 =1 · · · N X k j − 1 =1 N X k j =1 P E ( k 1 ) · P S 1 ( k 1 ,k 2 ) · · · P S j − 1 ( k j − 1 ,k j ) · P U j ( k j ) = P E j − 1 Y l =1 P S l P T U j . (6) The prob ability o f no starvation, P s (0) , is comp uted as 1 − P s where P s is obtained from eq.( 1). Since the starvation ev ent takes n on-negative integer values, we can write the pr obability generating fu nction (p .g.f.) G ( z ) by G ( z ) = E ( z j ) = X J j =0 P s ( j ) · z j . (7) In P , P S l and P U j , the bino mial distributions can be ap- proxim ated by the correspon ding Nor mal distributions with negligible erro rs (see Append ix). The Gau ssian appro ximation 5 significantly reduces the computation al co mplexity of binomial distributions. W e next analyze the com plexity o f matrix (inclu ding vector) operation s in eq . (6). A ma trix op eration co nsists of floating- point operations wh ere one fl oating-p oint op eration can be an addition , subtra ction, m ultiplication or d ivision of two float type matr ix elements [29]. In the complexity analysis of matrix op erations, the lower-order terms are usually ign ored. The ap prox imated probab ility of starvation in eq.( 1) consists of N add itions, thu s ha v ing a complexity order O ( N ) . T he probab ility of one starv a tion is a produ ct of two vectors, which consists o f N multiplications and N − 1 addition s. Hence, the comp lexity ord er in still O ( N ) . If there are only two starvations, we ne ed to compute the product of tw o vectors and one matrix, which h as a complexity or der O ( N 2 ) . When j ≥ 3 , the co mputation of P s ( j ) inv olves the pro duct of two matrices. In g eneral, multiply ing two m atrices has a complexity order O ( N 3 ) . In eq .(6), we should multiply a vector an d a matrix each time, instead of multiplyin g two matrices in side th e bracket. T hen, the matrix o perations in eq.(6) only contain a set of multip lications between a vector and a matrix. Th is yields the comp lexity ord er O ( N 2 ) . T o sum up, the compu tation o f the p.g.f. of starvations in eq .(7) has a co mplexity o rder O ( N 2 ) , g iv e n the start-up/rebuffering threshold x 1 and the file size N . Asymptotic Property: W e want to know whether the starvation event yields simple implications as the file size N approach es ∞ . The a symptotic behavior of the starvation pr obability is given by lim N →∞ P s := ( 1 if ρ < 1; exp x 1 (1 − 2 p ) 2 pq otherwise . (8) The d etailed an alysis c an be found in th e App endix. The asymptotic starvation p robability is irrelevant to the start-up threshold when ρ < 1 . Under this situation, it is necessary to k now h ow freq uent the starvation event happ ens. Here, we compute the average time interval betwe en two starvations. W e let T s be th e dura tion of starvation interval. Its expectation E [ T s ] is the expected b u sy p eriod of an M/M/1 queue with x 1 customers in the beginning [4], i.e. E [ T s ] = x 1 λ (1 − ρ ) . (9) C. Extension to Discr ete-time Systems In gen eral, the p layback r ate of video streaming h as a much smaller v arian ce th an th e arri val rate. Hence, the play back of streaming pac kets is sometimes regarded as a time-slotted process (e.g. [6], [7] ) where only one packet is served at the beginning of a time sl ot. W e consider a playout buf fe r mo deled as an M/D/1 queue. W e den ote by d the dur ation of a slot. In th is subsection, we introduce a discrete Ballot theo rem named T ak ´ acs Ballot Theo rem. Theor e m 2: (T ak ´ acs Ballot Theorem [1]) If X (1) , X (2) , · · · , X ( l ) are cyclically interchan geable r .v .s taking on no nnegative integer values summ ing to k , then P n t X s =1 X ( s ) < t, ∀ t ∈ [1 , l ] o = [ l − k ] + l . (10) The T ak ´ acs Ballot Theo rem pr esents a prob ability that the number of de partures is larger th an that of arriv a ls in all l slots. I f the ar riv al pr ocess { X ( s ) } is Poisson , X ( s ) is i.i.d. at d ifferent slots, and thus cyclically in terchang eable. Supp ose that the starvation event hap pens a fter t packets hav e bee n served, ( t ≥ x 1 ). The total number of arri vals is t − x 1 . W e create a ba ckward time axis where the starvation event happ ens at slot 1 . The numb er o f depar tures is al ways gr eater than that of arrivals . Other wise, th e starvation event has alr eady taken place. Hence, according to T ak ´ acs Ballot theo rem, the probab ility of the departur e always lead ing the arrival is P t X s =1 X ( s ) < t, ∀ t ∈ [1 , l ] = x 1 l . (11) Therefo re, th e pro bability that the first starvation takes p lace after the service of the l th packet (i.e. starvaton event happ en- ing at slot ( l +1) ) P s ( l ) = x 1 l · P { l X s =1 X ( s ) = l − x 1 } , ∀ l ≥ x 1 . (12) For the Poisson pro cess { X ( s ) } , th e p robability of l − x 1 packet arr i vals in l slots (i.e. th e d uration l d ) is o btained b y P { l X s =1 X ( s ) = l − x 1 } = ( λld ) l − x 1 ( l − x 1 )! exp( − λl d ) . (13) Giv en the file size N and the prefe tching threshold x 1 , the starvation might happ ens up on the departur e of packets fro m x 1 to N − 1 . Then the starv ation pro bability is obtained b y P s = N − 1 X l = x 1 x 1 l ( λld ) l − x 1 ( l − x 1 )! exp( − λl d ) . (14) W e next show how the p.g.f . of starvation events can be derived using the T ak ´ acs Ballot theorem. The path with j starvations is th e same as that in Fig.1. W ith certain abuse of notations, we reuse E ( k 1 ) , U j ( k j ) and S l ( k l , k l +1 ) to den ote the first, the last and the o ther starvation ev e nts. Accord ing to eq.(13), th ere ha s P E ( k 1 ) := ( 0 if k 1 < x 1 or k 1 = N ; x 1 k 1 ( λk 1 d ) k 1 − x 1 ( k 1 − x 1 )! exp( − λk 1 d ) otherwise . (15) Since there exist j starvations in total, th e last star vation event will not hap pen at the departu re of packets le ss than j x 1 . Giv en the last starvation hap pening as soon as the k th j packet is served, the prob ability of n o starvation afterward s can also be solved using eq .(13). P U j ( k j ) := 0 , if k j < j x 1 or k j = N ; 1 , if N − x 1 ≤ k j < N ; 1 − P N − k j − 1 s = x 1 x 1 s ( λsd ) s − x 1 ( s − x 1 )! exp( − λsd ) , otherwise . When the l th and the l +1 th starvation e vents appear at the departur e of packet k l and k l +1 , the proba bility P S l ( k l ,k l +1 ) is giv en by x 1 k l +1 − k l ( λ ( k l +1 − k l ) d ) ( k l +1 − k l − x 1 ) ( k l +1 − k l − x 1 )! exp( − λ ( k l +1 − k l ) d ) if k l ≥ l x 1 , k l + x 1 ≤ k l +1 < N − ( j − l − 1) x 1 ; 0 , otherwise . (16) 6 Then, the p.g.f. of starvation events can be solved using eq.(7) in the same way . I V . S TA RV A T I O N A N A L Y S I S V I A A R E C U R S I V E A P P R OA C H In this section, we present a recu rsi ve app roach to com pute the p. g.f. of starv ations b ased on [9]. Compar ed with th e on e using Ballot theo rem, th e r ecursive ap proach can handle mor e complicated arriv al pro cess. A. Pr oba bility of Starvation The p robability of starvation an d th e p.g .f can be analy zed all in on ce. Howe ver, we compute them separ ately becau se the analysis of the starvation probability provides an easier route to understand this appro ach. W e denote by P i ( n ) the prob ability of starvation with a file of n p ackets, giv en that there are i packets in the system ju st before the arriv al e poch of the fir st packet of this file. In th e original sy stem, ou r purp ose is to obtain the starvation pro ba- bility of a file with th e size N when x 1 packets are p refetched before the serv ice begins. T his cor respond s to P i ( n ) with n = N +1 − x 1 and i = x 1 − 1 . Here , the expr ession i = x 1 − 1 means that the service starts when th e x 1 -th packet sees x 1 − 1 packets a ccumulated in the b uffer . When the service be g ins, ther e are a lr eady x 1 packets in the queu e. T o compute P i ( n ) , we will intro duce recursiv e equations. W e define a qu antity Q i ( k ) , i = 0 , 1 , · · · , n , 0 ≤ k ≤ i , which is the probability that k pa ckets o ut o f i leave th e system during an inter-arriv a l period. T his pro bability is equi valent to the probab ility of k Poisson arriv als with rate µ during an exponentially distrib uted period with par ameter 1 /λ . According to [8], we obtain Q i ( k ) = ρ 1 1 + ρ k +1 = pq k , 0 ≤ k ≤ i − 1 , (17) Q i ( i ) = 1 1 + ρ i = q i . (18) T o carry ou t the recursive ca lculation, we start fr om the case n = 1 . P i (1) = 0 , ∀ i ≥ 1 . (19) When the file size is 1 an d the o nly packet ob serves a no n- empty qu eue, the p robability of starvation is 0 obviously . I f i is 0 , th e starvation h appens fo r sure , thus yielding P 0 ( n ) = 1 , ∀ n. (20) For n ≥ 2 , we have the f ollowing r ecursive equatio ns: P i ( n ) = i +1 X k =0 Q i +1 ( k ) P i +1 − k ( n − 1) , 0 ≤ i ≤ N − 1 . (21 ) W e explain ( 21) as the f ollowing. When the first pac ket of the file ar riv es and sees i p ackets in the system, the starvation does not happen . Howe ver, the star vation migh t hap pen in the service of rem aining n − 1 packets. Up on the arr i val o f th e next packet, k packets out of i + 1 leave the system with probab ility Q i +1 ( k ) . W e n ext add co nstraints to the re cursive equation (21) for a file of size N . Since the total num ber of packets is N , the starvation prob ability must satisfy P i ( n ) = 0 for i + n > N . B. P .G.F . of Starvations T o compute the p.g .f. of starvation, we use the same recursive approac h, d espite o f the m ore co mplicated structure. W ith certain reu se o f notation , we deno te b y P i ( j, n ) the probab ility of j starvation of a file with size n , given that the first packet of the file sees i packets in the system u pon its arriv al. Our final purpo se is to comp ute the pro bability of starvation for a file of size N . I t can be o btained fr om P i ( j, n ) with i = x 1 − 1 a nd n = N + 1 − x 1 . When the first packet of remaining n packets arri ves at the buffer , it sees x 1 − 1 packets. At this time point, there are x 1 packets in the buffer and the service o f pac kets begins. In order to co mpute P i ( j, n ) recur si vely , we provid e the initial conditions first: P i ( j, 1) = 0 ∀ i = 1 , 2 , · · · , N − 1 , a nd j ≥ 1; 1 ∀ i = 1 , 2 , · · · , N − 1 , a nd j = 0 , (22) and P 0 ( j, 1) = 0 j = 0 or j ≥ 2; 1 j = 1 . (23) The eq uation (22) means that the probability of no starvation is 1 condition ed b y i ≥ 1 and n = 1 . Thus, the probability of having one o r more starvations is 0 obvio usly if the on ly packet sees a no nempty system. T he eq uation (23) r eflects that the starvation ha ppens f or sure when the only packet observes an em pty queue. Howe ver, the re can on ly have one starvation ev e nt due to n = 1 . Another p ractical co nstraint is P i ( j, n ) = 0 , if i + n > N (24) because of the finite file size N . T o com pute P i ( j, n ) , w e need to k now wh at will h appen if the buffer is em pty , i.e. i = 0 . One in tuitiv e obser vation is P 0 (0 , n ) = 0 , ∀ 1 ≤ n ≤ N − b ; (25) where b := x 1 − 1 is d enoted to be th e pr efetching threshold. Eq.(26) h olds because an emp ty queu e mea ns at least o ne starvation event. For a m ore general prob ability P 0 ( j, n ) , we begin with th e case j = 1 . If n ≤ b and the first packet of n sees an emp ty buf fer , there has o nly one starvation, th at is, P 0 (1 , n ) = 1 , ∀ 1 ≤ n ≤ b, (26) If n > b , b pa ckets will be p refetched . Thus, the r emaining file size is n − b . W e see b packets in the system u pon th e arriv al of th e first packet in the r emaining file. Gi ven that the o nly one starvation event h as taken p lace, there will be n o futur e starvations. Th erefore , the following equ ality holds, P 0 (1 , n ) = P b (0 , n − b ) , ∀ b < n ≤ N − b. (27) Using the similar method , we can solve P 0 ( j, n ) fo r j > 1 . Howe ver, the p roperty of P 0 ( j, n ) with j > 1 is quite d ifferent P 0 ( j, n ) = 0 , ∀ j > 1 and 1 ≤ n ≤ b. (28) This me ans that the pr obability of having > 1 starvations is 0 if the file size is no larger th an b . If n is greater than b , then b packets are prefetch ed, leaving n − b packets in the remain ing file. The remaining n − b packets en counter j − 1 starvations, 7 giv en that the first packet sees b packets in the system upo n arriv al, i.e . P 0 ( j, n ) = P b ( j − 1 , n − b ) , ∀ j > 1 and n > b. (29) So far, we have comp uted a c ritical qua ntity P 0 ( j, n ) , th e probab ility of meeting a n empty buffer . Next, w e c onstruct recursive equa tions to compute P i ( j, n ) as the following: P i ( j, n ) = i +1 X k =0 Q i +1 ( k ) P i +1 − k ( j, n − 1) , = i X k =0 pq k P i +1 − k ( j, n − 1 ) + q i +1 P 0 ( j, n − 1 ) , (30) for 0 ≤ i ≤ N − 1 . Th e eq. (30) contain s two p arts. Th e fo rmer expression reflects the ca ses tha t th e next arr iv al sees an non- empty q ueue. The latter on e character izes the transition of the system to a prefetchin g p rocess tha t is compu ted by (29). W e are interested in how efficient the recu rsiv e metho d is. Hence, we present the roadmap to co mpute P i ( j, n ) and its complexity: • St ep 1: Solving P i (0 , 2) , for i = 1 to N − 2 ; • St ep 2 : Solv ing P i (0 , n ) , for i = 1 to N − 2 , and n = 3 to N − x 1 +1 b ased o n Step 1 ; • St ep 3: Ad ding j by 1 an d co mputing P i ( j, n ) based on Step 1 and Step 2 . The com plexity an alysis is carried out fr om this roadmap . A n operation in this recu rsiv e algorithm refers to an addition . In step 1 , the computation of P i (0 , 2) incurs i +2 additions for each i according to eq.(30). Hence, the total number of additions fo r all i from 1 to N is around N 2 / 2 . Step 2 computes P i (0 , n ) rep eatedly for each n ∈ { 2 , · · · , N } . The Step 3 repeats Step 1&2 fo r each j , but n ot augmenting the complexity orde r in N . Ther efore, the total com plexity has the order O ( N 3 ) . T he recursive algo rithm o btains the starv ation probab ilities for all j and n , ( j ≤ J , n ≤ N ) a nd all initial start-up threshold i ( 1 ≤ i ≤ N ). Remark 1: W e compar e the com plexity o f the Ballot approach and the recur si ve appr oach. First, the stand ard Ballot ap proach contains factorial terms (e.g. 2 k − x 1 k − x 1 in eq.(1)) that are of high computatio nal burdens. Second , a fter Gaussian ap proxim ation of factor ial terms, the Ballot appr oach has a com plexity o rder O ( N 2 ) given th e file size and the start-up threshold. The recur - si ve ap proach ha s a com plexity O ( N 3 ) for all com binations of initial start-u p threshold i and file size n (1 ≤ i, n ≤ N ) . Thus, the r ecursive app roach has an overall smaller comp lexity than the Ballot ap proach. C. ON/OFF Bursty T raffic In this section, we m odel the ar riv al process as an inte r - rupted P oisson pr ocess (IPP ) , wh ich is co mmonly used to characterize the bursty and correlated arriv a ls. T he sou rce may stay fo r relatively lo ng dur ations in ON and OFF states. The ON/OFF arr iv al m odel also has direct applications. For example, the Y ou tube servers use a simple ON/OFF rate control alg orithm to tran sfer streaming p ackets to the users [20]. Our objectiv e is to und erstand the interaction between the parameters of arr i val p rocess and the proba bility o f starvation. Fig. 2. T wo-state Markov process to m odel bursty traf fic W e illustrate the bursty traffic model in figure 2 with the state transition r ates α and β . W e denote by Q i ( k ) ON , 0 ≤ i ≤ N − 1 , 0 ≤ k ≤ i , th e pr obability that k packets ou t of i lea ve the system upon an arriv al at the ON state (i.e. no arriv al dur ing the OFF perio d). According to [9], the following propo sition h olds. Pr oposition 1: [9] The p robability Q i ( k ) ON is expressed as Q i ( k ) ON = c 1 1 a 1 k + c 2 1 a 2 k , 0 ≤ k ≤ i − 1 , Q i ( i ) ON = c 1 (1 /a 1 ) i 1 − 1 / a 1 + c 2 (1 /a 2 ) i 1 − 1 / a 2 , (31) where a 1 , a 2 , c 1 and c 2 are solved by ∆ = ( λ + α + β ) 2 − 4 λβ , a 1 , 2 = 1 + λ + α + β 2 µ ± √ ∆ 2 µ , c 1 = λ ( β + µ ) − λµa 1 a 1 ( a 2 − a 1 ) , c 2 = λ ( β + µ ) − λµa 2 a 2 ( a 1 − a 2 ) . W e next show how the starvation prob ability P i ( j, n ) is obtained. T he star vation event c an happen in bo th the ON and OFF states. Howev er , th e starvati on event at the OFF state is equiv ale nt to the ev ent tha t th e fir st new packet arriv al at the ON state sees an empty q ueue. Th erefor e, we can use (2 8) to compute the p.g.f . of starvations with bursty arrivals , simply replacing Q i ( k ) by Q ON i ( k ) . Remark 2: The stand ard Ballot theorem cannot be used to study the starvations of the ON/OFF arriv al process. In the presence of bursty traffic, the p acket a rriv al pr ocess h as two states, ON and OFF . The packet a rriv als of two consecuti ve ON states a re separ ated by an OFF state. Hen ce, the co unting of th e arri val arrivals is not equally pro bable. V . F L U I D M O D E L A N A LY S I S O F S TA RV A T I O N P R O B A B I L I T Y So far we have studied the star vation behavior of a sing le file, which is con cerned b y either th e media servers or the users. In fact, the streaming p roviders are m ore in terested in the QoE ev aluatio n scaled to a la rge qua ntity o f videos. They cannot afford the effort o f configurin g each file a different start-up delay . I n this section, we pr esent a fluid a nalysis of starvation p robability , given the distribution of file size. In th e flu id mo del, th e ar riv al and depar ture rates are deterministic. W e let λ be the nu mber of packet arriv als p er second , and µ be the num ber of depa rtures per second . Here, µ d epends on the encodin g rate th at the media files use. W e focus on the setting µ ≥ λ because n o starvation will h appen with µ < λ in th e fluid mo del. W e let x 1 be the start- up 8 threshold. The start-up delay T 1 is simply comp uted b y x 1 /λ . Once the m edia packets are played, the queu e length decreases at a rate µ − λ . The time need ed to emp ty the queue is thus x 1 µ − λ . W e let N p be the total n umber of p ackets th at are served until a starvation hap pens, N p = x 1 1 + λ µ − λ = x 1 µ µ − λ . (32) If the file size is less tha n N p , there will be no starvation e vent. The d istribution o f media file size depends on the types o f contents. A measurem ent study in [19] shows the distributions of Y outube v ideo d uration fo r four mo st po pular categories: music, en tertainmen t, comedy and sports videos. The auth ors find that mo st of the en tertainmen t, comed y and sports video s are sho rt. They are likely to follow exponential distribution or logn ormal distribution with large standar d deviations. Th e lengths of m usic files in play back tim e are u sually between 180 and 240 second s ( the file size in Bytes is the pro duct of duration an d the default b it-rate on Y outu be). He nce, with the help of the measu rements in [1 9], we speculate that mu sic video files on Y outu be follow lo gnorm al distrib utio n with a small standard deviation. T he P ar eto distribution adds pr actical restrictions to th e v ideo file size. The file size needs to b e greater than a c ertain value, a nd a very small fraction of video files can be very large. T oday , Y outu be allows some users to upload some long movies (more than the previous maxim um of 10 min) witho ut co pyright issues. The distribution of movie file size may have a heavy-tail. Then, Pareto distribution can serve as a g ood ap proxima tion. W e comp are the star vation probabilities of expon ential, log- normal an d Pareto distributions, given the start-up thresho ld. Note that th ese distributions possess th e same me an file size. W e assume tha t the users are hom ogeneo us so that λ and µ are the same for d ifferent ty pes of file size d istributions. i) Exp onentia l d istrib u tion: Suppo se that th e file size N follows a n expon ential distribution with param eter θ . The probab ility of starvation, P (1) s , is obtain ed by P (1) s = Prob ( N > N p ) = exp( − θx 1 µ µ − λ ) . (33) ii) P ar e to distribution: W e let N m be the minimum possible value of the file size, and υ be th e expo nent in the Pareto distribution. The probability o f starvation is comp uted by P (2) s = Prob ( N > N p ) = ( N m ( µ − λ ) µx 1 υ ∀ N m ≤ x 1 µ µ − λ ; 1 otherwise , (34) where the expectation of the Pareto distribution is eq ual to that of th e exponential d istribution, i.e. υ N m υ − 1 = 1 θ . iii) Log-Normal distribution: W e sup pose that the file size follows a lo g-nor mal distribution ln N ( , σ ) , where and σ are the mean an d the standar d deviation of a natural norm al distribution. Given that N p packets c an be served without an interrup tion, the starvation p robab ility P (3) s is computed by P (3) s = Prob ( N > N p ) = 1 2 − 1 2 erf log x 1 µ µ − λ − √ 2 σ , (35) where its expectation e x p( + σ 2 2 ) equals to 1 θ . Equation s (3 3),(34) and (35) show that th e probability of starvation can b e co ntroled by setting x 1 , if the distribution of file size, the arriv al and dep arture rates are pre-knowledge 1 . V I . A P P L I C AT I O N T O S T R E A M I N G S E RV I C E This section pr esents fou r scen arios in streamin g service in which o ur an alysis c an be utilized to optimize the objectiv e QoE. H ere, we focu s on the M/M/1 system. The QoE reflects the huma n per ception of the streaming service. A c ommon practice to ev alua te QoE is called Mea n Opinion Score (MOS) . The video watchers give sco res accord- ing to the ir subjectiv e opinions. The start- up d elay an d the starvation behaviors are explicitly defin ed as quality metrics related to u ser per ception in [27], [28] a nd [ 7]. T o remove the confu sion, we designate the direct human per ception as subjective QoE, and designate the o bjective measure as ob jec- ti ve QoE. The huma n tests im plicitly map the ob jectiv e QoE metrics into a single subjective value. This QoE value, th ough revealing the user perce ption statistically , is usually un reliable to rep ort the QoE for each ind i vidual watching. At the same time, the sub jectiv e test is d one after the watching, which cannot be utilized to tune the p refetching online. Ther efore, a rising trend is to evaluate the objective QoE metrics an d to balance the tradeo ff amo ng them (e.g. [2 7], [28] and [7]). Our p urpose is to use conten t pr efetching a s a way to achieve the o ptimal tradeo ff between th e start-up delay an d the starvation b ehaviors (either the starvation probability or the co ntinuou s playback interval) for a user . In [7], the authors configur e a start-up thresho ld to g uarantee th at the starvation probab ility is less th an a certain value. The boun d o f the starvation pro bability is d eemed as a p arameter obtained fro m human te sts. In this paper, we ado pt a more flexible m ethod by defining an o bjective Qo E cost fun ction for a u ser . A user- defined weight λ is intro duced to indicate h is/her preferen ce to one type of objec ti ve Qo E metrics. W e fir st let the starvation probab ility be on e of th e QoE m etrics. W e let g ( · ) be a strictly increasing but conve x function of the expected start-up delay E [ T 1 ] . The larger the start-u p delay , the h igher the QoE co st. The conv exity of g ( · ) means th at streaming users ar e more and more impatient to large start-up delay s. W e d enote by C 1 ( x 1 ) the co st of a user watching the media stream , C 1 ( x 1 ) = P s + γ g ( E ( T 1 )) , (36) where γ is a positi ve constant. A large γ represents that the users are mor e sensitive to the start-up delay , an d a smaller γ means a high er sensiti v ity to th e starvation. O ur goal is to find th e o ptimal start-up threshold x ∗ 1 to min imize C 1 ( x 1 ) . The choice of C 1 ( x 1 ) should satisfy three b asic princ iples. First, it is con vex in x 1 so that o nly one optima l threshold x ∗ 1 exists. Second, C 1 ( x 1 ) is bound ed e ven if ρ is close to 1. Otherwise, th e con figuration of x 1 is extreme ly sensiti ve to ρ . Third , thou gh x ∗ 1 is n ot re quired to be a decreasing function of the arriv a l rate λ , it can not gr ow unbo unded 1 Because the starv ation probabilit ies P (1) s , P (2) s and P (3) s tak e complicate d forms, we will compare their dependenc y on x 1 numerica lly in sectio n VII. Both Pareto and Log-normal distribut ions have two parameters. In the comparison, we fix one of them, and solve the other ac cording to the property of identic al expect ations. 9 when λ is large en ough. I n what follows, we simply le t g ( E ( T 1 )) := ( E ( T 1 )) 2 = x 1 λ 2 . No te that building a completely convincible cost functio n is very difficult for a particular user . Even the measu rement stud ies in [27] and [28] only quantif y the influen ce of P s and E ( T 1 ) statistically and indirectly ( using user en gagemen t). W e choo se C 1 ( x 1 ) to be the sum o f the measu res of two type s of objective Qo E metrics for two reasons. One is the reflection of QoE tradeoff. T he other is its simplicity . Other fo rms of C 1 ( x 1 ) can be op timized in the same way . The more realistic cost functio n is su bject to our futur e study . W e apply our mod els to optimize objective QoE in three scenarios: i) finite m edia stream ing, ii) e verlasting media streaming and iii) file level. Th e scen arios i) an d ii) are designed f or a single stream, w hile iii) is design ed for a large number of streams. When the streaming file h as a finite size, the co ngested bo ttlenecks such as the 3G base station or th e wifi access point can configu re o r suggest a start-up thr eshold before the media stream is played . If the steamin g file is la rge enoug h (e.g. r ealtime spo rt chan nel), a user can m easure th e arriv al/serv ice pro cesses, a nd then configu re the rebuffering threshold. In the third scen ario, the media server can set up on e same start- up thresho ld fo r all the vid eos that it d istributes. T o av oid malfu nctions in realistic scenario s, a user can co nfigure the ma ximum an d the minimum star t-up/rebuffering d elay . Once maximum value is reached, th e m edia player star ts to play r egardless of th e prefetching thre shold. A. F inite Media Size W e her eby con sider the adap tiv e buffering techniqu e for a streaming with finite size. The eq. (1) and eq.(36) y ield C 1 ( x 1 ) = N − 1 X k = x 1 x 1 2 k − x 1 2 k − x 1 k − x 1 ! p k − x 1 (1 − p ) k + γ ( x 1 λ ) 2 . (37) The starvation prob ability decreases an d the start-up delay increases strictly as x 1 grows. In the objective QoE o pti- mization of finite media size, there do es not exist a sim ple expression of the optimal threshold x ∗ 1 . T o find x ∗ 1 numerically , we need to co mpare the costs from all p ossible thresho lds. The complexity order is low if the binomial distribution in eq.(1) is r eplaced by the G aussian d istribution. If a user can tolerate up to 1 starvations, P s will be replac ed by the p robability ( P s (0) + P s (1)) according to eq.( 4). B. Infin ite Media Size W e revisit the user perceived streaming quality in two scenarios: 1 ) ρ ≥ 1 and 2) ρ < 1 . Case 1: ρ ≥ 1 . The starvation pr obability c on verges to a fixed value whe n the file size ap proach es infinity . W e adopt the same QoE metric as that of the finite med ia size. Note that P s can be directly replaced by its asymptotic value in eq.(8). Submitting P s to C 1 ( x 1 ) , we have the f ollowing c ost f unction C 1 ( x 1 ) = exp x 1 (1 − 2 p ) 2 pq + γ ( x 1 λ ) 2 . Letting the derivati ve dC 1 dx 1 be 0 , we obtain x 1 · exp x 1 (2 p − 1) 2 pq = (2 p − 1) λ 2 4 γ pq . The o ptimal th reshold x ∗ 1 is solved b y x ∗ 1 = Lamb ertW ( (2 p − 1) λ 2 pq ) 2 · 1 2 γ · 2 pq 2 p − 1 , where Lamber tW ( · ) is the Lamber t W -fu nction. Case 2: ρ < 1 . When ρ < 1 , P s is 1 f or an infinite media size. If we adop t the Qo E metric C 1 directly , the op timal start-up delay is always 0. This requires a new objective QoE m etric for the case ρ < 1 . Since the starvation happens many times, the continu ous playback interval can serve as a measure o f users’ satisfaction. W e deno te by C 2 ( x 1 ) the co st function for an infin ite m edia size with ρ < 1 , C 2 ( x 1 ) := exp( − δ x 1 λ (1 − ρ ) ) + γ ( x 1 λ ) 2 , where δ is a user defined weighting factor to the expected playback du ration ( δ := 1 in o ur num erical examples). W e differentiate C 2 ( x 1 ) over x 1 , and let the derivati ve be 0 , then the op timal start-u p/rebuffering threshold is x ∗ 1 = Lamb ertW δ 2 2 γ (1 − ρ ) 2 · λ (1 − ρ ) δ . C. Optimal Objective Qo E in the F ile Level Unlike the above QoE optimiz ations, the th reshold x 1 for many files is configured by the media server, instead of the users. The ob jectiv e is still to balance the tradeoff b etween the start-u p delay and the starvation probability . Here, o nly the exponen tially distrib u ted file size is conside red. W e choo se the cost function C 1 ( x 1 ) that yields C 1 ( x 1 ) = exp( − θ x 1 µ µ − λ ) + γ x 1 λ 2 . The op timal threshold x ∗ 1 can b e easily fo und as x ∗ 1 = Lamb ertW ( θµλ µ − λ ) 2 · 1 2 γ · µ − λ µθ . V I I . N U M E R I C A L E X A M P L E S A. Starvatio n of M/M/1 Queu e This set of experimen ts compare s the prob ability of starva- tions with the event driven simulations using MA T LAB. The M/M/1 q ueue is tested for up to 5000 times with arr i vals from files of different sizes. W e delib erately consider four combinatio ns of parameter s: ρ = 0 . 95 or 1 . 1 , and x 1 = 20 or 40 pkts. The depar ture rate µ is n ormalized as 1 if not mentioned explicitly . The choice of the start-u p th resholds coincides with the play out of aud io o r video stream ing services in roug hly a co uple of seco nds (e.g. 200 ∼ 400 kbps p layback rate on a vera ge given the packet size o f 14 60 bytes in TCP). The file size in the experimen ts ran ges between 40 and 1000 in terms of p ackets. Figure 3 d isplays th e prob ability of 0,1 , an d 2 starv atio ns with parameters ρ = 0 . 95 a nd x 1 = 20 . When the file size g rows, the pro bability of no starvation decre ases. W e observe that the pr obabilities of 1 and 2 starvations increase first, and th en declin e after re aching the maxim um values. The reason lies in that the traffic inten sity ρ is less than 1. Figur e 3 also shows th at ou r analytical re sults match the simulation well. Figure 4 exhibits the similar results when the start-up threshold is 40 p kts. The comparison betwee n figure 3 and 10 4 manifests th at a larger x 1 is very effective in redu cing starvation p robability . Figure 5 plots the prob ability of n o starvation with th e traffic intensity ρ = 1 . 1 . The p robab ility of no starv atio n is improved by more than 10% (e. g. N ≥ 300 ) when x 1 increases from 2 0 to 4 0. Figure 5 also validates the asymptotic prob a- bility of no starvation o btained from Ga ussian and R iemann integral ap proxima tions etc. Figure 6 plots the pr obability of one starvation with the same p arameters. Recall that the probab ility of on e starvation decreases to 0 as N increases in the case ρ = 0 . 95 . While figure 6 exh ibits a different trend along with the increase of file size. This p robability becomes saturated, instead of d ecreasing to 0. When ρ is greater than 1, the prob ability of having a p articular numb er of starvations approa ches a constant. I n b oth figure 5 and 6, simu lation results validate the c orrectness of our analysis. Henc e, in the following e x periments, we only illustrate th e analytical results. 0 200 400 600 800 1000 0 0.1 0.2 0.3 0.4 0.5 0.6 0.7 0.8 0.9 1 File Size (pkt) Probability Parameters: ρ = 0.95, x 1 = 20 0 starv. − model 0 starv. − simu 1 starv. − model 1 starv. − simu 2 starv. − model 2 starv. − simu Fig. 3. Probabil ity of 0, 1, and 2 starv ations with ρ = 0 . 95 and x 1 = 20 0 200 400 600 800 1000 0 0.1 0.2 0.3 0.4 0.5 0.6 0.7 0.8 0.9 1 File Size (pkt) Probability Parameters: ρ = 0.95, x 1 = 40 0 starv. − model 0 starv. − simu 1 starv. − model 1 starv. − simu 2 starv. − model 2 starv. − simu Fig. 4. Probabil ity of 0, 1, and 2 starv ations with ρ = 0 . 95 and x 1 = 40 B. Starvatio n of Bursty T raffic W e con sider the ON/OFF bursty arriv al of packets in to an M/M/1 queue. For the ease of comparison, we let the t ransition rates α and β be bo th 0.2. The file size ranges from 40 to 500 pk ts. I n figure 7, we plo t the pr obabilities o f having no more than two starvations with ρ = 1 . 5 and x 1 = 40 . As the file size increases, the pro bability of no starvation d ecreases. The p robabilities of 1 and 2 starvations increases first, an d 0 200 400 600 800 1000 0.84 0.86 0.88 0.9 0.92 0.94 0.96 0.98 1 File Size (pkt) Probability Zero starvations with parameters: ρ = 1.1, x 1 = 20 and 40 x 1 = 20 − model x 1 = 20 − simu x 1 = 20 − Asympt. x 1 = 40 − model x 1 = 40 − simu x 1 = 40 − Asympt. Fig. 5. Probabil ity of no starva tion with ρ = 1 . 1 : x 1 = 20 and x 1 = 40 0 200 400 600 800 1000 0 0.02 0.04 0.06 0.08 0.1 0.12 0.14 File Size (pkt) Probability One starvations with parameters: ρ = 1.1, x 1 = 20 and 40 x 1 = 20 − model x 1 = 20 − simu x 1 = 40 − model x 1 = 40 − simu Fig. 6. Probabil ity of one starvat ion with ρ = 1 . 1 : x 1 = 20 and x 1 = 40 0 100 200 300 400 500 0 0.1 0.2 0.3 0.4 0.5 0.6 0.7 0.8 0.9 1 File Size (pkt) Probability Starvation probabilities with parameters: ρ = 1.5, α = β =0.2, x 1 =40 0 starv. 1 starv. 2 starv. Fig. 7. ON/OFF traf fic: probability of 0, 1, and 2 starvat ions with ρ = 1 . 5 and x 1 = 40 then decreases to 0. T his means that the star vation is for sure when the file size appr oaches infinity . I n figure 8, we plot th e starvation probab ilities for ρ = 2 . 5 and 3 . 0 wh ere the start-up threshold is set to 20. In con trast to figure 7 , the p robability of no starvation conv erges to a positive constant as N is large enoug h. Figure 9 illustrates the imp act of x 1 on the pr obability of n o starvation. In this set of experim ents, ρ is set to 2 . Th e start-up threshold x 1 increases from 20 to 60 pkts, and the file size increases fro m 400 to 8 00 pkts. It is clearly shown that a slight increase in x 1 can greatly impr ove the star vation pr obability . In figure 1 0, we plot the p robab ility o f n o starvation with 11 0.7 0.8 0.9 1 The starvation probabilities with x 1 = 20 0 100 200 300 400 500 0 0.05 0.1 0.15 0.2 File Size (pkt) Probability 0 starv.; ρ = 2.5 0 starv.; ρ = 3.0 1 starv.; ρ = 2.5 2 starv.; ρ = 2.5 1 starv.; ρ = 3.0 2 starv.; ρ = 3.0 Fig. 8. ON/OFF traf fic: prob . of 0, 1, and 2 starv ations for x 1 = 20 : ρ = 2 . 5 and 3 . 0 20 25 30 35 40 45 50 55 60 0.3 0.4 0.5 0.6 0.7 0.8 Thresholds Prob of no Starvation Probability of no starvation with ρ =2 and α = β =0.2 N = 400pkts N = 500pkts N = 600pkts N = 700pkts N = 800pkts Fig. 9. ON/OFF traffic : probability of no starv ation with ρ = 2 versus the threshold x 1 0.05 0.1 0.15 0.2 0.25 0.65 0.7 0.75 0.8 0.85 0.9 0.95 1 Transition rate α and β Prob. of no Starvation Prob. of no starvation with ρ = 2.5 and N = 800 x 1 = 40pkts x 1 = 50pkts x 1 = 60pkts Fig. 10. ON/OFF traf fic: probabil ity of no starv ation with ρ = 2 . 5 and N = 800 versus the state transition rates ρ = 2 . 5 and N = 80 0 pk ts. The transition r ates α and β increases from 0.0 5 to 0.25 . It can b e seen that the prob ability of no starvation increa ses mo notonica lly with the sy mmetric transition rates α and β . C. Starva tion in the Fil e Level This set of numerical exper iments shows the relatio nship between the starvation prob ability an d the distribution of file size. Th e traffi c intensity ρ is set to 0.95 . W e let θ be 1 /2000 in the exponen tial distribution. Then, the average file size is 20 00 pkts. This setting is in acc ord with the recen t measurement 0 1000 2000 3000 4000 5000 6000 7000 8000 0 0.1 0.2 0.3 0.4 0.5 0.6 0.7 0.8 0.9 1 File Size (pkts) CDF Exponential Pareto Lognormal ( σ =0.5) Lognormal ( σ =1.0) Fig. 11. Fluid analysis: CDF of media file size 20 40 60 80 100 120 140 160 180 200 0 0.2 0.4 0.6 0.8 1 Threshold (x 1 ) Prob. of Starvation Exponential Pareto Lognormal ( σ =0.5) Lognormal ( σ =1.0) Fig. 12. Fluid analysis: prob . of starv ation versus the threshold x 1 that most of mob ile streaming files are short (i.e. a median size of 1.68 MBytes) [30]. For the Pareto d istribution, we set the minimum file size to be 300 pkts so that the exponent υ is 1.176 5. The parameter s of the Lo g-no rmal d istribution are set to ( , σ ) = (7 . 476 , 0 . 5) and (7 . 1 01 , 1 . 0) respectively . W e plot the CDF cu rves o f the file sizes in Figure 1 1. In this setting, the Pareto distribution exhibits an obvio us heavy tail p roperty . For the lo g-nor mal distrib u tion, more th an 30% per cent of files are less than 1000 packets with σ = 1 and most o f the files are less than 2 000 p ackets with σ = 0 . 5 . The exponen tial distribution and the log -norm al distribution with σ = 1 . 0 exhibit similar CDF of file sizes. W e ev a luation the starvation p robab ilities in Figure 12 by increasing the start-up thresh old fro m 20 to 2 00. The starvation p robability of th e Pareto distributed files has a sharp red uction in the begin ning of inc reasing x 1 . Howev er , as x 1 is more th an 80, th ere is only a sligh t improvement in th e starvation prob ability . Hen ce, the streaming serv ice providers need to con figure different start-up threshold s f or the short files and the tail files in the Pareto d istribution. For the lo g- normal distribution with σ = 0 . 5 , the starvation probability is high with sma ll x 1 . There h av e sig nificant r eductions of starvation pro bability w hen x 1 increases fro m 4 0 to 14 0. This is beca use the file sizes have a small standard deviation. V ery small thr esholds do no t help to r educe th e starvation probab ility and very large thr esholds do not further red uce the starvation prob ability . When x 1 increases from 20 to 2 00, we can o bserve the noticeable reduction o f starvation probability 12 in the expo nential file size d istribution. As the take-h ome message of flu id analy sis, the cho ice of x 1 relies on the distribution o f file size to a great extent. T o obtain a better objective QoE, the media service p roviders can set different x 1 for different categories o f me dia files. D. Optimizing Quality of Experien ce Objective QoE optimizatio n of finite media size: W e illustrate the total Qo E cost (inclu ding the starvation cost and the start-up delay co st) in figure 13 with λ = 16 , 20 , 2 4 and µ = 25 . Th e file size is set to N = 1 000 and th e weight γ is 10 − 3 . W e find that the total QoE looks neither “c oncave” n or “conv ex” w .r .t. the start-up threshold. For examp le, when x 1 is less than 30 0 with λ = 16 , the increase in the star t-up delay cost canno t be comp ensated b y the red uction of the starvation probab ility . W e further p lot th e optima l start-up threshold obtained f rom the maximum of eq.(3 7) in figure 14. When γ = 10 − 4 and γ = 10 − 3 , the o ptimal start-u p threshold x ∗ 1 decreases when λ increases. W e also observe that for each λ x ∗ 1 of the case γ = 10 − 4 is high er than that o f γ = 10 − 3 because the f ormer u ser is more sensitiv e to th e starvation. In the extreme scenario γ = 0 , the strea ming user will download the whole media file b efore watching it. In the case γ = 5 × 10 − 3 , x ∗ 1 are always 1 if the arriv al r ate λ is less than 2 0. The reason lies in that th e to tal cost is always greater than 1 in those situatio ns. Th e start-up thresho ld x ∗ 1 = 1 will induce numero us consecutive starvations, which d efinitely degrade s the streaming Qo E. T o mitigate th is malfu nction, we can introdu ce a minimum playback d elay that work s indep endent of th e QoE optim ization. 0 100 200 300 400 500 600 0 0.5 1 1.5 Start−up threshold Total QoE cost C 1 (x 1 ) Total QoE cost of a flow with: N=1000, γ =0.001 and µ = 25 λ = 16 λ = 20 λ = 24 Fig. 13. Finite media size: total cost with µ = 25 and γ = 0 . 001 QoE opt imization of infinite media size: W e plot the optimal prefetchin g thr esholds x 1 for the case ρ > 1 in figure 15 and th e case ρ < 1 in figure 16. As λ increases, the optimal pr efetching threshold x ∗ 1 reduces. Unlike figure 14, there do not exist an abrup t change in x ∗ 1 . This is because the cost f unction C 1 ( x 1 ) is a conv ex fu nction of x 1 with bo th ρ > 1 and ρ < 1 . Furth ermore, x ∗ 1 decreases as γ in creases (the user p utting more weigh t to the p refetchin g delay). QoE opt imization in the flow level: W e invest igate th e cost minimization prob lem at the med ia server side n umerically . W e let µ := 25 which means that 15 20 25 30 0 50 100 150 200 250 300 350 400 450 500 Arrival rate λ Optimal start−up threshold Optimal thresholds for finite media size with µ = 25 γ = 10 −4 γ = 10 −3 γ = 5 × 10 −3 Fig. 14. Finite media size: optimal thresholds w ith γ = 10 − 4 , 10 − 3 , and 5 × 10 − 3 25.2 25.4 25.6 25.8 26 26.2 26.4 26.6 26.8 50 100 150 200 250 300 Mean rate of Poisson packet arrival Optimal start−up threshold (pkts) Optimal Start−up Threshold for Infinite File Size: ρ > 1 γ = 0.001 γ = 0.002 γ = 0.004 Fig. 15. Optimal threshold x ∗ 1 of infinite file size: ρ > 1 18 19 20 21 22 23 24 10 15 20 25 30 35 40 45 50 55 60 Arrival rate λ Optimal prefetching threshold Optimal prefetching threshold for infinite file size: ρ < 1 γ = 10 −5 γ = 10 −4 γ = 10 −3 Fig. 16. Optimal threshold x ∗ 1 of infinite file size: ρ < 1 25 packets are served per secon d. Gi ven th e packet size of 1460 bytes, this serv ice rate is equivalent to 29 2Kbps (with out considerin g proto col overhea ds). W e let the mean file size 1 /θ be 1 000 and 2000 pac kets respe ctiv ely (equiv alen t to the playback time of 40 and 8 0 secon ds). The sensiti v ity γ is set to 0.01 o r 0.00 5. Figure 17 illustrates the c hoice of the op timal start-up thresholds when λ increases from 20 to 2 5 (i.e. ρ ≤ 1 ). W e ev aluate fo ur comb inations of θ and γ nu merically . Ou r observations ar e summarized as f ollows. First, for the same file size d istribution, a smaller γ causes a higher optimal start-up threshold. Secon d, x ∗ 1 is n ot a strictly decrea sing functio n of λ . When λ is sma ll (e.g. 20pk ts/s), a large start-up thr eshold 13 does n ot h elp much in redu cing the starvation p robability , but causes impatience o f u sers o f waiting the end of p refetching . If λ in creases, the a dverse imp act o f setting a larger x 1 on the start-up d elay can be com pensated by the gain in the redu ction of starvation pr obability . Thir d, with th e same sensiti v ity γ , the op timal x ∗ 1 of a long v ideo stream can be smaller than that of a short on e in som e situation s. This is caused by the fact that th e large thresh old might n ot significantly improve the starv ation probability for a file of large size. W e further show the starvation pr obability in figure 18. A la rger mean file size, or a smaller γ result in a larger probab ility o f starvation. Unlike the start-u p thresho ld x ∗ 1 , the starvation probability is shown to b e strictly dec reasing as λ inc reases. 20 21 22 23 24 25 20 40 60 80 100 120 140 Arrival rate (pkts) Optimal start−up threshold (pkts) Optimal Setting of Start−up Thresholds 1/ θ =1000; γ =0.01 1/ θ =1000; γ =0.005 1/ θ =2000; γ =0.01 1/ θ =2000; γ =0.005 Fig. 17. Optimal threshold x ∗ 1 for QoE enhancement at the file lev el: µ = 25 20 21 22 23 24 25 0 0.1 0.2 0.3 0.4 0.5 0.6 0.7 0.8 0.9 Arrival rate (pkts) Starvation probability Starvation Probability in the Flow Level 1/ θ =1000; γ =0.01 1/ θ =1000; γ =0.005 1/ θ =2000; γ =0.01 1/ θ =2000; γ =0.005 Fig. 18. Starv ation probabili ty at the file le vel for the opt imal start-up threshold x ∗ 1 : µ = 25 V I I I . C O N C L U S I O N A N D D I S C U S S I O N W e have con ducted an exact analysis of the starvation behavior in M arkovian q ueues with a finite n umber of p acket arriv als. W e perform a packet le vel analysis and a fluid lev el analysis. Th e p acket level study is c arried out via tw o approa ches, the Ballot theo rem and the recursive equ ations. The for mer p rovides a n explicit expression, but is usually limited to i.i.d. p acket ar riv als. The latter can handle bursty packet ar riv al p rocess, but without an explicit result. From the perspective of a media service provider, we perf orm a fluid lev el analysis that com putes the probab ility of starvation for a large num ber of video files. W e fur ther apply the th eoretical results to tun e the p refetching thresho lds in order to optimiz e the ob jectiv e QoE for med ia streaming services. R E F E R E N C E S [1] L. T akacs, “Bal lot problems”, P r ob. Theory Related F ields , V ol. 1, No.2, pp:154-158 , 1962. [2] F . Baccel li and W . A. Massey , “ A Sample Pa th Analysis of the M/M/1 Queue”, Journal of Applie d Pr obability , V ol.26, No. 2, pp:418-422, 1989. [3] W . Ledermann and G. Reute r , “Spectral Theory for the Dif ferential Equations of Simple Birth and Death Processes”, P hi. T rans. Roy . Soc. London , V ol.246, No.914, pp:321-369, 1954. [4] L. Liu and D.H. Shi, “Busy period in GI(X)/G/ ∞ ”, J . Appl. P r ob. , V ol.33, pp:815-829 , 1996. [5] Hao Luan, Lin X. Cai, and Xuemin (Sherman) Shen, “Impact of net- work dynamics on users’ video quality: analy tical framew ork and QoS provi sion” IEEE Tr ans. on Multimedia , V ol.12, No.1, pp:64-78, 2010. [6] G. Liang and B. Lia ng, “Effec t of dela y and buf fering on ji tter-free streaming over rand om VBR ch annels” , IEE E T rans. on Mu ltimedi a , V ol.10, No.6 pp:1128-1141 , 2008. [7] A. ParandehGh eibi, M. Medard, A. Ozdagl ar, S. Shakk ottai, “ A voiding Interrupt ions a QoE Reliabil ity Function for Streaming Media Applica- tions”, IEEE Journal on Selected Ar ea in Communications , V ol.29, No.5, pp:1064-10 74, 2011. [8] A. Papoulis, “Probabi lity , Random V ariables and Stochastic Processes”, McGra w-Hill Publisher , pp:360-361 , 1984. [9] I. Citon, A. Khamisy , and M. Sidi, “ Analysis of pack et loss processes in high-spee d netw orks”, IEEE T rans. Info. Theory , V ol.39, No.1, 1993. [10] E. Altman, A. Jean-Marie, “Loss probab iliti es for messages with redun- dant packet s feeding a finite buf fer”, IEEE J. Sel. Area. Comm. , V o.16, No.5, pp:778-787, 1998. [11] E. Altman, A. Jean -Marie, “The distr ibut ion of delays of dispe rsed messages in an M/M/1 queue”, Proc. IEEE Infocom , Boston, 1995. [12] P . Dubea, O. Ait-Hella l, E. Altman, “On loss probabiliti es in presence of redundant packet s with random drop”, E lsevi er P erf. E val. , V ol.53, pp:147-167 , 2003. [13] P . Humblet, A. Bhar gav a, M.G. Hluch yj, “Ballot theorems applied to the transien t analysis of nD/D/1 queues”, IEEE T rans. Networki ng , V ol.1, No.1, pp:81-95, 1993. [14] O. Gure witz, M. Sidi, I. Cidon, “The Ballot Theorem Strikes Again: Pack et Loss Process Distribution ”, IEEE Tr ans. Info. T heory , V ol.46, No.7, 2000. [15] T . Stockhammer , H. Jenkac, and G . Kuhn, “Strea m ing video over v ariabl e bit-rate wireless channels, ” IEEE T rans. Multimedia , V ol.6, No.2, pp:268-277 , 2002. [16] J.F . He and K. Sohraby , “New Analysis Frame work for Discrete Time Queueing Systems with General Stochastic Sources”, Proc. of IEEE Infocom 2001 , pp:1075-1084, Anchorage , 2001. [17] A.Y . Pri va lova an d K. Sohraby , “ Playout in S lotte d CBR Networks: Single and Multipl e Nodes”, Probl ems of Information T ransmission , V ol.43, No.2, pp:143-16 6, 2007. [18] http:// techc runch.com/2010/11/19/web-video-37-percent-internet-traf fic/ [19] X. Cheng, C. Dale, J. C. Liu, “Statisti cs and Social Network of Y ouT ube V ideos”, Proc . of IEE E IWQoS , pp:229-238, Enschede, 2008 [20] S. Alcock, R. Nelson, “ Applicatio n fl o w control in Y ouTu be video streams”, ACM Comp. Commun. Revie w , V ol.41, No.2, pp:25-30, 2011. [21] Y .D. Xu, X.X. W u, J.C.S. Lui, “Cro ss-Layer Qos Sched uling for Layered Multic ast Streaming in OFDMA Wi reless N etwo rks”, W irel ess P ers. Commun. , V ol.51, No.3, pp:565-591, 2009. [22] Y .D. Xu, E . Altma n, et al., “Probabili s tic Analysis of Buffe r Starva tion in Marko vian Queues”, Pr oc. of IEEE Infocom 2012 . [23] Y .D. Xu, E. Altman, R. Elazouz i, S.E. Elayoubi and M. Haddad. “QoE Analysis of Media Streaming in Wi reless Data Networks” , Proc . of IFIP Network ing 2012 . [24] Y .D. Xu, S. E. Elayoubi, E . Altman and R. E lazouz i. “Impact of flow- le vel dynamics on QoE of video streaming in wireless networks”, Pr oc. of IEEE Infocom 2013 . [25] M. Abramo witz and I.Ste gun (E d.), “Handbook of Mathemati cal Func- tions”, 1970. [26] G.E. Box, W .G. Hunter and J.S. Hunter , “Statistic s for Experimen ters”. W iley Publisher . pp:130, 1978. [27] F . Dobrian, A. A wan, I. Stoica, V . Sekar , A. Ganjam, D. Joseph, J. Z han, and H. Zhan g, “ Understand ing the Impact of V ideo Qual ity on User Engagement” , Pr oc. of ACM Sigco mm 2011 , V ol.41, No.4, pp:362-373. 14 [28] S. Krishnan and R.K. S itara man, “V ideo Stream Quality Impacts V ie wer Behav ior: Inferring Causalit y using Quasi-Experimental Designs”, ACM /USENIX Internet Measureme nt Confere nce , 2012. [29] G.F . Golub and C.F . van Loan. Matrix Comput ations , Johns Hopkins Uni versity Press, 1986. [30] Y . Liu, F . Li, L. Guo, B. Shen and S. Chen. “ A Serve rs Perspecti ve of Interne t Streaming Deliv er to Mobile Devic es”, Pro c. of IEE E Infocom 2012 . Notation Definitions Section III λ Pack et arriv al rate µ Packet service rate ρ λ/µ p, q p = λ/ ( λ + µ ) , q = µ/ ( λ + µ ) x 1 Start-up threshold in pkts T 1 Start-up delay N File size in pkts P s Probabil ity of starva tion P s ( j ) Probabil ity of meeting j starv ations E ( k 1 ) First empty buf fer after the service of k 1 pkts S l ( k l , k l +1 ) Empty buf fer after the s ervice of pkt k l +1 gi ven that the pre vious emptiness happens at the departure of pkt k l U j ( k j ) Last empty buffe r observed after departu re of packe t k j P E ( k 1 ) Probabil ity of E ( k 1 ) J Maximum number of starv ations, J = ⌊ N x 1 ⌋ d Duration of a service slot in M/D/1 queue Section IV P i ( n ) Starv ation probability of a file with n packet s , gi ven that there are i packets in the buf fer Q i ( k ) Probabilit y that k pkts out of i lea ve the system during an inter-arr i val period P i ( j, n ) Probabil ity of j starvat ions with a file of size n , gi ven that the first pkt sees i pkts already there α Tra nsition rate from ON to OFF β Tra nsition rate from OFF to ON Q i ( k ) O N Probabil ity that k pkts out of i lea ve the system during an inter-a rriv al period at ON state Section V N p T otal number of packe ts that are served 1 /θ Mean of exponenti al file size distrib ution N m Minimum file size for Pareto distrib ution υ Exponent for Pareto distribut ion Mean of Normal distribt ion for log-normal σ Standard de viati on of Normal distribtion for log-normal Section VI C 1 ( x 1 ) QoE cost functio n for general situati ons C 2 ( x 1 ) QoE cost function for infinite media size with ρ < 1 Lamber tW Lambert W -function T ABLE I G L O S S A RY O F M A I N N O TA T I O N A P P E N D I X A. Asymptotic Analysis W e begin the asymptotic analysis with the following lemm a. Lemma 1: Define a fun ction y ( t ) = 1 √ π t 3 exp − v 1 x 2 t − v 2 t where the co nstants v 1 , v 3 and x satisfy v 2 ≥ 0 , x ≫ 0 and v 1 ≫ v 2 . The integral R ∞ x y ( t ) dt is approxima ted b y Z ∞ x y ( t ) dt ≈ exp − 2 x √ v 1 v 2 x √ v 1 (38) with a degre e of er ror O ( e − x ) . Proof: W e fir st show that y ( t ) is a bounded fun ction in the range t ∈ (0 , ∞ ) . lim t → 0 y ( t ) = lim t → 0 1 √ π t 3 exp − v 1 x 2 t = lim t → 0 exp − v 1 x 2 t · v 1 x 2 t 2 3 2 √ π t ≈ 2 v 1 x 2 3 t lim t → 0 y ( t ) The ab ove eq uation yield s lim t → 0 y ( t ) · 2 v 1 x 2 3 t − 1 = 0 . Since the expression 2 v 1 x 2 3 t + 1 appro aches infin ity as t → 0 , there mu st exist lim t → 0 y ( t ) = 0 . When t in creases to ∞ , it is easy to show lim t →∞ y ( t ) = 0 . Given that y ( t ) is continuou s in (0 , ∞ ) , it is also a bou nded functio n. Here, we suppose v 2 > 0 . By dif fer entiating y ( t ) over t , we obtain dy ( t ) dt = − exp − v 1 x 2 t − v 2 t t 3 √ π t v 2 t 2 + 3 2 t − v 1 x 2 . (3 9) Letting the deriv a ti ve dy ( t ) dt be 0, we ob tain the optimal t ∗ ( t ∗ > 0 ) to max imize y ( t ) , that is, t ∗ = √ 9 + 16 v 1 v 2 x 2 − 3 4 v 2 (40) When t ≤ t ∗ , y ( t ) is strictly inc reasing, and vice versa. The optimal v alue t ∗ is g reater th an x if ( v 1 − v 2 ) · x ≥ 3 / 2 . (41) Giv en that v 1 ≫ v 2 and x is large, eq.(41) is satisfied. Therefo re, th e defin ite integral satisfies Z x 0 y ( t ) dt ≤ x · y ( x ) . (42) According to [2 5](P1026 , Chapter 29), the f unction k 2 √ π t 3 exp ( − k 2 4 t ) ha s a Laplace transfor m exp( − k √ s ) . Therefo re, one can easily obtain the Laplace tr ansform of y ( t ) by y ∗ ( s ) = E [ e − st y ( t )] = 1 x √ v 1 exp − 2 x p v 1 ( s + v 2 ) . (43 ) The in tegral R ∞ 0 y ( t ) dt is obtained by Z ∞ 0 y ( t ) dt = lim s → 0 y ∗ ( s ) = exp − 2 x √ v 1 v 2 x √ v 1 . (44) The d efinite integral R ∞ x y ( t ) dt satisfies Z ∞ x y ( t ) dt ≥ exp − 2 x √ v 1 v 2 x √ v 1 − y ( x ) · x = exp − 2 x √ v 1 v 2 x √ v 1 − exp( − v 1 x − v 2 x ) √ π x . (4 5) W e her eby compar the two exp ressions y 1 := exp − 2 x √ v 1 v 2 x √ v 1 and y 2 := exp( − v 1 x − v 2 x ) √ π x in eq. (45), y 2 y 1 = r x π · exp − x ( √ v 1 − √ v 2 ) 2 . (46) 15 Giv en the con ditions v 1 ≫ v 2 , an d x ≫ 1 , the ratio has y 2 y 1 ≪ 1 . W e c an ap proxima te the integral R ∞ 0 y ( t ) dt by Z ∞ 0 y ( t ) dt ≈ exp − 2 x √ v 1 v 2 x √ v 1 . (47) with a degre e of er ror O ( e − x ) . Next we consider a special case with v 2 = 0 . The n y ( t ) is re written as y ( t ) = 1 √ π t 3 exp − v 1 x 2 t . It is easy to show that y ( t ) is strictly increasing when t ≤ 2 3 v 1 x 2 , and strictly decreasing when t > 2 3 v 1 x 2 . Repeating th e above steps in the case v 2 > 0 , we fin d Z ∞ 0 y ( t ) dt ≈ 1 x √ v 1 (48) which a lso m atches eq .(38). Ap proximating the starvation probability P s : The starvation probability is giv e n by P s = N − 1 X k = x 1 x 1 2 k − x 1 2 k − x 1 k p k − x 1 (1 − p ) k . (49) This equation contains the term o btained from the b inomial distribution, whic h is difficult to solve d irectly . W e n otice that the n umber of ev ents 2 k − x 1 is usually large in term of th e number of packets. The variables p and q are not very much dif f erent (o therwise th e server is either o ver-provisioning or und er-provisioning seriously) . Th is char acteristic facilitates us to appr oximate th e pdf of b inomial d istribution by th at of Gau ssian d istribution o n the basis o f central limit theory . According to [26], this approximatio n is accura te en ough if (2 k − x 1 ) p and (2 k − x 1 ) q a re both g reater than 5 , or the following ineq uality h olds, 1 √ 2 k − x 1 q q p − q p q < 0 . 3 . The mean a nd the variance of the bino mial distribution are (2 k − x 1 ) p a nd (2 k − x 1 ) pq r espectively . Th us, ther e exists 2 k − x 1 k − x 1 p k − x 1 (1 − p ) k ∼ 1 p 2 π pq (2 k − x 1 ) exp − (( k − x 1 ) − (2 k − x 1 ) p ) 2 2 pq (2 k − x 1 ) . T o be m ore exact, the absolute e rror of c.d.f. (integral of p.d.f) , g iv en by the Berry-Essen theo rem, is b ounded by 0 . 7655 ( p 2 + q 2 ) / p (2 k − x 1 ) pq . Then, the starvation prob- ability is expressed a s P s ≈ ∞ X k = x 1 x 1 / (2 k − x 1 ) p 2 π pq (2 k − x 1 ) exp − (( k − x 1 ) − (2 k − x 1 ) p ) 2 2 pq (2 k − x 1 ) = ∞ X k = x 1 x 1 p 2 π pq (2 k − x 1 ) 3 exp − ((2 k − x 1 )( 1 2 − p ) − x 1 2 ) 2 2 pq (2 k − x 1 ) ≈ Z ∞ x 1 x 1 exp − ((2 k − x 1 )( 1 2 − p ) − x 1 2 ) 2 2 pq (2 k − x 1 ) p 2 π pq (2 k − x 1 ) 3 dk ( 50) = x 1 2 √ 2 pq exp ( (1 − 2 p ) x 1 4 pq ) × Z ∞ x 1 1 p π b k 3 exp − b k (1 − 2 p ) 2 8 pq − x 2 1 8 pq b k d b k (51) ≈ x 1 2 √ 2 pq exp ( (1 − 2 p ) x 1 4 pq ) × Z ∞ 0 1 p π b k 3 exp − b k (1 − 2 p ) 2 8 pq − x 2 1 8 pq b k d b k . (52) The app roximatio n in (50) is o n the basis o f the Rieman n sum. T he appro ximation can be tightly bou nded becau se the function to be in tegrated decreases to 0 exponen tially . The exact error b ound can b e ob tained by comp uting both the righ t and the lef t Riemann sums. The equ ality (52) is o btained by replacing b k = 2 k − x 1 . W e replace v 1 and v 2 by 1 8 pq and (1 − 2 p ) 2 8 pq respectively . Th ere h as v 1 v 2 = 1 (1 − 2 p ) 2 , which is m uch larger than 1 since in r ealistic media streaming p is no t very far away fro m 1/2. The th reshold x is u sually large (i.e. mor e than 40 for th e start-up d elay of about 1 s). Theref ore, the approx imation in (52) from Lemma 1 is very tig ht. Substituting v 1 and v 2 by the cor respond ing values in Lem ma 1, we derive the asym ptotic starvation pr obability as P s ≈ exp h x 1 2 pq 1 2 − p − | 1 2 − p | i (53) as the file size is large enoug h. W e next discuss the c ases i) ρ ≤ 1 an d ii) ρ > 1 . I f ρ ≤ 1 , or e quiv alen tly p ≤ 1 2 , eq .(53) is 1 . I f ρ > 1 , or equ iv alently p > 1 2 , eq.(53) is simplified as P s ≈ exp x 1 (1 − 2 p ) 2 pq . (54)
Original Paper
Loading high-quality paper...
Comments & Academic Discussion
Loading comments...
Leave a Comment