The Case for Temporal Transparency: Detecting Policy Change Events in Black-Box Decision Making Systems
Bringing transparency to black-box decision making systems (DMS) has been a topic of increasing research interest in recent years. Traditional active and passive approaches to make these systems transparent are often limited by scalability and/or fea…
Authors: Miguel Ferreira, Muhammad Bilal Zafar, Krishna P. Gummadi
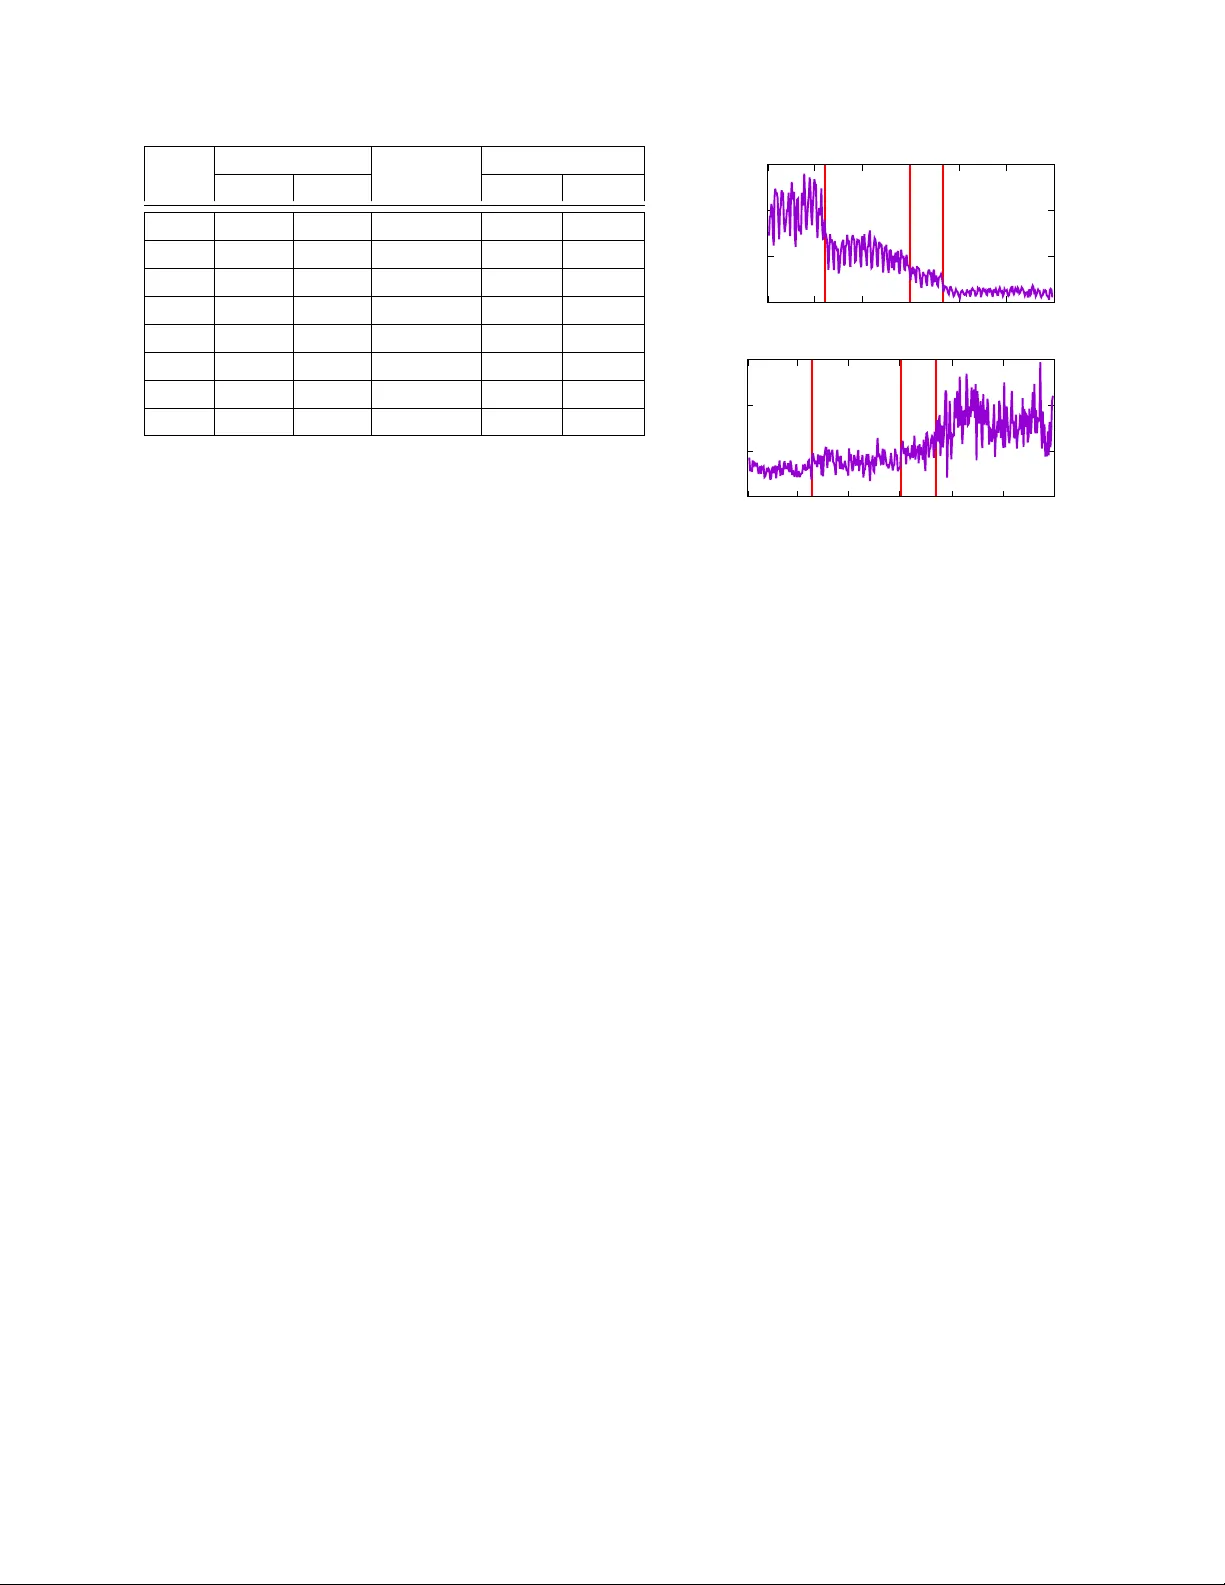
The Case for T emporal T ransparenc y: Detecting Polic y Change Ev ents in Black-Box Decision Making Systems Miguel Ferreira, Muhammad Bilal Zafar , Krishna P . Gummadi MPI-SWS, Germany { miferrei, mzafar , gummadi } @mpi-sws.org Abstract Bringing transparency to black-box decision mak- ing systems (DMS) has been a topic of increasing research interest in recent years. T raditional active and passi ve approaches to make these systems trans- parent are often limited by scalability and/or feasi- bility issues. In this paper, we propose a new no- tion of black-box DMS transparency , named, tem- poral transparency , whose goal is to detect if/when the DMS polic y changes ov er time, and is mostly in- v ariant to the drawbacks of traditional approaches. W e map our notion of temporal transparency to time series changepoint detection methods, and dev elop a frame work to detect policy changes in real-world DMS’ s. Experiments on New Y ork Stop-question- and-frisk dataset reveal a number of publicly an- nounced and unannounced policy changes, high- lighting the utility of our frame work. 1 Intr oduction In modern societies, it is widely accepted that de- cision making systems (DMS), particularly those whose outcomes affect people’ s liv es, need to be transpar ent . Ho we ver , these decision making sys- tems (example illustration in Figure 1) often act as black-boxes, where the precise decision making pol- icy or function ( f DMS ) is not known and hence the relationship between indi vidual inputs and outputs is not clear . A number of recent studies ha ve attempted to bring t ransparency to black-box decision making systems, be they driv en by machines (e.g., algorith- mic search and recommendation systems [9, 11]) or humans (e.g., stop and frisk decisions made by police [17, 18]). These studies attempt to rev erse- engineer or infer the decision making policy (the function f DMS ) either by (i) acti vely auditing the sys- tem with carefully crafted inputs and analyzing the resulting outputs [9, 11] or by (ii) passiv ely observ- ing the inputs and outputs of the system in opera- tion [17, 18]. The abov e two broad approaches to bringing trans- parency hav e their pros and cons: (i) activ e audits can help achiev e functional transpar ency , i.e. , learn the behavior of the decision function for dif ferent types of inputs, but they can be expensi ve and might not re veal much about the system’ s behavior under oper- ational conditions (where inputs are typically drawn from specific probability distributions ov er the input space), (ii) passiv e observ ations of the systems’ in- puts and outputs, on the other hand, can help achie ve operational transpar ency , but they are restricted to analyzing decision function behavior only on the limited set of operational inputs seen to date. Against this background, we make the case for a dif ferent notion of transparency that we call tempo- ral transparency , where the goal is to detect when and how the decision making policy (the function f DMS ) changes over time . Note that the objecti ves of temporal transparency are complementary but differ - ent from those of traditional functional or operational transparency . The motiv ating scenarios for temporal transparency are numerous. 1. Monitoring policy change events & alerting users. T emporal transparency enables one to track Decision Making System (DMS) f DMS Inputs Outputs F igure 1: The abstraction of a traditional DMS. The decision making policy ( f DM S ) is often un- known. Efforts to bring transparency to DMS fo- cus on inferring f DM S from inputs and outputs. and verify when and how policies of decision mak- ing systems, such as NYPD Stop-question-and-frisk program (NYPD SQF) 1 or Facebook’ s newsfeed al- gorithm, have changed ov er the years [19, 20]. It would be possible to monitor whether and when an announced policy change by public or priv ate orga- nizations has come into effect [4, 21]. Furthermore, any unannounced (or surreptitiously deployed) pol- icy changes can be detected and used to alert civil liberties and consumer protection groups to demand greater transparenc y [10]. Later in this paper, we de- tect sev eral instances of announced and unannounced policy changes in NYPD SQF program. 2. Feasible when other transparency approaches aren’t. T emporal transparency can be effecti v e ev en in scenarios when functional or operational trans- parency cannot be achiev ed. For instance, consider the NYPD SQF program. It is not feasible to ac- ti vely audit NYPD’ s decision making by generating artificial new inputs ( i.e. , pedestrians in NYC). One needs to rely on passi vely analyzing records of stops maintained by NYPD. But, as NYPD only records data for pedestrians that have been stopped and does not record data for all pedestrians that the police are observing, it is impossibly hard to infer the decision making policy (function) in its entirety . Howe ver , as we show later in the paper , these limited records are suf ficient to achie ve temporal transparency , i.e. , robustly detect a variety of policy changes imple- mented by NYPD ov er se veral years. 3. Finding targets f or other transparency ap- proaches. By detecting the points in time when the 1 https://en.wikipedia.org/wiki/Stop-and-frisk in New Y ork City decision making policy has changed, temporal trans- parency can help focus the more expensi ve tradi- tional approaches to transparency (like activ e audits or passiv e input-output analysis) to the short period of time before and after the policy change ev ents. Fo- cusing transparency efforts on policy change ev ents can help us better understand the magnitude and ef- fects of the policy changes on the outcomes of the decision making system. Intuiti vely , the basic idea behind detecting changes in decision making policy is as follo ws: as- sume we are giv en a time series of inputs and out- puts to the system. Our task is to detect if/when the decision making policy ( f DM S ) mapping inputs and outputs, has changed. Our intuition for detecting changes in f DM S is to look for temporal changes in outputs, where inputs remain relati vely stationary . In this paper , we argue that the problem of de- tecting policy change ev ents naturally fits existing frame works for detecting changepoints in time se- ries. Time series changepoint detection is a well- studied problem in statistics, signal processing and machine learning [5, 6, 8, 15, 22]. These studies of- ten work with the assumption that any time series with changepoints consists of observations drawn for different statistical distributions, and at e very changepoint, the distribution that the following ob- serv ations will be drawn from, changes. Hence, the changepoint detection problem boils down to recov- ering the parameters of the underlying distributions that best explain the observations. As a by-product of this process, one also obtains a list with locations of corresponding changepoints. Howe ver , apply- ing changepoint detection techniques on real-world datasets, subjected to noise, outliers, seasonal and weekly patterns, and different magnitudes of the de- tected changes, is not a straightforward task. T o tackle these challenges, we de v eloped a frame- work called Tetra (for T emporal T ransparency), that builds on Bayesian changepoint detection tech- niques [7, 22]. Specifically , in order to make the earlier methods robust to transitory disturbances in the observed features and aiming at detecting only significant policy shifts, we pose changepoint de- tection as a maximum a posteriori (MAP) problem and propose a dynamic pr ogr amming (DP) solution. Our frame work operates in an unsupervised fashion with the goal of finding the location of changepoints that best explain the underlying observations. Gi ven an initial set of parameters to tune the sensitivity of the changepoint detection, it can return a ranked list of changepoints ordered with likelihood that a cer- tain point indeed corresponds to a policy change. This flexibility can help the system administrator in terms of adjusting the significance le v el of the polic y changes that are to be detected. Applying Tetra on a real-world DMS, NYPD SQF program, provides interesting insights into the policy changes deployed by NYPD. Specifically , we detect sev eral polic y changes deployed by NYPD be- tween 2006 and 2013, including changes announced publicly . 2 Detecting P olicy Change Events In this section, we outline the design of our frame- work Tetra , whose goal is to detect policy change e vents in a DMS. Let I t and O t be the observ able inputs and out- puts of a DMS at time t . Let x t be a statistic com- puted over I t and O t . Consider computing x t for a period of time [ T ] . The set of observed features col- lected during such time period, x T 1 = { x 1 ,...,x T } , can be considered as a time series of data. The problem at hand consist of finding the opti- mal set of changes—that is, the number of changes and their respectiv e locations—which best explain the time series x T 1 . This setup can le verage time se- ries changepoint detection frameworks. Specifically , we choose to build on Bayesian probabilistic change- point detection setups described in [7, 22] . Adhering to the notation presented in [7], the problem abov e can then be formulated as: maximize P ( τ m 1 ,m | x T 1 ) (1) subject to 1 <τ 1 < ··· <τ m , τ j − τ j − 1 ≥ d, m ∈M , where the optimal parameters ∗ m and ∗ τ ∗ m = { ∗ τ 1 ,..., ∗ τ ∗ m } represent the optimal number of changepoints, and their locations, respectively . M is defined as a symmetric set around an initial esti- mation of the number of changes ˆ m in x T 1 . ˆ m can be provided by the user as a part of the domain kno wl- edge. In case the user chooses not to specify it, we consider it to be the result of computing the CUSUM chart ([6, 15]) of x T 1 and analyzing its first deri v ati ve. Detecting significant policy regimes. Notice that, considering we are interested in detecting significant policy regimes, we add an additional constraint to the traditional Bayesian changepoint detection frame- works: a minimum length d of each time series seg- ment (policy regime). The flexibility in choosing d allo ws for precise tunability of the frame work ac- cording to a user’ s definition of significant policy regime (which may v ary based on the specific ap- plication domain being considered). Solving the MAP Problem. Gi ven the user-defined likelihood function, P ( x s t | m ) , of the time series data under consideration and P ( τ j | τ j +1 ) as the prior dis- tribution of changepoint process, right hand side of Eq. (1) can be decomposed into: maximize P ( m ) P ( x T 1 | m ) subject to m ∈M maximize P ( τ m 1 | x T 1 ,m ) subject to 1 <τ 1 < ··· <τ m τ j − τ j − 1 ≥ d . (2) By noticing the sequence of realizations ( τ m 1 ) form a discrete-time Marko v Chain, the solution to the second term of Eq. (2) is yielded by a dynamic program, whose recurrence relation for j ∈ [1: m ] is dictated by: T ( j,τ j ) = maximize P ( τ j +1 | τ j ,x T 1 ,m ) T ( j +1 ,τ j +1 ) subject to τ j − τ j − 1 ≥ d. (3) In particular , the solution to such dynamic program is gi ven by: T (0) = maximize P ( τ 1 | x T 1 ,m ) T (1 ,τ 1 ) subject to τ 1 ≤ d. (4) W e fix the prior distribution of number change- points, P ( m ) , to be a discrete Laplacian distribution (a symmetric distribution) of mean ˆ m and scale β . This choice allo ws the construction of the set M to be considered as the range of values around ˆ m which comprise a percentage α of probability mass func- tion of P ( m ) , and the scale β of the distrib ution translates into the confidence in the initial estimate ˆ m . The tuning parameters ( α ,β and other parame- ters regarding the analysis of the CUSUM chart) in- fluence the shape of the set M , and therefore the sen- siti vity of the setting. The joint posterior probability P ( τ m − j +1 | τ m − j ,x T 1 ,m ) is e v aluated as in [7]. Prepr ocessing. In order to remove underlying noise in the input time series x T 1 , and improve the reliabil- ity of the results, we apply the following preprocess- ing steps to x T 1 before subjecting it to changepoint detection setup outlined abov e: 1. Outlier Removal. Outliers are identified through comparison with the shifted moving av erage, and posteriorly remov ed. The size of the moving average windo w , as well as the threshold for outlier identification, must be adapted to each particular problem accord- ing to a user’ s definition of significant policy regime, and bearing in mind the variance in the dataset and minimum length d of each time series segment. The remov al of outliers helps us ignore the extreme and noisy outputs of the DMS, providing rob ustness to our setup. 2. Featur e Scaling. W e scale the time series data x T 1 in a [0 − 1] range, in order to simplify the setting of the tuning parameters. 3. Filtering and Smoothing W e use a Savitzky- Golay filter [16] in order to smooth the input time series data. The parameters of the filter , its window length and the degree of its polyno- mial fit, are directly related with the sensiti vity of the changepoint detection frame work. 3 Detecting P olicy Changes in NYPD SQF Pr ogram In this section, we apply our changepoint detection frame work Tetra on a dataset related to NYPD SQF program. The SQF program has been a sub- ject of intense public debate since its conception [3], and went through multiple publicly announced pol- icy changes [3, 12]. Our goal in this section is to not only check if/when the policy changes announced by NYPD were implemented but also to explore any un- expected polic y changes. T o this end, we model the SQF program as a black- box DMS. W e construct the time series x t from the follo wing observed feature: number of stops made per day under the SQF program. W e assume the time series x t to have been drawn from a Gaussian distri- bution. Consequently , we model the likelihood func- tion of x t as a Student’ s t-distribution, whose hyper- parameters consist of its maximum likelihood solu- tion (MLE), computed by deploying the expectation maximization (EM) algorithm. W e model the prior distribution of changepoint process to be uniform, to reflect the fact that the location of a policy change e vent is independent of the location of the pre vious one. Finally we specify the minimum length d of each time series segment to be 15 . W e deployed Tetra on the stops made during the years 2006 to 2013 (inclusi ve). The complete records of the stops made under SQF program are made publicly av ailable at the official website of NYC. 2 Our framew ork detected a total of 31 changepoints. Since the number of detected changepoints is consid- erably large, we systematically analyzed each of the changepoints. As a result, we were able to separate the changepoints into follo wing categories (listed in- di vidually for each year in T able 1): 1. Seasonal patterns. These changepoints corre- spond to slight drops in number of stops made each day around mid-year (summer) and close to the end of the year (winter). This pattern persists for almost all of the years considered for the analysis. 16 out of the 31 detected changepoints f all under this category . 2. Unusual input changes. These changepoints po- tentially correspond to unusual changes in ev eryday pedestrian population of NYC. For example, we de- tect a changepoint on October 29, 2012, marking a consistent drop in number of stops made per day un- 2 nyc.gov/html/n ypd/html/analysis and planning /stop question and frisk report.shtml Y ear Seasonal Unusual Policy S W inputs A U A 2006 1 1 − − − 2007 2 1 1 − − 2008 1 1 1 − − 2009 − 2 − − 1 2010 1 1 − − 2 2011 1 1 2 − 1 2012 2 − 2 1 1 2013 − 1 − − 3 T able 1: List of detected changepoints from Jan- uary 01 to 2006, to December 31, 2013. S— Summer; W—Winter; A—Announced, U A—Un- announced. til the next changepoint on Nov ember 10, 2012. This drop is most probably due to Hurricane Sandy and its aftermath [1]. In fact, on the day when the change- point occurred—October 29, 2012—the number of stops made over the city is merely 193 , as compared to an av erage of 1147 stops per day for the previous week. Similarly , a changepoint marking an increase in number of stops per day on September 22, 2011 could potentially correspond to Occupy W all Street Mov ement, that started on September 17 [2]. In to- tal, 6 out of 31 changepoints map to this category . 3. (Un)Announced Policy changes. The change- points that correspond to neither of the above two categories were likely caused by policy changes im- plemented by NYPD (because they cannot be ex- plained by input changes). For example, we detect a drop in the number of stops made per day start- ing March 26, 2012. This change is in fact a con- sequence of a publicly announced policy change im- plemented by NYPD, where, ‘increased training’ and staf fing in ‘high impact’ zones results in an overall decline in number of stops [12]. Detection of this changepoint highlights the utility of our framew ork in verifying the policy changes announced by the gov erning entities. Next, we focus on analyzing changepoints that do not map to a publicly announced policy change. In 0 600 1200 1800 Jan Mar May Jul Sep Nov Jan # stops per day 0 10 20 30 Jan Mar May Jul Sep Nov Jan % arrests per day F igure 2: Changepoints detected in NYPD SQF data from January 01, 2013 to December 31, 2013. particular , we focus the year 2013. The changepoint detection frame work yields 3 un-announced changes for this year . Figure 2 (top panel) shows the number of stops made per day and the detected changepoints (in the form of vertical lines). Remarkably , this series of changepoints correspond to three abrupt policy changes which successi vely brought down the num- ber of stops per day to eventually 10% of the stop rate at the beginning of the year . It is important to note that the 2013 SQF program was subject of intense debate during the 2013 Mayoral Election campaign, with a major candidate denouncing it [14] and a court stating that the SQF policy violated the constitutional rights of the citizens [13]. Consequently , these vari- ations are likely to be associated with un-announced policy adjustments resulting from these e vents. In addition to studying the number of stops, we also analyzed the percentage of stops leading to ar- rests per day in 2013. The changepoint analysis frame work detects three changepoints presented in Figure 2 (bottom panel), close to the changepoints detected in the stop-rate analysis. This clear mapping between the changepoints yielded by both observed features reveals a systematic change in SQF policy by NYPD, indicating that the policy change did not just concern the number of stops per day , b ut also the natur e of the stops. 4 Conclusion and Futur e W ork In this paper we made the case for temporal trans- parency where the goal is to detect when and how the DMS policy changes ov er time. W e built a frame work Tetra using prior advances in Bayesian changepoint detection. Applying Tetra on a real- world dataset sho ws that it can systematically detect possible policy change ev ents in practice. In the fu- ture we hope to generalize our framework to apply it to a broader range of real world DMS’ s. More specif- ically , we plan to address the following points: 1. The current implementation relies on an ‘of fline’ setting that needs access to the whole time series data to detect possible changepoints. Hence, the frame- work cannot be deployed on streaming datasets, where one might want to detect changepoints on the fly , e.g. , Facebook newsfeed algorithm. W e are cur- rently expanding it to incorporate an ‘online’ setting in order to cater to such scenarios. 2. As shown in Section 3, analyzing the struc- ture of policy changes by jointly considering mul- tiple observed features (number of stops, percent- age of stops leading to arrests, in parallel) can pro- vide more insights into how the DMS interplays with dif ferent features, hence revealing more information about policy changes. T o address this point, we plan to generalize our framework to multi-variate feature spaces. Refer ences [1] http://www . marketwatch . com/ story/cuomo- orders- nyc- transit- system- to- shut- down- 2012- 10- 28 . [2] http://occupywallst . org/about/ . [3] Stop-and-frisk in Ne w Y ork City. https://en.wikipedia.org/wiki/Stop-and- frisk in New Y ork˙City . [4] Al Jazeera America. Monitor: Changing NYPD stop-frisk practices a challenge. http://america . aljazeera . com/ articles/2016/2/17/monitor- changing- nypd- stop- frisk- practices- a- challenge . html , Febru- ary 2016. [5] D. Barry and J. A. Hartigan. Product partition models for change point problems. The Annals of Statistics , pages 260–279, 1992. [6] M. Basseville, I. V . Nikiforov , et al. Detec- tion of abrupt changes: theory and application , volume 104. Prentice Hall Engle wood Cliffs, 1993. [7] P . Fearnhead. Exact and efficient bayesian inference for multiple changepoint problems. Statistics and computing , 16(2):203–213, 2006. [8] P . Fearnhead and Z. Liu. On-line inference for multiple changepoint problems. Journal of the Royal Statistical Society: Series B (Statistical Methodology) , 69(4):589–605, 2007. [9] A. Hannak, G. Soeller , D. Lazer , A. Mislove, and C. W ilson. Measuring price discrimination and steering on e-commerce web sites. In Pr oc. IMC’14 . [10] Huffington Post. Facebook Just Made A Pretty A wkward Change T o Y our Profile. http://www . huffingtonpost . com/ entry/facebook- intro- work u s 5 7694831e4b015db1bca97c9 . [11] M. L ´ ecuyer , G. Ducoffe, F . Lan, A. Papancea, T . Petsios, R. Spahn, A. Chaintreau, and R. Geambasu. Xray: Enhancing the web’s transparency with differential correlation. In USENIX Security’14 . [12] New Y ork Post. Major decline in NYPD stop-frisks. http://nypost . com/2013/ 02/09/major- decline- in- nypd- stop- frisks . [13] New Y ork Times. Judge Rejects Ne w Y orks Stop-and-Frisk Policy . http://www . nytimes . com/2013/ 08/13/nyregion/stop- and- frisk- practice- violated- rights- judge- rules . html . [14] Newsweek. Did Bill De Blasio K eep His Promise T o Reform Stop-and-Frisk? http: //europe . newsweek . com/did- bill- de- blasio- keep- his- promise- reform- stop- and- frisk- 266310 . [15] E. Page. Continuous inspection schemes. Biometrika , 41(1/2):100–115, 1954. [16] A. Savitzk y and M. J. Golay . Smoothing and differentiation of data by simplified least squares procedures. Analytical chemistry , 36(8):1627–1639, 1964. [17] R. S. Sharad Goel, Justin M. Rao. Precinct or Prejudice? Understanding Racial Disparities in Ne w Y ork City’ s Stop-and-Frisk Policy. Annals of Applied Statistics , 2015. [18] C. Simoiu, S. Corbett-Davies, and S. Goel. T esting for Racial Discrimination in Po- lice Searches of Motor V ehicles. SSRN abs.2811449 , 2016. [19] The New Y ork Times. Facebook to Change Ne ws Feed to Focus on Friends and Fam- ily . http://www . nytimes . com/2016/ 06/30/technology/facebook- to- change- news- feed- to- focus- on- friends- and- family . html , June 2016. [20] T ime. Here’ s What F acebook’ s Big Ne w Change Really Means. http: //time . com/4387908/facebook- change- news- feed- update/ , June 2016. [21] C. S. T imes. Chicago police and aclu agree to major changes in stop-and-frisk policy . http://chicago . suntimes . com/ politics/chicago- police- and- aclu- agree- to- major- changes- in- stop- and- frisk- policy/ , August 2015. [22] X. Xiang and K. Murphy . Modeling chang- ing dependency structure in multi v ariate time series. In Pr oc. ICML’07 .
Original Paper
Loading high-quality paper...
Comments & Academic Discussion
Loading comments...
Leave a Comment