Temporal divergence in cropping pattern and its implications on geospatial drought assessment
Time series data on cropping pattern at disaggregated level were analysed and its implications on geospatial drought assessment were demonstrated. An index of Cropping Pattern Dissimilarity (CP-DI) between a pair of years, developed in this study, proved that the cropping pattern of a year has a higher degree of similarity with that of recent past years only and tends to be dissimilar with longer time difference. The temporal divergence in cropping pattern has direct implications on geospatial approach of drought assessment, in which, time series NDVI data are compared for drought interpretation. It was found that, seasonal NDVI profiles of drought year and normal year did not show any anomaly when the cropping patterns were dissimilar and two normal years having dissimilar cropping pattern showed different NDVI profiles. Therefore, it is suggested that such temporal comparisons of NDVI are better restricted to recent past years to achieve more objective interpretation.
💡 Research Summary
This paper investigates how temporal changes in cropping patterns affect the reliability of geospatial drought assessment that relies on satellite‑derived NDVI time series. The study area is Mahaboobnagar district in Andhra Pradesh, India, comprising 64 administrative blocks with a total net sown area of roughly 750,000 ha. Crop‑area statistics for seven Kharif seasons (2000‑2006) were obtained from the state Directorate of Economics and Statistics, and NDVI composites from IRS‑1C/1D (180 m) and ResourceSat‑1 (60 m) were used to generate block‑level seasonal NDVI profiles for selected years (2000, 2005, 2006).
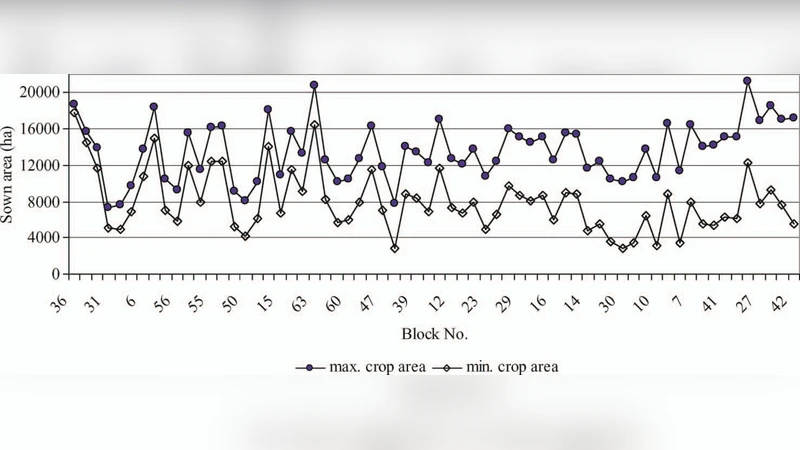
The authors first quantify inter‑annual variability of total sown area using the coefficient of variation (CV). Most blocks display CV values between 20 % and 30 %, with a minority exceeding 40 %, indicating substantial year‑to‑year fluctuations. The maximum‑minimum (max‑min) gap analysis shows that in many blocks the minimum sown area is less than half of the maximum, underscoring the sensitivity of agricultural land use to rainfall deficits.
To capture changes in the composition of crops, the paper introduces a Cropping Pattern Dissimilarity Index (CP‑DI). For any pair of years j and k, CP‑DI is defined as the sum of absolute differences in the percentage of each crop i (i = 1…n) between the two years:
CP‑DI₍jk₎ = ∑₍i=1₎ⁿ |Yᵢⱼ − Yᵢₖ|
where Yᵢⱼ is the proportion of crop i in year j. CP‑DI ranges from 0 (identical patterns) to 100 × n (completely different). The authors adopt a threshold of 20, mirroring the IMD practice that a rainfall deviation ≤ ‑20 % signals a dry period; CP‑DI ≤ 20 denotes “similar” cropping patterns, while values > 20 indicate “dissimilar”.
Applying CP‑DI to the seven‑year dataset reveals a clear temporal trend: adjacent years (e.g., 2005‑2006) have low CP‑DI (10‑15), whereas pairs separated by five or more years (e.g., 2000‑2006) exhibit higher values (30‑45). This suggests that cropping decisions, driven by climate variability, market forces, and policy, accumulate over time, leading to divergent crop mixes.
The core of the study examines how these pattern changes influence NDVI‑based drought detection. Seasonal NDVI curves were extracted for each block for three focal years: 2006 (a declared drought year), 2005 (a normal year), and 2000 (another normal year). When the CP‑DI between two years was ≤ 20 (2005‑2000), the NDVI profiles were virtually indistinguishable, and any anomaly could be confidently attributed to moisture stress. Conversely, when CP‑DI exceeded the threshold (2006‑2005), the NDVI curves showed no clear drought signal despite the known water deficit in 2006; the differing crop composition masked the vegetation stress that NDVI would otherwise capture. A similar pattern emerged when comparing two normal years with CP‑DI > 20: their NDVI trajectories diverged, potentially leading to false alarms if the analyst assumes a constant crop background.
These findings highlight a critical limitation of conventional NDVI time‑series drought monitoring: it implicitly assumes a stable crop background. When the underlying crop mix changes, the same NDVI value can correspond to very different canopy structures, leaf area indices, and water use patterns, thereby compromising the interpretation of anomalies. The authors therefore recommend two practical safeguards: (1) restrict year‑to‑year NDVI comparisons to a recent window (e.g., the last three years) where CP‑DI is likely low, and (2) use CP‑DI as a pre‑screening tool to select only those reference years whose cropping patterns are sufficiently similar to the target year.
Beyond the methodological contribution, the paper provides actionable insights for drought management agencies. By monitoring CP‑DI alongside NDVI, agencies can better differentiate genuine moisture stress from artefacts caused by crop switching, leading to more accurate early warning systems. Moreover, the analysis of total sown area variability underscores the need for flexible relief policies that account for rapid shifts between cultivated and fallow land in response to drought.
In summary, the study (i) introduces a simple yet effective index to quantify temporal cropping pattern divergence, (ii) demonstrates that high CP‑DI values can obscure NDVI‑based drought signals, and (iii) proposes a workflow that integrates CP‑DI screening into remote‑sensing drought assessment, thereby enhancing the robustness of satellite‑derived drought monitoring in agriculturally diverse, rain‑fed regions.
Comments & Academic Discussion
Loading comments...
Leave a Comment