Using Big Data to Decode Private Sector Wage Growth
The U.S. labor market is dynamic and complex, and understanding wage data across different segments of the workforce is critical to providing policymakers and business leaders with actionable insights. There is no labor index that assesses the labor market performance at such a detailed level as the ADP Research Institute’s Workforce Vitality Report (WVR). Drawing on the actual, aggregated and anonymous payroll data of 24 million Americans paid by ADP, the WVR looks at key dynamics and market indicators including wage growth, hours worked and turnover rate. Unlike other data sets, the WVR calculates wage growth of individual workers on a quarter-to-quarter basis, avoiding the deviations caused by various workplace occurrences, like when new workers are hired and older ones retire. In this paper, Dr. Ahu Yildirmaz, head of the ADP Research Institute, drills down into wage growth by industry, age, gender and income level, as well as for both job holders and job switchers. Using WVR data, Ahu walks through those factors contributing to overall shifts in wage growth, the future of the labor market and what this data means for today’s U.S. workforce.
💡 Research Summary
The paper presents a comprehensive examination of wage growth in the U.S. private sector using the ADP Research Institute’s Workforce Vitality Report (WVR), which leverages anonymized payroll data from roughly 24 million workers. Unlike traditional labor statistics that rely on aggregate surveys and are vulnerable to distortions caused by hiring spikes, retirements, and other population shifts, the WVR calculates quarter‑to‑quarter wage growth at the individual level. This micro‑level approach eliminates the “composition effect” and provides a clearer picture of how workers’ earnings evolve over time.
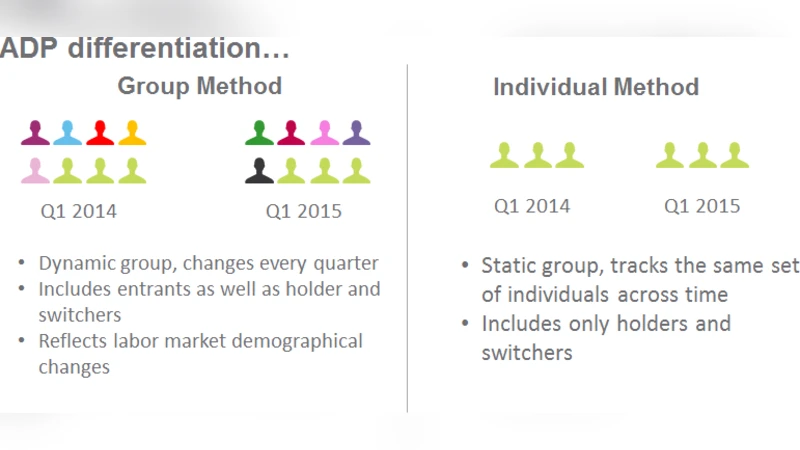
The authors first outline the methodology: payroll records are aggregated monthly, cleaned for outliers, and then linked across quarters to track each employee’s earnings trajectory. Workers are classified as “stayers” (those who remain with the same employer) or “switchers” (those who change jobs). Wage growth is then broken down by industry, age cohort, gender, and income percentile.
Key findings include:
-
Industry Differentials – High‑value sectors such as technology, information services, finance, and professional services exhibit the strongest wage growth, averaging 4‑5 % per quarter. Traditional service industries—retail, hospitality, and food services—lag behind with growth rates below 1 %. The gap reflects the premium placed on digital skills and the rapid adoption of automation in high‑skill occupations.
-
Age and Income Segments – Workers aged 25‑34 in the middle‑income bracket experience the most pronounced earnings gains, driven by career mobility and upskilling opportunities. In contrast, workers 55 + in the top 10 % income tier show modest growth, indicating earnings plateau as retirement approaches.
-
Gender Gap – Women’s average wage growth trails men’s by 0.3‑0.5 percentage points across most cohorts. The disparity is especially evident among high‑income women, suggesting that gender‑based pay differentials persist even at senior levels.
-
Switchers vs. Stayers – Job switchers enjoy a “switch premium” of roughly 2.5 percentage points higher quarterly wage growth than stayers. This premium is most pronounced in high‑skill industries where talent mobility is high, and it diminishes in low‑skill sectors where switching is less common.
-
Income‑Based Mobility – The top 10 % of earners are disproportionately represented among switchers and realize 6‑7 % quarterly wage gains when they change jobs. Conversely, the bottom 20 % have low switching rates and experience growth under 2 %, highlighting limited upward mobility for low‑wage workers.
-
Future Outlook – Assuming continued economic recovery and a stable monetary policy environment, high‑skill, high‑wage occupations are projected to sustain 3‑4 % annual wage growth. Low‑skill, low‑wage jobs are expected to be more volatile, with growth hovering around 0‑1 % and potentially widening earnings inequality as automation displaces routine tasks.
Policy implications drawn from the analysis are multifold. First, the “switch premium” suggests that facilitating labor mobility—through targeted retraining subsidies, tax incentives for job‑changing, and portable benefits—could accelerate wage growth for a broader segment of the workforce. Second, narrowing the gender gap will likely require stronger pay‑transparency mandates and enforcement of equal‑pay legislation. Third, boosting productivity in low‑wage sectors calls for investment in digital infrastructure and industry‑specific skill‑building programs. Finally, encouraging high‑skill workers to transition between firms can enhance overall economic dynamism and innovation.
In conclusion, the study demonstrates that big‑data, micro‑level payroll analytics can uncover nuanced wage dynamics that aggregate surveys miss. By dissecting wage growth across multiple dimensions, the WVR provides actionable insights for policymakers, business leaders, and researchers seeking to understand and shape the evolving U.S. labor market.
Comments & Academic Discussion
Loading comments...
Leave a Comment